This paper is a draft version of the paper published in IEICE Transac- tions on ... idea common among those solutions is to provide a new ex- ..... TCP/IP protocol processing because there was no increase ..... Server. In Proceedings of 4th Annual Linux Showcase .... Web Polygraph is a benchmark tool suite for performance.
Reducing Processor Usage on Heavily-loaded Network Servers with POSIX Real-time Scheduling Control Eiji Kawai
Youki Kadobayashi
Suguru Yamaguchi
Nara Institute of Science and Technology
Abstract
pushes up the network bandwidth and the number of Internet users drastically [2], and it also increases the number of concurrent sockets that a today’s highly-loaded server has to handle up to thousands or tens of thousands. Nowadays, the polling I/O is recognized as an I/O multiplexing mechanism with a high processing cost [3]. The large waste of processing power incurs various troubles. They include service degradation, high electronic power consumption, and worsened MTBF (mean time between failures) of server hosts caused by the severe heat produced by the processors. Especially, the electronic power required by a recent microprocessor has been skyrocketing to gain more performance. To make matters worse, the rapid advancement of network technologies makes the scale of server clusters drastically large. Hence, it is a serious issue in large scale service providers such as an Internet data center (iDC) where a great number of heavilyloaded network servers are operated. One of the reasons of such high overhead in the polling I/O is widely believed to be the high cost of socket list scanning. When the number of concurrent sockets grows large, the scanning cost also grows. To solve this issue, several solutions have been proposed so far [3, 4, 5, 6, 7, 8]. The idea common among those solutions is to provide a new explicit event-notification mechanism between the kernel and the server program, which replaces the polling I/O. However, a drawback of such solutions is that they require major modification in the operating system kernel. In addition, from a viewpoint of a server developer, the programming model based on the explicit event-notification mechanism is largely different from the one based on the traditional polling I/O. Thus, many network servers are still developed with the polling I/O model. Another reason of the high overhead of the polling I/O is its excessively frequent invocations because of the eventdriven style to handle concurrent sockets. Figure 1 (a) depicts the processing loop cycle in a typical network server based on the polling I/O. When a server thread manages thousands of concurrent sockets, the frequency of event occurrences at the server is considerably high2 . In such situa-
Polling I/O mechanisms on the Unix platform such as select() and poll() cause high processing overhead when they are used in a heavily-loaded network server with many concurrent open sockets. Large waste of processing power incurs not only service degradation but also various troubles such as high electronic power consumption and worsened MTBF of server hosts. It is thus a serious issue especially in large-scale service providers such as an Internet data center (iDC) where a great number of heavilyloaded network servers are operated. As a solution of this problem, we propose a technique of fine-grained control on the invocation intervals of the polling I/O function. The uniqueness of this study is the utilization of POSIX realtime scheduling to enable the fine-grained execution control. Although earlier solutions such as an explicit event delivery mechanism also addressed the problem, they require major modification in the OS kernel and transition from the traditional polling I/O model to the new explicit event-notification model. On the other hand, our technique can be implemented with low cost because it just inserts a few small blocks of codes into the server program and does not require any modification in the OS kernel. key words: polling I/O, POSIX real-time scheduling, interval control, processor utilization, network programming
1
Introduction
On the Unix platform, the polling I/O mechanism [1], which is usually implemented by select() and poll(), is widely used to implement a network server. With the polling I/O, a single network server thread1 can handle more than one network socket concurrently. The polling I/O is efficient in a sense that the polling I/O makes it unnecessary to allocate a thread for each connection established at a server. However, the advancement of network technologies This paper is a draft version of the paper published in IEICE Transactions on Information and Systems, Vol. E88-D, No. 6 (June 2005). 1 In this paper, we use the term “thread” to indicate an execution unit including one which is traditionally termed a “process.”
2 It is a highly rare case that a network server opens thousands of sockets
1
2
Create a socket list Create a socket list Invoke select() or poll()
2.1
Check the interval and block itself
Polling I/O and Its Issues Polling I/O
The polling I/O is a programming model implemented by select() and poll() on the Unix operating systems. With a single invocation of the polling I/O function, a server Process each I/O-ready Process each I/O-ready thread can check each state of a set of sockets and wait until socket socket one of them becomes I/O-ready before normal I/O execution such as read I/O and write I/O. After the polling I/O, (a) Traditional model (b) Our model the thread can request the read/write I/O selectively only on Figure 1: Processing flow cycles (the main loop) of a typical the I/O-ready sockets, and thus it can handle multiple concurrent sockets efficiently without being blocked on the nornetwork server thread based on the polling I/O model. mal I/O. In other words, the polling I/O forms an implicit event notification mechanism for network I/O. This sophistions, the invocation rate of the polling I/O is unnecessarily ticated feature of the polling I/O has led many developers high and the server falls in a busy loop without idle time. to adopt this I/O multiplexing model for high performance From the above observation, we define the goal of this network servers. study as follows. An event occurs
Invoke non-blocking select() or poll()
• Alleviate the processor usage and make it proportional 2.2 to the service throughput.
Related Work on More Efficient I/O Multiplexing
• Keep the server performance at least as high as that Although the polling I/O is an efficient I/O multiplexing with the traditional polling I/O. mechanism, it is highly expensive especially when it han• Retain the polling I/O programming model to make the dles a large number of concurrent sockets. To resolve this implementation cost low. issue, several research groups have proposed new mechaTo achieve this goal, we propose a technique of fine-grained nisms that replace the polling I/O. Although their programcontrol on the invocation intervals of the polling I/O func- ming interfaces and implementations are different from tion. The technique prevents too frequent invocations of each other, their basic ideas are almost the same; they dethe polling I/O and eases the processor utilization, which veloped an operating system mechanism that watches state can consequently also improve the server performance. The changes of each socket and notifies the server process of the uniqueness of this study is the usage of POSIX real-time changes explicitly through a special interface. scheduling [9] available in most Unix operating systems today. It enables fine-grained accurate control on the execution of the server threads in milliseconds with a simple “stop-and-run” style as depicted in Fig. 1 (b). This simple mechanism also shields the server developers from the drawbacks of real-time scheduling. A program that uses real-time scheduling is easy to develop but difficult to debug because it often causes a system-wide freeze [10]. We need deep consideration in the implementation strategy to prevent a thread under real-time scheduling from executing continuously for too long. The remainder of this paper is organized as follows. Section 2 surveys the polling I/O and its issues including related work. Section 3 presents the basic idea and the design of the interval control mechanism with POSIX real-time scheduling. Section 4 describes the prototype implementation and the benchmark test environment. Experimental results are provided in Sect. 5. Section 6 gives a brief discussion about the application of the interval control mechanism to actual network servers. Last, we conclude this paper in Sect. 7.
2.2.1 Explicit Event Delivery Mechanism Banga et al. [3] developed a technique that a server process registers a set of sockets as an interest set in the operating system and the operating system keeps watch on the sockets and delivers the information of the state changes to the process through a special event queue between the kernel and the process. Provos et al. [4] developed a similar interface, /dev/poll3 , on Linux and evaluated its performance. In addition, they compared the performance of the /dev/poll interface and that of the signal-driven I/O model with POSIX real-time signals. Real-time signals are another explicit event delivery mechanism defined in POSIX real-time extensions [9]. They also proposed an improved mechanism [5] of the real-time signal-driven I/O model. It allows a server process to receive multiple realtime signals at once. 3 The /dev/poll interface was developed earlier on other commercial operating systems such as Solaris [8].
but receives only a small number of service requests.
2
Lemon [6] developed a general-purpose interface called “kqueue” on FreeBSD as an event delivery queue and solved the false notification problem. After a socket is closed, events on the socket in the event queue will deliver false information because the closed descriptor may be allocated to a new socket. The kqueue mechanism clears such events when a socket is closed. Chandra et al. [7] discussed the issue of signal queue overflow in the signal-driven I/O model with real-time signals. They developed a new signal queue that holds only one entry for each socket to resolve that issue. The mechanisms proposed by the previous work remove the processing cost of scanning the sockets in the polling I/O. However, it is a tough work to implement them in an existing network server system based on the polling I/O model. Their programming models are largely different from the polling I/O model and therefore they require considerable modification in the server program and/or the operating system.
2.3.1 Synchronization of accept() to Polling I/O The improved performance of the multi-accept server implies that one of the real problems of the polling I/O is the tight dependency of the invocation rate of accept(), which is equivalent to the connection processing rate, on that of select(). The situation is described more precisely as follows. As the network speed increases, also the number of concurrent sockets and the invocation rate of select() grows. However, this trend changes at a certain point because the processing time of each select() call increases as well. This means that there is an upper limit to the invocation rate of select(), i.e., that of accept(), and it can be lower than the actual connection arrival rate. In that case, some new connections are refused by the server. This bottleneck can be removed easily by breaking the tight dependency between accept() and select() like the multi-accept server does. 2.3.2 Severe CPU Starvation by Frequent Invocations
2.2.2
The frequency of the events that the state of a socket changes to I/O-ready is almost directly proportional to the network speed. This suggests that the growth of network speed raises the invocation rate of the polling I/O. The high invocation rate of the polling I/O consumes a substantial proportion of the CPU cycles. To make matters worse, each execution of the polling I/O is quite inefficient. The number of I/O-ready sockets returned by a single polling I/O invocation is usually small. It can be just one4 even when the size of a socket set given as an argument to the polling I/O grows large.
Multi-accept Server
The multi-accept server is a server with a simple technique presented in [7]. Although it does not decrease the processor usage, it improves the service performance. It is based on the traditional polling I/O model with select(). We can easily apply this technique also to a network server that utilizes poll(). The only modification introduced into the traditional select()-based server is that it invokes accept() multiple times, not once, when the listening port turns out to be I/O-ready by select(). This technique was proved to improve the performance scalability compared with the traditional select()-based server. Such scalability is one of the common goals of all the tech- 3 Interval Control on Polling I/O niques proposed by the earlier work. This interesting phewith POSIX Real-time Scheduling nomenon made a hint for our research because it suggests that the polling I/O itself does not include a critical draw3.1 Basic Idea back in its processing framework from a viewpoint of server performance. In other words, the processing cost of socket The problem focused in this study is the severe proceslist scanning in the polling I/O is just a minor issue. sor cycle starvation caused by frequent invocations of the polling I/O. As a natural consequence, control on the invocation intervals of the polling I/O functions can be a good 2.3 Real Problems of Polling I/O solution. As shown in Fig. 1 (b), the server thread measures the processing time of the main loop by time-stamping, and As a consequence of the survey in the previous subsection, blocks itself for a short time if the loop interval is too short. we summarize the real problems of the polling I/O in the This mechanism can decrease the frequency of the polling following two features. One is the tight synchronization of I/O invocations and thus the processor utilization on the accept() to the polling I/O, which degrades the connec- server host. tion processing rate. The other is the severe CPU starvation, 4 Herein, we assume the timeout value given to the polling I/O is not which worsens the performance scalability and increases zero. When the timeout value is zero, the polling I/O returns to the caller the power consumption. In this paper, we focus on the latter immediately after checking the whole socket set given as an argument even one since the former one can be easily resolved by several when there are no I/O-ready sockets. In that case, the returned value can already-known techniques such as the multi-accept server. be zero. 3
3.2
1 2 3 4 5 6 7 8 9 10 11 12 13 14 15 16 17 18 19 20 21 22 23 24 25 26 27 28 29 30 31 32 33 34
POSIX Real-time Scheduling
Our basic idea seems to be simple enough to implement. However, on the traditional Unix platform, there is a problem of preemption by other threads. When the number of concurrent sockets becomes large, the real processing time of the server thread grows. This long processing time increases the possibility that the server thread receives unexpected context switches during its execution. Because the self-blocking time of the server thread can be calculated from the pre-configured interval threshold of the processing cycle and the measured processing time in the server thread by time-stamping, the unexpected interruptions of the server thread incur less self-blocking time. If the measured processing time of the main loop grows larger than the pre-configured threshold, the interval control is disabled since such situations may also mean that the server is really overloaded. To solve this issue, we have two possible ways. One is to remove such unexpected interruptions and the other is to measure the real processing time of the server thread by some other means. However, the latter solution cannot be implemented in most Unix operating systems without a special fine-grained resource accounting mechanism on processor cycle usage. It often requires special implementation and causes a high overhead. Therefore, we use POSIX realtime scheduling as the former solution. POSIX real-time scheduling is widely available in most Unix operating systems today. It is fairly simple in itself and easy to utilize. There are only two scheduling classes defined: FIFO (first-in first-out) and RR (round robin). However, the threads under POSIX real-time scheduling can block all the other threads with lower priority forever, which often causes a system-wide freeze [10]. Consider a case that a server host settled in a distant place. If a server program operated on that host under real-time scheduling gets troubled by some reason such as a bug in the program, the system can be response-less and we may not be able even to reboot the host remotely. Hence, we have to keep any threads under real-time scheduling from too long continuous execution.
3.3
// set rt scheduling realtime_priority(); // main loop for (;;) { // prepare the socket list prepare_conn_list(list); // check the interval gettimeofday(&now, NULL); ptime = time_diff(&now, &prev); // sleep or yield if (ptime < min_cycle) { #ifdef STATIC_MIN_CYCLE set_time(&stime, min_cycle - ptime); #else set_time(&stime, ptime * ratio); #endif normalize_priority(); // non-rt nanosleep(&stime, NULL); realtime_priority(); // rt } else { realtime_priority(); // non-rt sched_yield(); realtime_priority(); // rt } gettimeofday(&prev, NULL); // process each connection if (!empty(list)) // poll(), read/write I/O proc_conns(list); }
Figure 2: Pseudo code implementation of the server thread with real-time scheduling.
freezes. Figure 2 presents the pseudo code implementation.
In this implementation, we designed two kinds of interval control mechanisms: static interval control and dynamic interval control. The static interval control is enabled if the macro STATIC MIN CYCLE in the pseudo code presented in Fig. 2 is defined. Otherwise, the dynamic interval control is enabled. The difference between the two mechanisms is in their methods to calculate the self-blocking time. The static interval control sets the threshold of the cycle interval at a static value, which is given by the server configuration, and it calculates the remaining time as the self-blocking time. In this case, if the processing time increases, the self-blocking time decreases inversely. Contrastingly, the dynamic interval control sets the self-blocking time proportional to the processing time at the ratio given in the configuration. Thus, when the processing time increases, also the self-blocking time increases.
Design of Interval Control
The purpose to use POSIX real-time scheduling is only to avoid unnecessary interruptions of the server thread. In other words, we make the server thread partially nonpreemptive by real-time scheduling. Therefore, we set the server thread under real-time scheduling only during its processing time. In addition, when the processing cycle interval really grows larger than the threshold, the server thread should be released from real-time scheduling and yield to some other threads. Otherwise, the server thread under realtime scheduling monopolizes the processor and the system 4
listening port
accepted Listen socket
accept() connections to clients
Clients
Retrieve Thread Thread
connections to origin servers
Origin Servers
descriptor managed notification by Polling I/O
I/O Thread
Client Cluster
Network delay: 40msec Packet loss ratio: 0.05%
100Mbps
HTTP transactions
100Mbps
Request Request and and Response 1Gbps Response
connection establishment if necessary
managed by Polling I/O
Service delay 300msec
HTTP transactions
Chamomile Accelerator
Web Server Accelerator
Figure 3: Major threads spawned in Chamomile.
4
Prototype Implementation Benchmark Tests
4.1
Server Cluster
Figure 4: WebAxe-4 network environment.
and
several new features in Chamomile in addition to the loop interval control mechanism, which are summarized in A.
Prototype Implementation
4.2
We designed the interval control mechanism of the polling I/O invocations and implemented it in the Chamomile5 web accelerator6 for its evaluation. Chamomile has a multithreaded architecture that consists of listen threads, I/O threads, and retrieve threads as depicted in Fig. 3. The listen thread invokes accept() on the listening port, and the newly accepted sockets are passed to the I/O thread. The I/O thread manages them using the polling I/O concurrently with other sockets. In case an HTTP object needs to be retrieved from an origin server to accommodate a client request, the retrieve thread establishes a new connection to the server and processes the HTTP transaction. We have two reasons we used Chamomile for the evaluation target. First, Chamomile has already solved the synchronization problem of the polling I/O and accept(), which was discussed in Sect. 2.3. This problem is caused when the polling I/O checks the listening port together with other connections already established and accept() is invoked only once after the polling I/O notifies that the listening socket is ready to read. One of the solutions of this problem is the multi-accept server. On the other hand, Chamomile does not check the listening port by the polling I/O, i.e., it pre-spawns a thread for each listening socket, which invokes accept() on the socket. Hence, they can freely invoke accept() without the interference of the polling I/O. The second reason we used Chamomile is its reality. We can obtain a practical evaluation of the implementation cost and the performance improvement of our solution, since Chamomile is a real web accelerator program, not a toy implementation. For example, Chamomile was tested in enterprise services [11]. In this study, we also implemented
Benchmark Tests
In order to verify the effect of the interval control on the processor utilization and the service performance, we conducted benchmark tests on Chamomile. During the tests, we profiled the operating system kernel to investigate the processor utilization. 4.2.1
Web Polygraph
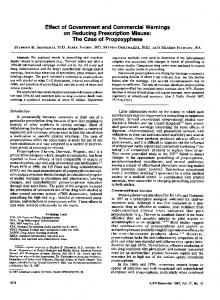
In the benchmark tests, we used Web Polygraph7 , a benchmark software for web cache systems. Our primary object of using Web Polygraph is the evaluation of the server behavior in a more realistic environment. Web Polygraph has a prepared workload called WebAxe-48 , which simulates content size distribution, content modification, dynamic contents, and HTTP/1.1 persistent connections. We can thus obtain a more realistic estimate of the influence of the interval control mechanism. This viewpoint is notably useful for server developers because they desire a realistic evaluation of the implementation cost and the system improvement. B describes more details about Web Polygraph and the WebAxe-4 workload. 4.2.2 Test Network Environment Figure 4 illustrates the experimental environment for the Web Polygraph tests with the WebAxe-4 workload. All the hosts including a client cluster, a server cluster, and a web server accelerator are connected to a single switch. To simulate the Internet environment, network delay, packet loss, and service delay is configured. Each client sends an HTTP request to the accelerator. Then, the accelerator returns a 7 http://www.web-polygraph.org/
5 http://www.chamomile-proxy.org/ 6A
8 http://www.web-polygraph.org/docs/workloads/ webaxe-4/
web accelerator is also known as a web reverse proxy server.
5
total processor usage including user programs, and the ratio Table 1: Specification of the devices used for the benchmark of the processor usage of poll() in the kernel to that of tests. the whole kernel, respectively. Server Client
Pentium III 866 MHz, 512 MB, Intel Pro/100, FreeBSD 4.3 Pentium III 1.4 GHz, 512 MB, Intel Pro/100, FreeBSD 4.3 Pentium III 800 MHz, 1 GB, NetGear GA620T (1000baseT), Linux 2.5.17 NetGear FS518T (1000baseT×2, 100baseT×16)
5.1.1
Static Interval Control
Web Polygraph sends requests to the evaluation target server at the configured rate as accurate as possible. With this kind of benchmark tool, it is basically difficult to estimate the exact upper limit of the server performance because measuring the performance of an overloaded server is highly difficult. When the target server gets overloaded in a test, the Web Polygraph processes also get overloaded since unprocessed requests quickly fill up their request queues and finally overflowed them. In this situation, we can only know that the performance of the server is lower than the configured request rate. We thus remove such inaccurate data from the experimental results and only show the results when Chamomile processes all the requests from Web Polygraph successfully.
The static interval control tries to adjust the intervals of the processing loop cycle constant. The “poll() interval” in Fig. 5 indicates the interval. From Fig. 5 (a) and Fig. 5 (b), we can observe the static interval control mechanism reduced the processor usage. Without the interval control, the processor usage in the kernel was on a high level over 60 % and the total processor usage was 100 % at every request rate in the tests. On the other hand, with the static interval control, the total processor usage proportional to the request rate was achieved, which is the major objective of this study. Comparing Fig. 5 (a) and Fig. 5 (c), the reduction in the processor usage in poll() is proved to be the dominant factor of that in the kernel. Let us see the precise data in Table 2. It describes the processor usage in the poll() system call and the whole kernel. The column C is the reduction of the processor usage in the kernel, and the column H is that in the poll() system call. The column I is the percentage of H in C, and it shows that over 60 % of the processor usage reduction in the kernel was achieved by eliminating the excess invocations of poll(). Last, we have to note that the column G in Table 2 means that the total processing cost of the poll() system call invocations was almost constant. This phenomenon proves that the implemented interval control mechanism worked correctly. In addition, it also explains implicitly that the linear increase of the processor usage in the kernel against the request rate, which is shown in Fig. 5 (a), was caused by other I/O functions in the kernel such as read/write I/O and TCP/IP protocol processing because there was no increase of the processor usage in poll().
5
5.1.2
Accelerator Switch
response directly to the client in case of a cache hit, or forwards the request to one of the servers and relays the response to the client in case of a cache miss. The hardware specification of the hosts and the switch used for the tests is listed in Table 1. 4.2.3
Difficulties in Estimating the Exact Upper Limit of the Server Performance
Experimental Results
The dynamic interval control sets the self-blocking time at a value proportional to the processing time in each processing cycle. The “block time ratio” in Fig. 6 means the ratio of the self-blocking time to the processing time. The processor usage behavior of the dynamic interval control depicted in Fig. 6 is highly similar to that of the static interval control in Fig. 5. Hence, we can repeat almost the same argument as that for the static interval control. In the same way as Table 2, we extract sample data with the dynamic interval control in Table 3. The column G in Table 3 shows that the processing cost of the poll() system call invocations decreased slightly as the request rate increased. The decreased processing cost of poll() means that the intervals of the polling I/O invocations grew as the
In this section, we first present the kernel profile results during the tests to see how the processor utilization of the kernel and user-land threads is reduced by our proposed mechanism. Then, we discuss the server performance, i.e., service throughput and response time.
5.1
Dynamic Interval Control
Processor Utilization
For kernel profiling, we used kernprof9 , a Linux kernel profiler released by Silicon Graphics. Figure 5 and 6 show the processor usage during the benchmark tests. The left, center, and right graphs depict the kernel processor usage, the 9 http://oss.sgi.com/projects/kernprof/
6
80
80
60 40
no interval control poll() interval = 10 ms poll() interval = 20 ms poll() interval = 30 ms poll() interval = 40 ms
20 0
1000
1200
1400
1600
1800
40
60 40
no interval control poll() interval = 10 ms poll() interval = 20 ms poll() interval = 30 ms poll() interval = 40 ms
20 0
2000
CPU Usage Ratio (%)
100
CPU Usage (%)
CPU Usage (%)
100
1000
Request Rate (req/s)
1200
1400
1600
1800
30 25 20 15 10 5 0
2000
no interval control poll() interval = 10 ms poll() interval = 20 ms poll() interval = 30 ms poll() interval = 40 ms
35
1000
Request Rate (req/s)
(a) kernel
1200
1400
1600
1800
2000
Request Rate (req/s)
(b) total
(c) poll() in kernel
100
80
80
60 40
no interval control block time ratio = 0.5 block time ratio = 1.0 block time ratio = 1.5 block time ratio = 2.0
20 0
1000
1200
1400
1600
1800
40
60 40
no interval control block time ratio = 0.5 block time ratio = 1.0 block time ratio = 1.5 block time ratio = 2.0
20
2000
CPU Usage Ratio (%)
100
CPU Usage (%)
CPU Usage (%)
Figure 5: CPU usage with the static interval control.
0
Request Rate (req/s)
(a) kernel
1000
1200
1400
1600
1800
2000
Request Rate (req/s)
no interval control block time ratio = 0.5 block time ratio = 1.0 block time ratio = 1.5 block time ratio = 2.0
35 30 25 20 15 10 5 0
1000
1200
1400
1600
1800
2000
Request Rate (req/s)
(b) total
(c) poll() in kernel
Figure 6: CPU usage with the dynamic interval control. The ranges of the x-axes are adjusted the same as those in Fig. 5. 1100
request rate increased. This is another evidence of the correctness of the interval control implementation.
Response Time (ms)
5.2
1000
Throughput and Response Time
900 800
no interval control poll() interval = 10 ms poll() interval = 20 ms poll() interval = 30 ms poll() interval = 40 ms
700
The main goal of this study is to mitigate the processor uti600 lization on a heavily-loaded network server. However, the 500 service performance should not be degraded by the interval 400 control. Figure 7 and 8 show the mean response time of 300 1000 1200 1400 1600 1800 2000 the Chamomile web accelerator with and without the interRequest Rate (req/s) val control under the Web Polygraph WebAxe-4 benchmark tests. The former figure is for the static interval control, and Figure 7: Mean response time with the static interval conthe latter is for the dynamic interval control. trol. 5.2.1
Static Interval Control was increased by about 100 milliseconds. Especially when we set the threshold at 30 or 40 milliseconds, the response time grew too large and such configuration is unacceptable in actual service operation. This large increase in the response time was caused mainly by the interleaved poll() invocation technique implemented in Chamomile (see A for details). Since the upper threshold of the total number of the concurrent sockets was fixed at 7,000 in the benchmark tests, Chamomile required at least seven main loop cycles, i.e., seven polling I/O invocations, to scan all the sockets10 .
From the graphs in Fig. 7, we can see that when we configured the loop interval at 10 ms and 20 ms, our interval control mechanism achieved the response time on almost the same level as the traditional polling I/O without the interval control does. Especially, the loop interval of 10 ms, the response time was lower than that without the interval control. In addition, we can also observe that the flat distribution of the response time was achieved. This is another evidence of the correctness of the interval control implementation. Next, we can see that the configured static intervals give a considerable influence on the response time. When we increased the threshold by 10 milliseconds, the response time
10 This count does not include the impact of the sockets closed after the HTTP transactions completed and the sockets newly accepted. The number
7
Table 2: Detailed analysis of the processor usage in case of the static interval control with 20 milliseconds of the interval threshold. Note that the data in the column D and F , which are also plotted in Fig. 5 (c), are the ratio of the processor usage of poll() in the kernel to that of the kernel. Thus the data in the column E and G are normalized. Processor usage in kernel (%) Request rate (req/s) 1000 1200 1400 1600 1800 2000
no control
static control
difference
no control
A 64.66 67.26 69.96 72.26 75.46 n/a
B 39.07 46.03 53.87 59.90 65.79 70.02
C :A−B 25.59 21.23 16.09 12.36 9.67 n/a
D 32.20 27.61 23.42 19.87 14.73 n/a
Processor usage in poll() (%) no static static control control control norm. norm. E :A×D F G:B×F 20.82 12.63 4.93 18.57 11.04 5.08 16.38 9.63 5.19 14.36 8.91 5.34 11.12 7.77 5.11 n/a 5.95 4.17
difference
difference ratio (%)
H :E−G 15.89 13.49 11.19 9.02 6.01 n/a
I : H/C 62.1 63.5 69.5 73.0 62.2 n/a
Table 3: Detailed analysis of the processor usage in case of the dynamic interval control with 1.0 of the blocking-time ratio. Note that the data in the column E and G are normalized like those in Table 2. Processor usage in kernel (%) Request rate (req/s) 1000 1200 1400 1600 1800 1100 Response Time (ms)
1000 900 800
no control
dynamic control
difference
no control
A 64.66 67.26 69.96 72.26 75.46
B 44.67 50.13 55.71 60.71 66.40
C :A−B 19.99 17.13 14.25 11.55 9.06
D 32.20 27.61 23.42 19.87 14.73
Processor usage in poll() (%) no dynamic dynamic control control control norm. norm. E :A×D F G:B×F 20.82 16.26 7.26 18.57 13.87 6.95 16.38 12.58 7.01 14.36 11.29 6.85 11.12 8.81 5.85
600 500 400 1000
1200
1400
1600
1800
difference ratio (%)
H :E−G 13.56 11.62 9.37 7.51 5.27
I : H/C 67.8 67.8 65.8 65.0 58.2
ful not to set up the interval at too small a value. The interval control mechanism imposes a small overhead of measuring the processing time, changing the scheduling policy, and blocking (or yielding) the server thread. Thus, the smaller the interval threshold is set up, the larger the overhead grows. That is the reason for the slightly worsened maximum throughput with 10 ms interval. On the other hand, the experimental results also show that if we set up the interval threshold appropriately, the overhead is negligible. In case of Chamomile, when we configured the interval at 20–40 ms, the maximum service throughput was even enhanced to 2,000 req/s.
no interval control block time ratio = 0.5 block time ratio = 1.0 block time ratio = 1.5 block time ratio = 2.0
700
300
difference
2000
Request Rate (req/s)
Figure 8: Mean response time with the dynamic interval control. The range of the x-axis is adjusted the same as that in Fig. 7. 5.2.2 Dynamic Interval Control Last, from a viewpoint of service throughput, the maximum service throughput with 10 ms interval (1,600 req/s) was slightly lower than that without the interval control Figure 8 depicts the server response time with the dynamic (1,800 req/s). This result indicates that we should be care- interval control mechanism. When we configured the block time ratio at 0.5, the response time was lower than that withof the main loop cycles required to scan all the concurrent sockets can be out the interval control. It shows that also the dynamic inlarger than seven. terval control improved the service response time. 8
6
Application to Actual Network Servers
such a severe situation. The advantages of our mechanism are summarized as follows. • Reduced processor utilization.
The interval control mechanism proposed in this paper is simple and generic enough to apply to an actual network server. However, it is difficult to decide the best configuration for the interval control. Basically, the server configuration should conform to the operational policy of the server, i.e., the relationship among the priorities of lower processor usage, higher service throughput, lower service latency, and so on. In addition, the best configuration for a server varies also according to the server system (e.g., hardware, service, architecture, and implementation) and the environments (e.g., network speed and workload). Therefore, the best configuration obtained from the experiments in this study (i.e., the interval time of 10–20 ms for the static interval control and the block time ratio of 0.5 for the dynamic interval control) should not be simply applied to other systems without deep consideration. In general, the major advantage of the static interval control is its higher maximum service throughput than that of the dynamic interval control. From the experimental results obtained in this study, we can conclude that the interval should be set carefully especially for the static interval control. The following items are the caveats when we use the static interval control.
• Improved server performance. • Low implementation cost. When integrating the interval control mechanism into an actual network server, we should be careful enough to choose appropriate parameter values. Especially, the static interval control requires deep knowledge and consideration on the server system, the service protocols, and the workload. Therefore, it is safer to use the dynamic interval control when such information is not available.
Acknowledgments This research was partially supported by PRESTO, Japan Science and Technology Agency, and the Ministry of Education, Science, Sports and Culture, Grant-in-Aid for Young Scientist (B), 16700068, 2004.
References [1] Marshall Kirk McKusick, Keith Bostic, Michael J. Karels, and John S. Quarterman. The Design and Implementation of the 4.4 BSD Operating System. Addison-Wesley, 1996.
• A configuration with too small interval results in lower maximum service throughput. • A configuration with too large interval results in unacceptably high service latency.
[2] Lawrence G. Roberts. Beyond Moore’s Law: Internet Growth Trends. IEEE Computer, 33(1):117–119, January 2000.
• A single static interval configuration is not suitable for a wide variety of workloads.
[3] Gaurav Banga, Jeffrey C. Mogul, and Peter Druschel. A Scalable and Explicit Event Delivery Mechanism for UNIX. In Proceedings of USENIX Annual Technical Conference, pages 253–265, June 1999.
Consequently, it is preferable to start with the dynamic interval control setting the block time ratio at 0.5 rather than the static interval control when we operate an actual server in which the interval control mechanism is integrated. If the higher maximum service throughput is required, we can adopt the static interval configuration with great care after we obtain enough data about the workload characteristics and the system behavior.
7
[4] Niels Provos and Chuck Lever. Scalable Network I/O in Linux. In Proceedings of 2000 USENIX Annual Technical Conference, June 2000. [5] Niels Provos, Chuck Lever, and Stephen Tweedie. Analyzing the Overhead Behavior of a Simple Web Server. In Proceedings of 4th Annual Linux Showcase & Conference, October 2000.
Conclusion
[6] Jonathan Lemon. Kqueue: A Generic and Scalable Event Notification Facility. In Proceedings of 2001 USENIX Annual Technical Conference, June 2001.
In this study, we have proposed two kinds of the interval control mechanism of the polling I/O using POSIX realtime scheduling: the static interval control and the dynamic interval control. The research goal is to alleviate the processor utilization of a network server especially when it is heavily-loaded with a large number of concurrent sockets. The benchmark tests proved our solution to be effective in
[7] Abhishek Chandra and David Mosberger. Scalability of Linux Event-Dispatch Mechanisms. In Proceedings of 2001 USENIX Annual Technical Conference, June 2001. 9
[8] Shridhar Acharya. Using the devpoll (/dev/poll) A.2 Dynamic Control on Connection TimeInterface. Technical Articles, March 2002. http: out //access1.sun.com/techarticles/ For a fair discussion, we have to give much attention to the devpoll.html number of concurrent sockets because the processing cost [9] Bill O. Gallmeister. POSIX.4: Programming for the of the polling I/O is highly dependent on it. When the perReal World. O’Reilly & Associates, Inc., 1995. sistent connections are enabled, the number of concurrent connections can be considerably large, which is determined [10] Linux manual page of sched setscheduler(2), by a variety of factors such as connection/request arrival August 1999. rate, users’ behavior, and connection timeout. The main [11] Eiji Kawai, Akira Shirahase, Kiyoshi Tsukada, and purpose of the experiments in this study is to analyze the Suguru Yamaguchi. Practical Migration Strategy to performance of the polling I/O with a large number of conIPv6 for Enterprise Web Services. In Proceedings of current sockets. It is therefore a good idea to keep the numthe 11th International World Wide Web Conference, ber of concurrent connections constant. To achieve that end, we implemented in Chamomile a May 2002. mechanism that controls the connection timeout dynami[12] Setting up FreeBSD-4.3 for use with Polygraph. cally, considering the number of the concurrent connechttp://www.measurement-factory.com/ tions. The parameter we added to Chamomile was the upper docs/FreeBSD/4.3.TMF/ threshold number of concurrent sockets, which was set at 7,00013 . To keep the number of concurrent sockets around [13] Luigi Rizzo. Dummynet: a Simple Approach to the the threshold, Chamomile checks it at every 100 millisecEvaluation of Network Protocols. ACM Computer onds and decreases the connection timeout by one second Communication Review, 27(1):31–41, 1997. whenever it detects the number of connections exceeding the threshold. The connection timeout is increased by one A Implementation Details of second when the number of connections stays below the threshold for consecutive 10 seconds.
Chamomile Web Accelerator
A.3
We implemented our interval control mechanism into the Chamomile web accelerator. In addition, we also implemented several other mechanisms in Chamomile and the operating system. In this appendix, we describe them especially from a viewpoint of relevance to this study.
A.1
Resolution of Kernel Timer
Interleaved Polling I/O
Our solution requires blocking the server thread for a short time in milliseconds by nanosleep(). Although nanosleep() receives an argument of the sleep time in nanoseconds, most of the Unix operating systems do not implement such a fine-grained timer mechanism. The source code of Linux, which we used as a development and experiment platform, has a macro definition of HZ and the resolution of the kernel timer mechanism is defined as 1/HZ second. In our experiments, we defined the value of HZ as 1,000, which means that the resolution of the kernel timer is 1 millisecond. Also Web Polygraph, which works on customized FreeBSD [12], uses such a fine-grained kernel timer.
We implemented an interleaved invocation mechanism of the polling I/O in Chamomile. The interleaved polling I/O is a useful technique especially when a network server has to handle thousands and more concurrent sockets with poll(). Naive implementation of such a server gives all the concurrent sockets to a single poll() invocation, which requires relatively large time to scan the large socket list11 . In this case, the connections newly accepted have to wait until the server thread finishes the large cycle. The interleaved polling I/O technique divides such a large socket B Web Polygraph and WebAxe-4 list into smaller ones12 and allows the newly accepted conWorkload nections to be put in the socket list after a shorter cycle. Thus, this technique improves the service latency especially Web Polygraph is a benchmark tool suite for performance on the new connections. evaluation of web cache servers with elaborate and realistic workloads. Web Polygraph uses a client cluster and an 11 There is an upper limit of the number of sockets that the polling I/O can accept as its argument. We assume that such limitation is removed in origin server cluster in the benchmark tests as depicted in advance. 12 In the benchmark tests, Chamomile divided the open sockets into multiple sets of 1,024 sockets or less.
10
13 The absolute upper limit of the number of concurrent sockets was also set statically at 10,000.
Table 4: The requests and responses defined in WebAxe-4. Method Cache Control
GET: 98.4 %, POST: 1.5 %, HEAD: 0.1 % 200 to IMS Requests† : 5 %, 304 to IMS Requests: 10 %, No Cache (reload): 5 %, No Control: 80 % † An IMS request is a request including an “If-Modified-Since” line in its header. Table 5: The content types defined in WebAxe-4. Type image HTML download other
Response Size exp. dist. (mean: 4.5 KB) exp. dist. (mean: 8.5 KB) log-normal dist. (mean: 300 KB, std. dev.: 300 KB) log-normal dist. (mean: 25 KB, std. dev.: 10 KB)
Fig. 4. To test a web accelerator, the WebAxe-4 workload can be used, which is enclosed in the workload set of the Web Polygraph package. We give a concise overview of the WebAxe-4 workload in this appendix.
Cachability 80.0 % 90.0 % 95.0 % 72.0 %
Ratio 65.0 % 15.0 % 0.5 % 19.5 %
network I/O performance, not the I/O performance of disk drives. As a consequence, we observed that Chamomile achieved 73–75 % of hit ratio against the request sequences generated by Web Polygraph, whose theoretical maximum hit ratio is configured at 80 % in the WebAxe-4 workload. The hit ratio was almost constant through the tests. Thus B.1 HTTP Transactions on WebAxe-4 the traffic volume generated in the tests was almost directly Table 4 and Table 5 are the summary of the characteristics of proportional to the request rate, about 45 Mbps against HTTP transactions defined in WebAxe-4. A huge number 1,000 request/s. of requests with those characteristics are sent to the web accelerator, and the accelerator returns cached content in case of cache hit or relays the requests to one of the origin servers in case of cache miss. The total size of the content working set, which is a content set frequently accessed by the client cluster, is set at 1 GB.
B.2
Network Environment on WebAxe-4
To emulate a realistic environment, delay and packet loss ratio is inserted in the network that connects the client cluster and the web accelerator. The inserted network delay is 40 milliseconds and the packet loss ratio is 0.005 % in both directions on the network. The delay and packet loss are emulated by Dummynet [13] integrated in FreeBSD, which is a recommended system for Web Polygraph tests. In addition, as service latency on the origin servers, forced service delay of 300 milliseconds is also inserted in the origin server cluster. As for the amount of network traffic generated in the tests, there are two major factors that give a large influence on the traffic volume: the request rate and the cache hit ratio. The cache hit ratio is dominantly dependent on the size of the cache implemented in the accelerator, which we fixed at 768 MB through the benchmark tests. All of this cache area was prepared on main memory because the objective of those benchmark tests in this study is to evaluate the 11