Reducing Energy Usage with Memory and Computation-Aware Dynamic Frequency Scaling Michael A. Laurenzano† , Mitesh Meswani† , Laura Carrington† , Allan Snavely† , Mustafa M. Tikir† , Stephen Poole‡ {michaell,mitesh,lcarring,allans,mtikir}@sdsc.edu,
[email protected] †
Performance Modeling and Characterization Laboratory, San Diego Supercomputer Center ‡ Oak Ridge National Laboratory
Abstract. Over the life of a modern computer, the energy cost of running the system can exceed the cost of the original hardware purchase. This has driven the community to attempt to understand and minimize energy costs wherever possible. Towards these ends, we present an automated, fine-grained approach to selecting per-loop processor clock frequencies. The clock frequency selection criteria is established through a combination of lightweight static analysis and runtime tracing that automatically acquires application signatures - characterizations of the patterns of execution of each loop in an application. This application characterization is matched with a series of benchmark loops, which have been run on the target system and exercise it various ways. These benchmarks are intended to form a covering set, a machine characterization of the expected power consumption and performance traits of the machine over the space of execution patterns and clock frequencies. The frequency that confers the best power-delay product to the benchmark that most closely resembles each application loop is the one chosen for that loop. The application’s frequency management strategy is then permanently integrated into the compiled executable via static binary instrumentation. This process is lightweight, only has to be done once per application (and the benchmarks just once per machine), and thus is much less laborious than running every application loop at every possible frequency on the machine to see what the optimal frequencies would be. Unlike most frequency management schemes, we toggle frequencies very frequently, potentially at every loop entry and exit, saving as much as 10% of the energy bill in the process. The set of tools that implement this scheme is fully automated, built on top of freely available open source software, and uses an inexpensive power measurement apparatus. We use these tools to show a measured, system-wide energy savings of up to 7.6% on an 8-core Intel Xeon E5530 and 10.6% on a 32-core AMD Opteron 8380 (a Sun X4600 Node) across a range of workloads.
1
Introduction
Energy costs have become a significant portion of the costs involved in the operational lifetime of largescale systems. These costs have impacts that manifest
2
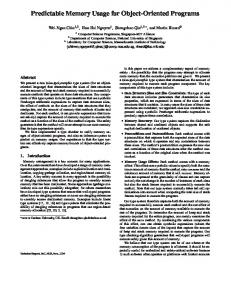
themselves in economic, social and environmental terms. It is therefore prudent to attempt to understand and minimize these costs where possible. With that goal in mind, in this work we introduce a methodology that facilitates dynamic voltage frequency scaling (DVFS) based on the expected impact that operating at some frequency will have on application performance and power consumption. This methodology is then leveraged in order to choose fine-grained clock frequency settings (potentially a different frequency for each loop) for the application that minimizes system-wide energy use. Along with this methodology, we present a set of open source tools that automates the entire process. Certain classes of scientific problems and subproblems exhibit memory bound behavior in that the time to solution for the problem is decided primarily by the proximity, size and speed of available memory. Historically, the amount of memory available to computer hardware has increased at an exponential rate[1]. Nevertheless, many applications can, and will continue to, use all of the memory available to them. This means that it is important to consider the impact of physically distant data on performance and power consumption. To facilitate processor frequency scaling as a means of reducing power consumption, many modern processors have been designed to operate at a different clock frequency than certain parts of the memory subsystem[2]. This observation, along with the notion that some applications spend much of their time waiting on data that is physically distant, implies that the execution of such applications may suffer only small or acceptable performance losses when operating at lower clock frequencies, which in turn yields lower power consumption rates. Clock frequency management policies that are in use today, however, generally do not take full advantage of this opportunity. They tend to rely on very broad coarse-grained measures of processor activity/idleness to determine when it is prudent to lower clock frequency based on perceived inactivity[3][4][5], which serves to down-clock the processor only in cases when overall system activity is low. Our methodology seeks a more refined clock management policy that can make use of this opportunity. The opportunity to decrease power consumption by down-clocking the processor as it waits for physically distant data is demonstrated in Figure 1, which shows the performance (Figure 1(a)), power consumption (Figure 1(b)), and power-delay product (Figure 1(c)) for a series of Stream-derived[6] stride 8 memory load tests being run at different working set sizes and clock frequencies on an Intel E5530. The results in Figure 1(a), which shows the measured memory bandwidth for this series of tests, suggest that performance is independent of processor clock frequency when the working set size is larger than 512KB. This size coincides with the size of the L2 cache, or equivalently, when the working set size is large enough that the data resides in a memory level farther than L2 cache. Figure 1(b) shows the average power consumption levels during these same memory load tests. It is important to note that power consumption is dependent on clock frequency even for working set sizes where performance is not. Taken together, we can view the results of Figure 1 as an opportunity to reduce power consumption while having minimal impact on performance. The
3
combined metric that covers performance and power consumption is power-delay product, which is simply the product of delay and normalized power usage of an application run at some frequency mode when compared to the baseline clock frequency management policy. Note that power-delay product is equivalent to energy usage normalized to the baseline clock frequency mode, so these terms can be used interchangeably. The power-delay product for the Stream tests is given in Figure 1(c), which shows that power-delay product can be significantly reduced for certain working set sizes by lowering the processor clock frequency.
bandwidth (MB/s)
working set size (2n B) 20,000
14
16
18
20
22
24
26
15,000 10,000 5,000 0
power (Watts)
(a) Performance, expressed as memory bandwidth (MB/s). 240 220 200 180
power-delay product
(b) Power consumption (Watts) of the entire system. 1.2 1 0.8 14
16
18
20
22
24
26
working set size (2n B) (c) Power-delay product compared to the maximum frequency, 2.4GHz. L1-L2 cache
1.60GHz
2.00GHz
2.40GHz
Fig. 1. Performance, power, and power-delay product of a stream-derived stride 8 load test done at a series of working set sizes and several clock frequencies on an Intel E5530.
Though useful as a proof of concept, it is rarely the case that application behavior is as simple as the tests shown in Figure 1. Unlike with the simple Stream benchmark, the processing unit usually has some amount of computation that
4
can be performed while it is stalled on memory accesses, leading to varying degrees of performance degradation when the processor is down-clocked. As such, it is necessary to understand the complex effects that memory, computational behavior and clock frequency have on performance, power and energy consumption. Our approach to gaining this understanding uses a benchmark to cover the space of some possible parameters (memory size, memory access pattern computation amount and type, ILP, clock frequency) to measure the effect that these factors have on the outputs (performance, power and energy). For applications, we can then measure the parameters over which we have little/no control (memory and computation related parameters) in order to make informed decisions about the parameter we can control (clock frequency) in order to choose from a benchmark-measured set of outcomes (combinations of performance, power and energy) for the application. This approach results in measured, system-wide energy reductions of up to 10.6%.
2
Methodology
2.1
Power Measurement and Frequency Control
To measure the power consumption of a system we employ a WattsUp? Pro power meter[7] to act as an intermediary between the power source and the systems power supply. We implemented a library on top of the device’s USB interface to provide some basic functionality for storing and processing the power measurements. This library is used to make loop level power measurements and is reported in the results of our system characterization benchmark that is discussed further in Section 2.2. For this work we implemented a binary instrumentation tool and library based on the PEBIL instrumentation toolkit[8] that automates the insertion of power measurement interface calls as well as clock throttling calls into an applications binary. The clock frequency change mechanism is built on top of the cpufreq-utils package1 [3] that is available with many popular Linux distributions. This instrumentation tool and library provide a powerful and low-overhead way to automatically provide a clock frequency management strategy to the application without requiring any build-time steps or special system support. The power measurement apparatus, at the time of this writing, costs less than $150. Since a data center the size of SDSC[9] has a 2 million dollar annual electricity bill, using this kind of tool within a large data center could save a lot of money without a lot of effort. 2.2
Benchmarking for Power and Performance
In an effort to better understand how a system behaves in the presence of certain types of computational and memory demands, we have developed a benchmarking framework called pcubed (PMaC’s Performance and Power benchmark) that 1
The cpufreq-utils frequency switching mechanism currently requires superuser privileges, but we plan to implement a userspace tool that supports our methodology.
5
allows us to generate a series of loops while retaining control over the working set size and memory address stream behavior, floating point operation counts, and data dependence features of each. The first two parameters relate to the behavior of the memory subsystem, while the latter two are related to how effectively the processor can hide memory access latency by performing other useful operations. The major component of each benchmark loop is a series of operations that is performed on an array of double-precision floating point values, which are stride-accessed and form a subset of the operands of a set of floating point operations. Running a set of tests encompassing wide ranges and combinations of these parameters at all available clock frequencies for a target system yields a set of results that describes how that system behaves with respect to performance and power consumption in the presence of a wide range of demands for its computational and memory resources at every processor clock frequency. These results can then be used as the foundation for forming hypotheses about how an application with a certain set of features in common with the benchmark instances will operate in terms of both performance and power usage on that system. 2.3
Application Characterization
In order to determine how an application’s characteristics relate to the individual tests in the system characterization gathered with pcubed, it is necessary to capture those relevant features in the application. The collected features are a set of observable characteristics that are related to the input parameters that can be supplied to pcubed. These observables are the level 1, 2 and 3 cache hit rates (derived from arrsize and stride), the ratio of the number of floating point operations to the number of memory operations (derived from f ltops and memops) and the average lookahead values for floating point and integer computation respectively (derived from parops and the loop structure created by the compiler), expressed as the average distance divided by the number of instructions in the loop. The feature characterization process is done at the loop level because loops are the control flow vehicle through which most computation is performed in High Performance Computing (it would also be possible to do this at the function level). Each loop and its inner loops are examined in order to quantify certain features about their memory behavior, floating point intensity and data dependency information. This analysis consists of a static analysis pass and a runtime trace of memory and control flow behavior that is performed by a binary instrumentation tool implemented with the PEBIL toolkit[8]. In order to make determinations about the expected behavior of an application loop, we first map it to one of the pcubed test loops that is collected as part of the system characterization. For this, we use the geometrically nearest loop in the 6-dimensional space whose members are the set of observable characteristics that are based on the pcubed input parameters, which includes the level 1, 2 and 3 cache hit rates, the ratio of the number of floating point operations to the number of memory operations and the average lookahead values for floating
6
point and integer computation respectively, expressed as the average distance divided by the number of instructions in the loop. As we will show later, the heuristic of using geometric distance between loop feature sets seems to work pretty well in practice, but understanding whether geometric distance is the best measure of similarity for two loops is an open research problem. Once the pcubed loop that is closest to the application loop is found, we use the performance and power results gathered from that pcubed loop in order to supply heuristics about how each clock frequency is likely to affect the application loop. pcubed can be run, analyzed, and the results put into a database automatically using some utility scripts that come with the source code package. Usually, the application can also be analyzed and its loops compared against the pcubed database with a single script command, the result of this command being a separate binary that permanently includes the desired DVFS strategy.
3
Experimental Results
In order to develop a DVFS strategy for an application whose purpose is to minimize energy usage, we use results gathered from the set of pcubed loops geometrically closest to the application loops by simply selecting the clock frequency for each pbench loop which minimized energy to be the frequency at which we will run the matching application loop. We imposed this scheme on a series of benchmark applications on two test systems. The first of these systems is an Intel Xeon E5530[10] workstation. The E5530 has 2 quad-core processors. Each core has its own 32KB L1 cache and 256KB L2 cache. Each of the quadcore processors has a shared 8MB L3 cache (for a total of 16MB of L3 for the 8 cores). Each of the 8 cores can be independently clocked at 1.60GHz, 1.73GHz, 1.86GHz, 2.00GHz, 2.13GHz, 2.26GHz, 2.39GHz or 2.40GHz. The second system is a Sun X4600[11] node that is a part of the Triton Resource[12] at the San Diego Supercomputer Center. This Sun X4600 node contains 8 quad-core AMD Opteron 8380[13] processors. Each core has its own 64KB L1 cache and 512KB L2 cache, and each processor shares 6MB of L3 cache (for a total of 48MB of L3 for the 32 cores). Each of the 32 cores can be independently clocked at 800MHz, 1.30GHz, 1.80GHz or 2.5GHz. Both of these systems were characterized for every frequency by running pcubed on a set of 2320 benchmark instances covering a wide range of loop characteristics for every clock frequency exposed by each system, which is 8 frequencies for the Intel Xeon E5530 and 4 frequencies for the AMD Opteron 8380. While the runtime of pcubed (which includes the time for each test autocalibrate itself to run for 5 seconds and for the application analysis tools to run on the test) depends on the actual set of tests and the clock frequencies involved, it generally requires approximately 6 hours per clock frequency. Running pcubed on a target system allows us to draw some conclusions about that system. For instance if it were found that the energy-optimal frequency for a large number of tests was at the lower end of the available frequencies, it would be possible to argue that lowering the range of available clock frequencies could
7
result in a more energy-efficient system. Similarly if most tests were found to be energy-optimal at the higher clock frequencies, this could indicate that raising the range of available frequencies might have an impact on a system’s energy efficiency. Neither of these were phenomena were found for either the Intel Xeon E5530 or the AMD Opteron 8380, but it remains to be seen whether such systems exist. By examining the pcubed results alone, we can also get an understanding of what feature thresholds delineate energy-optimal frequency domains for the target system. For example, Figures 2(a) and 2(b) show maps of which clock frequency is the most energy efficient for pcubed tests as a function of memory behavior and computational behavior respectively. The data in these maps meets our expectations in that the energy-optimal clock frequency generally declines as the amount of time spent stalled on memory increases or as the availability of computation to the processor decreases. Clock Frequency (GHz)
2.4 2.2 2
2 0 14
16
18
20
22
2 24
1.8 1.6
log2 (stride)
log2 (arrsize)
Clock Frequency (GHz)
(a) Energy-optimal clock frequency as a function of memory behavior. These tests have a fixed amount of computational work with memops = 1, f ltops = 2 and parops=1. 2.4 2.2 2 2 0 4
2
2 0
log2 (f ltops/memops)
−2
−4 4
1.8 1.6
log2 (parops)
(b) Energy-optimal clock frequency as a function of the availability of computation. These tests have a fixed arrsize = 16MB and stride = 1. Fig. 2. pcubed-measured energy-optimal clock frequencies on an Intel Xeon E5530.
3.1
Energy-Optimal Clock Frequency Selection
For each benchmark, we then make an instrumentation pass over the executable, run the instrumented executable, then run a post-processing script on the results
8
of the application analysis. The overhead of the runtime application analysis depends on the application and its behavior, but for all of the benchmarks studies in this work the maximum overhead was a 13x slowdown (with an average slowdown of 4.0x) on application runtime, but this step only needs to be run once per application. This post-processing script combines the static and dynamic application analysis, locates the most closely matching pcubed benchmark loop, uses the results from that pcubed loop to make a determination about which clock frequency will result in energy-minimal execution for the application’s loop, then makes a second instrumentation pass on the executable to embed the DFS strategy into the binary. For the purpose of this study, this DFS-embedded executable as well as a second instrumented executable that contains no DFS-related instrumentation are produced with timer and power measurement library calls inserted into application startup and shutdown so that energy measurements can be made. The set of applications used for the Intel Xeon E5530 is the NAS Parallel benchmarks[14], compiled with both the pgi and gnu compiler, as well as GUPS[15], SSCA#2[16], S3D[17] and HYCOM[18] compiled with the pgi compiler. The power-delay product for each of these benchmarks run with our DFS scheme is computed against a benchmark run without our scheme, which is to say that it is computed against the default or peak clock rate of the system. Figure 3(a) shows these power-delay products, which can also be stated as the amount of energy used in comparison to the default frequency management policy. The average amount of energy saved for this set of benchmarks is 2.6%, but is as high as 7.6% for CG compiled with the gnu compiler. The set of applications used on the AMD Opteron 8380 is the NAS Parallel benchmarks, GUPS, SSCA#2 and HYCOM, all compiled with the pgi compiler. Shown in Figure 3(b), the average energy saved on the Opteron is 2.1% with a maximum savings of 10.6% on CG. In addition to power-delay product, Figure 3 also shows the raw delay to give an account of the slowdown incurred by the tests shown there. The delay is non-trivial and averages 3.8% for both the Intel Xeon E5530 and the AMD Opteron 8380. This demonstrates the concept that if performance is of enough importance, it is unwise to optimize purely in terms of energy. Rather, in that case it would be prudent to use an objective function that puts more emphasis on performance such as energy-delay product. With modifications to the few (less than 10) lines of source code that currently evaluate the pcubed tests based on power-delay, one could easily for evaluations based on energy-delay or any other function of performance and power. It would be time consuming to run every loop of an application at every clock frequency to determine which of those clock frequencies resulted in energyoptimal execution. A simple approach that used this strategy would require a number of runs that is on the order of the product of the number of loops and the number of available clock frequencies. Alternatively, our approach uses a set of benchmark runs (requiring around 6 hours per clock frequency but which only have to be run once in the lifetime of a system) in addition to a single instrumented application run in order to gather a heuristic to this effect. But
9
(a) 8-core Intel Xeon E5530.
(b) 32-core AMD Opteron 8380. Fig. 3. Application energy usage (power-delay) and slowdown (delay) when run with a DFS management scheme, normalized to the default frequency management scheme.
how good is this heuristic? In order to begin to answer this we exhaustively verified that the selected clock frequency on the Intel Xeon E5530 were energyoptimal for a pair of benchmarks codes that have the property that their runtime is dominated by a single loop. For CG, the loop that is responsible for 95% of the dynamic instruction count was found to be geometrically closest, using the metrics described in Section 2.3, to the pbench loop that has arrsize = 1MB, stride = 1, f ltops = 8, memops = 16 and parops = 1 (meaning each floating point operation is dependent on the result of its predecessor), which was found to be energy-optimal when run at a clock frequency of 2.13GHz. By subjecting the dominant loop in CG to each available clock frequency and measuring the energy required to complete each run we found that 2.13GHz is also the energy-optimal fixed frequency for the dominant loop. A similar methodology was applied to the dominant loop in GUPS, which was found to be energy optimal at 1.60GHz. The pcubed instance found to be geometrically closest to the dominant GUPS loop has arrsize = 16MB, stride = 8, f ltops = 4, memops = 64 and parops = 4 (in this case
10
meaning that the floating point operations carry only an inter-iteration dependence onto themselves). This loop was also found to run energy-optimally at 1.60GHz. This does not serve as conclusive proof that the frequencies selected by our methodology are energy-optimal in all cases nor does it indicate that every interesting aspect of program behavior is encapsulated by the space of possible loops that can be generated by pbench. It does, however, serve to provide some validation in a scenario where fully validating the frequency quality selection would be extremely time consuming.
4
Related Work
Dynamic voltage frequency scaling is a well known technique that has been used to reduce power and energy usage in the context of various application domains [19][20][21][22][23]. The DVFS research in High Performance Computing tends to follow one of two approaches. The first approach is to identify and exploit MPI inter-task load imbalance. The work done in [24] and [25] focuses on locating these imbalances and applying reduced frequencies to computation regions that are not on the application’s criritcal path. By reducing the energy used on a non-critical path, overall energy can be reduced since power consumption is decreased with negligible performance loss. Since these approaches seek to exploit inter-task imbalance for energy gains instead of intra-task imbalance, they are complementary to ours. The second approach, which our work falls into, seeks to find a way to exploit performance-clock independence that occurs within a task as a result of memory access stalls. Ge et. al. show in [26] that it is possible to reduce energy or energydelay by running some memory-bound applications either at a fixed frequency for the entire run or by hand-selecting the dynamic frequency settings for the application. Our technique goes further and demonstrates how to automatically select and use a set of such frequency settings. In [27], the application is run to collect profiling information, then is divided by hand into phases that consist of regions that are either of like memory behavior or are split by MPI calls. The application is then augmented to give it the capability to perform frequency scaling at its phase boundaries, and then sets of phase/frequency combinations are run in order to determine how particular frequency selections affect power and performance. This work differs from ours in two major ways. First, their methodology differs from ours in terms of the how the application is broken down for analysis. Our methodology currently looks at loop boundaries as the only possible scaling locations; theirs incorporates other possibile frequency scaling points. Loop boundaries are natural points of breakdown for HPC applications and are responsible for a large part of the total workload of an application, but there are other useful points that could be used (e.g. function boundaries) that we would like to incorporate into our work. The other major difference between their methodology and ours is that they search for the best frequency for the phases in the application by running it with different frequency scaling strategies, while our approach attempts to detail the
11
capabilities of the system in terms of performance and power then determines the frequency for the application’s loops analytically.
5
Conclusions
This work has shown a benchmark-based approach to selecting processor clock frequency in a way that takes advantage of unnecessarily high clock rates that are maintained during memory-bound computations. This methodology is implemented on top of open source software and uses a system-specific performance and power characterization that is automatically derived from the results of a set of benchmark loops, generated by the pcubed benchmarking framework, that are run at each clock frequency on the system. A set of tools that is capable of capturing static and runtime information on an application executable is then used to analyze an application’s loops in order to find the benchmark loops whose features match them most closely. From this matching, we are able to select a dynamic frequency scaling strategy for the application that should result in minimizing energy usage during application execution. pcubed was run, and DVFS strategies were employed on a series of benchmarks on both an Intel Xeon E5530 and an AMD Opteron 8380, where we realized energy savings of up to 7.6% and 10.6% respectively. Acknowlegdements This work was funded in part by the Department of Defense and used elements at the Extreme Scale Computing Center, located at Oak Ridge National Laboratory and funded by the Department of Defense. This work also used resources from the Triton Resource at the San Diego Supercomputer Center. Special thanks to Phil Papadopoulos, Jim Hayes and Jeffrey Filliez at SDSC for their help related to gathering measurements on the Triton Resource.
References 1. G.E. Moore et al. Cramming More Components onto Integrated Circuits. Proceedings of the IEEE, 86(1):82–85, 1998. 2. V. Pallipadi. Enhanced Intel SpeedStep Technology and Demand-Based Switching on Linux. http://software.intel.com/en-us/articles/enhanced-intel-speedsteprtechnology-and-demand-based-switching-on-linux/. 3. CPU Frequency Scaling. https://wiki.archlinux.org/index.php/Cpufrequtils. 4. CPUSpeed. http://www.carlthompson.net/Software/CPUSpeed. 5. AMD PowerNOW. Technology, AMD white paper, November 2000. 6. J.D. McCalpin. STREAM: Sustainable Memory Bandwidth in High Performance Computers, 2000. 7. WattsUp? Meters. https://www.wattsupmeters.com/secure/products.php?pn=0. 8. M.A. Laurenzano et al. PEBIL: Efficient Static Binary Instrumentation for Linux. In Performance Analysis of Systems and Software (ISPASS), IEEE International Symposium on, pages 175–183. IEEE, 2010.
12 9. SDSC San Diego Supercomputer Center. http://www.sdsc.edu/. 10. Intel Xeon Processor E5530. http://ark.intel.com/Product.aspx?id=37103 &processor=E5530&spec-codes=SLBF7. 11. Sun Fire X4600 M2 Server Architecture. http://www.sun.com/servers/x64/ x4600/arch-wp.pdf. 12. Triton Resource: Petascale Data Analysis Facility. http://tritonresource.sdsc.edu/pdaf.php. 13. C.N. Keltcher et al. The AMD Opteron Processor for Multiprocessor Servers. IEEE Micro, 23(2):66–76, 2003. 14. D.H. Bailey et al. The NAS Parallel Benchmarks. International Journal of High Performance Computing Applications, 5(3):63, 1991. 15. P. Luszczek et al. Introduction to the HPC Challenge Benchmark Suite. Proceedings of the International Conference on Supercomputing, Seattle, WA, 2005. 16. D.A. Bader et al. Designing Scalable Synthetic Compact Applications for Benchmarking High Productivity Computing Systems. Cyberinfrastructure Technology Watch, 2:1–10, 2006. 17. E.R. Hawkes et al. Direct Numerical Simulation of Turbulent Combustion: Fundamental Insights Towards Predictive Models. In Journal of Physics: Conference Series, volume 16, page 65. IOP Publishing, 2005. 18. G.R. Halliwell. Evaluation of Vertical Coordinate and Vertical Mixing Algorithms in the HYbrid-Coordinate Ocean Model (HYCOM). Ocean Modelling, 7(3-4):285– 322, 2004. 19. C. Poellabauer et al. Feedback-based Dynamic Voltage and Frequency Scaling for Memory-bound Real-time Applications. 2005. 20. K. Choi et al. Dynamic Voltage and Frequency Scaling Based on Workload Decomposition. In Proceedings of the 2004 international symposium on Low power electronics and design, pages 174–179. ACM, 2004. 21. K. Rajamani et al. Application-aware Power Management. In Workload Characterization, 2006 IEEE International Symposium on, pages 39–48. IEEE, 2007. 22. C. Isci et al. An Analysis of Efficient Multi-core Global Power Management Policies: Maximizing Performance for a Given Power Budget. In Microarchitecture, 2006. MICRO-39. 39th Annual IEEE/ACM International Symposium on, pages 347–358. IEEE, 2006. 23. J.R. Lorch and A.J. Smith. Operating System Modifications for Task-Based Speed and Voltage. In Proceedings of the 1st international conference on Mobile systems, applications and services, pages 215–229. ACM, 2003. 24. V.W. Freeh et al. Just-in-time Dynamic Voltage Scaling: Exploiting Inter-node Slack to Save Energy in MPI Programs. Journal of Parallel and Distributed Computing, 68(9):1175–1185, 2008. 25. H. Kimura et al. Emprical Study on Reducing Energy of Parallel Programs using Slack Reclamation by DVFS in a Power-scalable High Performance Cluster. In Cluster Computing, 2006 IEEE International Conference on, pages 1–10. IEEE, 2007. 26. R. Ge et al. Improvement of Power-performance Efficiency for High-end Computing. In Parallel and Distributed Processing Symposium, 2005. Proceedings. 19th IEEE International, page 8. IEEE, 2005. 27. V.W. Freeh and D.K. Lowenthal. Using Multiple Energy Gears in MPI programs on a Power-scalable Cluster. In Proceedings of the tenth ACM SIGPLAN symposium on Principles and practice of parallel programming, pages 164–173. ACM, 2005.