Journal of Wildlife Diseases, 35(2), 1999, pp. 212–238 q Wildlife Disease Association 1999
REFERENCE INTERVALS AND PHYSIOLOGIC ALTERATIONS IN HEMATOLOGIC AND BIOCHEMICAL VALUES OF FREE-RANGING DESERT TORTOISES IN THE MOJAVE DESERT Mary M. Christopher,1,7 Kristin H. Berry,2 I. R. Wallis,3,4 K. A. Nagy,3 B. T. Henen,3,5 and C. C. Peterson3,6 1 Department of Pathology, Microbiology & Immunology, School of Veterinary Medicine, University of California-Davis, Davis, California 95616, USA 2 U.S. Geological Survey, Riverside, California 92507, USA 3 Department of Biology and Laboratory of Biomedical and Environmental Sciences, University of California-Los Angeles, Los Angeles, California 90024, USA 4 Present address: Division of Botany and Zoology, Australian National University, Canberra ACT 0200, Australia 5 Present address: Smithsonian Institution, National Zoological Park, Department of Zoological Research, 3001 Connecticut Ave., Washington, D.C. 20008, USA 6 Present address: Department of Zoology, Oklahoma State University, Stillwater, Oklahoma 74078, USA 7 Corresponding author (e-mail:
[email protected])
ABSTRACT:
Desert tortoise (Gopherus agassizii) populations have experienced precipitous declines resulting from the cumulative impact of habitat loss, and human and disease-related mortality. Evaluation of hematologic and biochemical responses of desert tortoises to physiologic and environmental factors can facilitate the assessment of stress and disease in tortoises and contribute to management decisions and population recovery. The goal of this study was to obtain and analyze clinical laboratory data from free-ranging desert tortoises at three sites in the Mojave Desert (California, USA) between October 1990 and October 1995, to establish reference intervals, and to develop guidelines for the interpretation of laboratory data under a variety of environmental and physiologic conditions. Body weight, carapace length, and venous blood samples for a complete blood count and clinical chemistry profile were obtained from 98 clinically healthy adult desert tortoises of both sexes at the Desert Tortoise Research Natural area (western Mojave), Goffs (eastern Mojave) and Ivanpah Valley (northeastern Mojave). Samples were obtained four times per year, in winter (February/March), spring (May/June), summer (July/August), and fall (October). Years of near-, above- and below-average rainfall were represented in the 5 yr period. Minimum, maximum and median values, and central 95 percentiles were used as reference intervals and measures of central tendency for tortoises at each site and/or season. Data were analyzed using repeated measures analysis of variance for significant (P , 0.01) variation on the basis of sex, site, season, and interactions between these variables. Significant sex differences were observed for packed cell volume, hemoglobin concentration, aspartate transaminase activity, and cholesterol, triglyceride, calcium, and phosphorus concentrations. Marked seasonal variation was observed in most parameters in conjunction with reproductive cycle, hibernation, or seasonal rainfall. Year-to-year differences and long-term alterations primarily reflected winter rainfall amounts. Site differences were minimal, and largely reflected geographic differences in precipitation patterns, such that results from these studies can be applied to other tortoise populations in environments with known rainfall and forage availability patterns. Key Words: Clinical chemistry, desert tortoise, Gopherus agassizii, hematology, hibernation, physiology, reference range, reference values. INTRODUCTION
Desert tortoises (Gopherus agassizii) have lived for thousands of years in habitats characterized by prolonged drought, wide temperature fluctuations, and periodic shortages of food and water. Their survival can be attributed to remarkable adaptive capabilities and unique physiologic mechanisms for the conservation of water, storage and excretion of nitrogenous
wastes, and protection against high salt loads (Dantzler and Schmidt-Nielsen, 1966; Minnich, 1977; Nagy and Medica, 1986; Peterson, 1996a). Over the past 25 yr, dramatic declines have been observed in some desert tortoise populations in the Mojave and Colorado deserts of the southwest United States (Fish and Wildlife Service, 1994; Berry, 1997). These declines have been attributed to the cumulative impacts of human intervention, predation, 212
CHRISTOPHER ET AL.—HEMATOLOGIC AND BIOCHEMICAL VALUES OF FREE-RANGING DESERT TORTOISES
habitat loss and degradation, and disease (Fish and Wildlife Service, 1994). In April 1990, desert tortoise populations in areas north and west of the Colorado River were listed as threatened by the U.S. Fish and Wildlife Service (Fish and Wildlife Service, 1994). At about the same time, the Bureau of Land Management (U.S. Department of the Interior, Washington, DC) initiated several research projects in response to developing disease problems in desert tortoise populations, including mycoplasmosis (upper respiratory tract disease; Jacobson et al., 1991) and shell disease (Jacobson et al., 1994). The purpose of this study was to gather, analyze, and critically interpret accurate baseline clinical laboratory data from three populations of free-ranging adult desert tortoises over a 5 yr period, so that one or more sets of reference intervals and interpretive guidelines could be developed for clinically healthy desert tortoises of both sexes from different geographic sites under a variety of environmental and physiologic conditions. This ‘‘health profile program’’ was part of a larger study addressing water and energy balance and reproduction (Peterson, 1996a, b; Henen, 1994, 1997), field evaluation protocols, and the seroepidemiology and clinicopathologic manifestations of mycoplasmosis (Brown, et al., 1994, 1998) and shell disease (Jacobson et al., 1994). Analysis of blood constituents is a useful, widely-used tool that aids in the diagnosis and monitoring of animal health and disease, and the differentiation of physiologic from pathologic processes (Jacobson, 1987; Bennett et al., 1991; Mautino and Page, 1993). Hematologic and biochemical analyses have been described to a limited extent for captive desert tortoises (Rosskopf, 1982) and free-ranging tortoises in the western Mojave Desert (Jacobson et al., 1991; Christopher et al., 1997), northeastern Mojave Desert (Dickinson et al., 1995; Christopher et al., 1994) and Sonoran Desert (Dickinson et al., 1996). In some cases, abnormal laboratory
213
results have helped to identify stressed or ill tortoises (Jacobson et al., 1991, 1994; O’Connor et al., 1994; Peterson, 1994; Christopher et al., 1997). The longitudinal design of the present study facilitated a comprehensive interpretation of well-defined sets of laboratory data obtained over a number of years and at sites and seasons representative of the ecological diversity of the Mojave Desert. Because desert tortoises may live .50 yr in the wild (Germano, 1992), a long-term study provides a more accurate view of changes that may occur only periodically, that vary with annual precipitation, or which take place gradually over several years. The results of this study add new information to our knowledge of desert tortoise physiology and provide an important database for veterinarians, scientists, and biologists assessing tortoise medicine, ecology, and survival. MATERIALS AND METHODS Sites and precipitation
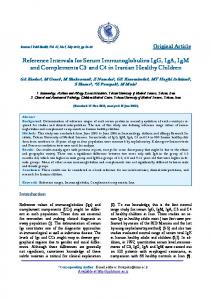
Samples were obtained from tortoises at three sites in the Mojave Desert (California, USA): the Desert Tortoise Research Natural Area (DTNA) in the western Mojave Desert (358109N, 1188109W; elevation 869–945 m); Goffs/Fenner Valley (referred to hereafter as Goffs) in the eastern Mojave Desert, at the boundary with the northern Colorado Desert (348529N, 1158109E; elevation ;700 m); and Ivanpah Valley (referred to hereafter as Ivanpah), in the western corner of the northeastern Mojave Desert (358399N, 1158159W; elevation 866–914 m) (Fig. 1). Precipitation data from 1989 (the year prior to the study) through 1995 were averaged from weather stations at Mojave and Randsburg (California) to quantify rainfall at the DTNA; from stations at Mitchell Caverns and Needles (California) to quantify rainfall at Goffs; and from stations at Searchlight (Nevada, USA) and Mountain Pass (California) to quantify rainfall at Ivanpah (NOAA, 1988–1995). Because of the seasonal precipitation pattern of the Mojave Desert, precipitation by convention is recorded by hydrologic year (1 October through 30 September), with subdivision into winter precipitation (1 October through 31 March) and summer precipitation (1 July through 30 September). Long-term precipitation means (1961–1996) obtained from the same weather
214
JOURNAL OF WILDLIFE DISEASES, VOL. 35, NO. 2, APRIL 1999
FIGURE 1. Map of the Mojave and Colorado deserts of California (USA) indicating the location of the three study sites (squares) at which desert tortoises were sampled. The solid, thick lines indicate the approximate boundaries of recovery units, which specify desert tortoise populations with differences in genetics, morphology, ecology, and behavior for the purposes of the Endangered Species Act (Fish and Wildlife Service, 1994).
stations were used to quantify general climatic patterns for each site and compare measured data to site means. Rain gauges on study sites provided ancillary precipitation data. Animals, sample periods and physical findings
Ten adult males and 10 adult females at each site were captured and fitted with radio transmitters (Model SB-2, AVM Instrument Co., Livermore, California) with 48-cm copper antennae, powered by lithium C-cells (Tadiran Company, Israel) in 1989. Tortoises were identified by a combination of letters (site and sex) and numbers, e.g., D11F was No. 11 (female) from the DTNA site. Tortoises that died or disappeared were replaced, when possible, with new tortoises of the same sex, and given sequential, new numbers. Samples were collected from tortoises at all sites four times per year: (1) winter, at or just prior to emergence from hibernation (17 February–20 March); (2) spring, generally the peak of resource quality and availability, and tortoise above-ground activity (5 May–5 June); (3) summer, a hot, dry period when succulent green food and water were generally unavailable (27
July–29 August); and (4) fall, a cool, dry period with decreased tortoise activity and preparation for hibernation (7–31 October). The dates are the range of actual sampling dates within each season. Sample times were chosen to reflect the expected annual extreme variations in tortoise body condition. Sample collections from some tortoises began as early as March 1989 as a trial period for optimizing sampling protocols, test methodology and test selection, and in conjunction with concurrent studies on water balance and energy flow (Christopher et al., 1992; Peterson, 1996a, b; Henen, 1997). Only specimens obtained between October 1990 and October 1995 inclusive are reported here. Annual data were organized by hydrologic year, e.g., 1990–91 included data from fall 1990, winter 1991, spring 1991, and summer 1991. Body weight (g; using a top-loading balance, Ohaus Scale Corp., Florham Park, New Jersey, USA) and carapace length at the midline (MCL, mm; using an alcohol-sterilized Archaeologist’s Caliper, C-12, Forestry Suppliers, Inc., Jackson, Mississippi, USA) were measured each time a tortoise was sampled. In addition, tortoises were given a complete physical examination. Field methodology for evaluating physical and environmental data will be described elsewhere (K. H. Berry and M. M. Christopher, unpubl. data). Samples from tortoises with clinical signs of debilitation or upper respiratory disease were not included in our analyses. Some tortoises had minor clinical signs at occasional sampling periods, from which data were not utilized. Beginning in winter 1992, all tortoises also were tested for exposure to Mycoplasma agassizii using an ELISA test developed and performed at the University of Florida (Gainesville, Florida, USA), as detailed by Schumacher et al., 1993. In addition, nasal flushes were cultured for M. agassizii using standard techniques (Brown et al., 1994). Results from tortoises that were culture positive or seropositive for M. agassizii were excluded from the analyses herein. Results from tortoises with clinical and/or serologic evidence of disease will be reported separately (Brown et al., 1998; M. M. Christopher et al., unpubl. data). Blood samples and sample analysis
Sterile technique was used to obtain specimens. Disposable gloves were worn and discarded after each tortoise was processed and new needles were used for all venipunctures. Blood (4.0 to 4.7 ml) was taken from the jugular vein using a plastic syringe fitted with a winged infusion kit (Becton Dickinson, Franklin Lakes, New Jersey; Jacobson et al., 1992).
CHRISTOPHER ET AL.—HEMATOLOGIC AND BIOCHEMICAL VALUES OF FREE-RANGING DESERT TORTOISES
A 0.6 ml aliquot of blood was placed in a Microtainery tube containing lithium heparin gel (Becton Dickinson) for whole blood analysis. The remaining blood (about 3.6 ml) was placed in a Vacutainery tube containing lithium heparin (Becton Dickinson) for separation of plasma. Both tubes were mixed for 2 min and the Microtainery tube was placed on wet ice. An air-dried blood smear was made with a drop of blood from the larger tube and fixed in methanol for 10 sec. Two microhematocrit tubes containing ammonium-heparin (Fisher Scientific, Pittsburgh, Pennsylvania, USA) were filled with blood and centrifuged for 2 min in a microhematocrit centrifuge (International Equipment Co., Boston, Massachussetts, USA) for determination of packed cell volume (PCVfield). The remaining blood in the Vacutainery tube was centrifuged for 5 min at low-speed (500–10003 g) to separate plasma. Plasma (1.0 ml aliquots) was transferred to plastic tubes and frozen in liquid nitrogen. Whole blood samples were kept on ice and transported to a veterinary diagnostic laboratory (APL Laboratories, Las Vegas, Nevada) within 24 hr for analysis. Plasma samples were stored in liquid nitrogen for #10 days before analysis. Hematologic analyses or complete blood count (CBC) included packed cell volume (PCV-lab; microhematocrit centrifugation, International Equipment Co.), red blood cell (RBC) count (hemacytometer, Fisher Scientific), total white blood cell (WBC) count (hemacytometer using Nate and Herrick’s solution), and hemoglobin (Hb; cyanmethemoglobin method preceded by centrifugation of lysate), and were done using the methodology of Campbell (1988). Mean cell volume (MCV), mean cell hemoglobin (MCH), and mean cell hemoglobin concentration (MCHC) were calculated using RBC, PCV, and Hb values by the method in Duncan et al. (1994). Microscopic examination of blood smears stained with modified Wright’s stain included a 100-cell differential WBC count (heterophils, lymphocytes, basophils, eosinophils, monocytes and azurophils), and qualitative evaluation of thrombocyte number, WBC and RBC morphology, and hemoparasites (Alleman et al., 1992). Between October 1990 and May 1993 (July 1993 for Goffs samples), all plasma biochemical analyses were done using an Olympus AU5000 automated chemistry analyzer (Olympus, Inc., Chicago, Illinois, USA). Plasma obtained during and after July 1993 (October 1993 for Goffs samples) was analyzed using a Hitachi 747-200 automated chemistry analyzer (BoehringerMannheim Corp., Indianapolis, Indiana, USA). The tests included in the clinical chemistry profile included glucose (hexokinase method),
215
blood urea nitrogen (BUN; urease method), creatinine (modified Jaffe method; begun in May 1993), uric acid (uricase method), total protein, albumin, calcium, phosphorus, total bilirubin, direct bilirubin, alkaline phosphatase (ALP), aspartate aminotransferase (AST), alanine aminotransferase (ALT), triglycerides (enzymatic method; begun in May 1993) and total cholesterol. Iron (ferrene method), magnesium (begun in May 1994), and sodium, potassium, chloride and total carbon dioxide (TCO2) (indirect ion-selective potentiometry) also were determined on the automated analyzer. Bile acids were measured spectophotometrically using an enzymatic method (begun in May 1993). Globulins, albumin/globulin (A/G) ratio, anion gap, osmolality, sodium/potassium (Na/K) ratio, and indirect bilirubin were calculated automatically by the analyzers. Statistical analysis
All data were hand-entered into a computerized database (StatViewy, Abacus Concepts, Inc., Berkeley, California) and inspected visually for accuracy. Missing values, missing data sets and extreme values were confirmed or corrected based on original laboratory reports. Data were deleted only for clear cases of technical problems (based on laboratory or field reports and data inspection) associated with sample clotting, insufficient sample volume, or instrument error attributable to these artifacts. Data for each analyte for each sex, site and season, and pooled values from all tortoises were examined visually using scatterplots, percentile graphs and histograms for distribution and outliers. Outliers were deleted only if the difference between the outlying value and the next lowest (or highest) value exceeded onethird of the total range of values (Burtis and Ashwood, 1994). This method for detection of outliers is robust, yet not sensitive to Gaussian distribution. Remaining extreme values were deleted only when supported by evidence for technical error or other laboratory evidence of disease. Mean, median, kurtosis, and skewness values were evaluated to ascertain normality (Abacus Concepts, Inc.). Most data sets were normally distributed, with the exception of BUN, ALT, AST, bile acids, WBC, differential WBC counts, and total and direct bilirubin, which were log-transformed prior to statistical analysis. Reference intervals were defined by minimum and maximum values for sex/site/season groups with ,40 samples, and by central 95 percentiles with .40 samples (Lumsden, 1978). Median values were used as a measure of central tendency (for normally distributed
216
JOURNAL OF WILDLIFE DISEASES, VOL. 35, NO. 2, APRIL 1999
TABLE 1. Annual, winter and summer precipitationa (mm) at three sites in the Mojave Desert (California, USA) for the 5 yr study period (1990–95) and the preceding year (1989–90). Data were obtained from the National Oceanic and Atmospheric Administration.
Site
DTNAb
GOFFSc
IVANPAHd
Season
1994–95
312f 268f 49f
156 127 17
89e 74e 7e
271f 235f 19e
192 111 63
105e,h 73e,h 24e
285f 227 68
196 104 71
1990–91
1991–92
1992–93
352f
72e
259f
342f
66e
7e
162 156f 1e
275f 0e
0e
Annual Winter Summer
175e
220f
347f
311f
39e 91f
152f 62
316f 15e
277f 23e
Annual Winter Summer
223f 59e 110f
197 114 75
333f 249f 72
313f 265f 32e
Annual Winter Summer
1989–90
Long-Term Average (1961–96)
42e 29e
1993–94
0e,g
a
Because of the seasonal precipitation pattern in the Mojave Desert, annual precipitation by convention is recorded by hydrologic year (1 October through 30 September), with subdivision into winter (1 October through 31 March) and summer (1 July through 30 September) precipitation. b Average precipitation from weather stations at Mojave and Randsburg (California). c Average precipitation from weather stations at Mitchell Caverns and Needles (California). d Average precipitation from weather stations at Searchlight (Nevada) and Mountain Pass (California). e Rainfall below long-term average. f Rainfall above long-term average. g Trace (less than 1 mm). h Some data missing.
data this was essentially identical to the mean) (Martin et al., 1975; Lumsden, 1978; Burtis and Ashwood, 1994). For results that were not significantly different between sexes or sites, median values and mid-95% limits were determined using pooled values from all tortoises for each season. Mean values for each season were calculated for tortoises with at least one set of data from each of the four seasons over the 5 yr period. Repeated measures analysis of variance (Abacus Concepts, Inc.) was used to test for significant differences due to the effect of sex, site, season and the interactions of sex, site and season. Analysis of variance also was used to determine year-to-year differences. Scheffe’s F test was used for post-hoc group comparisons to identify specific differences between means. This test is robust to violations of the assumptions typically associated with multiple comparison procedures and was appropriate for the large number of tests analyzed, unequal cell numbers and heterogeneous variances. Because of the large number of analyses, P , 0.01 was used to define significant differences. Relationships between some analytes were analyzed by least squares linear regression and analysis of covariance (Abacus Concepts, Inc.).
RESULTS Rainfall
Typical of the Mojave environment, most rain fell during winter (October through March; Table 1). Annual, winter, and summer rainfall were below-average in 1993–94 by 46–54%, 30–48% and 66– 100% respectively, at all sites. Annual and winter precipitation were about 25% of average at DTNA in 1989–90. Summer rainfall was below-average at Goffs and DTNA most years, but about three times average at DTNA in 1994–95. Annual precipitation was above-average by 41–126% (73 6 27%), and winter precipitation was aboveaverage by 103–185% (138 6 29%) in 1991–92, 1992–93, and 1994–95 at all sites. General sampling results
Of the 1,071 blood samples obtained, 111 were seropositive for M. agassizii; 36 were from tortoises with positive nasal cultures for M. agassizii; 216 were from tor-
CHRISTOPHER ET AL.—HEMATOLOGIC AND BIOCHEMICAL VALUES OF FREE-RANGING DESERT TORTOISES
toises with clinical signs of illness; and 10 samples were from tortoises with more than one abnormality. Exclusion of these 353 samples left 719 blood samples from 98 (47 male, 51 female) clinically healthy, culture-negative, seronegative tortoises. These comprised 161 samples from 31 tortoises (17 males, 14 females) at DTNA; 286 samples from 36 tortoises (14 males, 22 females) at Goffs; and 272 samples from 31 tortoises (16 males, 15 females) at Ivanpah. Fifty-five of the 98 tortoises were sampled 1 to 6 times, 19 tortoises were sampled 7 to 12 times, 23 tortoises were sampled 13 to 18 times, and one tortoise was sampled at each of the 21 sampling periods during the 5 yr study. Of the 719 samples, 17 chemistry profiles and 41 CBCs were missing or deleted for technical reasons (e.g., clots, insufficient sample volume, hemolysis), while 23 samples yielded only partial CBC results (PCV and Hb). A substantial alteration in iron and creatinine values coincided with implementation of the new chemistry analyzer in July 1993 (October 1993 for Goffs), so that data for iron and creatinine obtained prior to those dates were excluded. Seventy of the tortoises had at least one set of data from each of the four seasons (winter, spring, summer, fall) for inclusion in repeated measures analysis of variance. Body weight and MCL
Body weight and MCL were significantly greater (P , 0.0001) in males than females at all sites all year, with a mean difference of 1261 g for body weight and 41 mm for MCL (Table 2; Fig. 2). Male tortoises at DTNA were smaller (by an average of 474 g, 18 mm) than males at other sites, and female tortoises at Goffs were smaller than other females (by an average of 227 g, 11 mm) but the differences were not significant. Body weight increased in all tortoises between emergence from hibernation (winter) and spring. Spring weight gain was significantly higher in 1992–93 compared with other years. Mean
217
body weight decreased significantly between fall and winter 1993–94. Body weight (body mass) and MCL fitted a second-order polynomial regression curve (r 5 0.946; P , 0.0001), described by the allometric equation logMCL 5 1.276 1 0.325 log(mass), which was rearranged algebraically to log(mass) 5 3.077 (log MCL) 2 3.926, and detransformed to mass 5 0.00012 MCL3.08. The slope of the regression curve did not differ significantly between sites, seasons, or years, but did differ between males and females (P , 0.01). There was more variation in the relationship between body weight and MCL in females (r 5 0.819) compared with males (r 5 0.939). Hematology
Packed cell volumes determined in the laboratory (mean 6 SE 5 24.6 6 5.1%) were more variable and lower than those determined in the field (26.4 6 4.9%; P , 0.0001). Males had significantly higher RBC mass (PCV, RBC, and Hb concentration) than female tortoises all year (Table 3; Fig. 3). Packed cell volume, Hb, and RBC changed in concert, and were significantly higher in summer, although this varied somewhat with sex and site (Table 4). Female tortoises had more pronounced seasonal alterations in RBC mass than males, with a decline during hibernation and higher values in spring and summer (Fig. 3). Both male and female tortoises had lower PCV and Hb concentration in 1990–91; whereas, highest values occurred in years with above-average rainfall (Table 5). A low number of tortoises had mild polychromasia. Intracellular RBC parasites were not observed in any tortoises. Thrombocytes were clumped or considered adequate in all specimens. Total WBC and heterophil numbers paralleled one another closely and did not differ significantly on the basis of sex, site, or season (Fig. 4). Lymphocyte and basophil numbers were significantly lower during hibernation, whereas monocyte and azurophil numbers were highest at this
b
a
Body Weight (g) MCL (mm) Body Weight (g) MCL (mm)
Body Weight (g) MCL (mm) Body Weight (g) MCL (mm)
Body Weight (g) MCL (mm) Body Weight (g) MCL (mm)
1,835–4,535 230–297 1,510–2,875 202–248
1,945–4,180 240–301 1,234–2,580 183–235
1,260–3,965 188–280 1,515–2,762 211–250
3,090 265 2,137 232
3,148 257 1,645 209
3,075 268 2,105 226
Median
27 27 28 28
33 33 31 31
16 16 17 17
nb
2,060–4,920 229–296 1,400–3,225 189–247
2,380–5,100 240–301 1,470–2,880 181–238
1,425–4,919 190–296 1,830–2,905 211–240
Range
3,720 266 2,210 227
3,515 257 1,920 207
3,659 268 2,185 222
Median
SPRINGa
32 32 39 39
39 39 33 33
19 19 29 29
n
1,740–4,516 231–297 1,463–2,620 191–247
2,201–4,505 240–302 1,215–2,500 190–241
3,187 264 1,805 225
3,152 257 1,642 208
3,421 268 1,965 224
Median
SUMMER
1,240–3,990 188–278 1,510–2,610 211–239
Range
40 40 28 28
34 34 28 28
19 19 22 22
n
1,885–4,470 230–301 1,445–2,885 202–249
1,930–4,625 236–300 1,040–2,610 181–242
3,070 265 2,013 226
2,995 257 1,675 208
2,655 249 1,973 226
Median
FALL
1,230–3,925 187–279 1,330–2,540 213–249
Range
41 41 37 37
45 45 43 43
23 23 26 26
n
Body weights for males and females at all sites were significantly higher in spring compared to other seasons. Total number of measurements obtained that season over a 5 yr period (including years of above- and below-average rainfall) from tortoises at the Desert Tortoise Research Natural Area (17 males, 14 females), Goffs (14 males, 22 females), and Ivanpah (16 males, 15 females).
Female
IVANPAH Male
Female
GOFFS Male
Female
DTNA Male
Range
WINTER
TABLE 2. Body weight and carapace length at the midline (MCL) for clinically healthy, adult, male and female, free-ranging desert tortoises at three sites in the Mojave Desert (California, USA).
218 JOURNAL OF WILDLIFE DISEASES, VOL. 35, NO. 2, APRIL 1999
CHRISTOPHER ET AL.—HEMATOLOGIC AND BIOCHEMICAL VALUES OF FREE-RANGING DESERT TORTOISES
FIGURE 2. Seasonal variation in body weight (g) for male and female tortoises in the Mojave Desert over a 5 yr period. An average of 16 females and 18 males were sampled each season. There was no significant difference in body weight among sites, so data from the Desert Tortoise Research Natural Area, Goffs and Ivanpah are combined. Note the increase in body weight each spring in association with availability of food and water, particularly in 1992–93, the second consecutive year of above-average rainfall. Data are mean 6 SE.
time (Table 4). Tortoises from Ivanpah tended to have higher basophil counts. Total WBC, heterophil, lymphocyte and basophil numbers were lower in 1990–91 and higher in 1994–95 (Table 5). Seasonal lymphocytes peaks were noted in years with above-average rainfall. Reference intervals based on season were established for all hematologic analytes; separate intervals for male and female tortoises were calculated for PCV, RBC and Hb (Table 6). Clinical chemistry
Cholesterol and triglyceride concentrations were significantly higher in females, and separate reference intervals were calculated for each sex (Table 3, 7). Tortoises from Goffs had higher cholesterol concentrations, and females from Ivanpah had lower triglyceride concentrations than other females. Cholesterol concentration was significantly lower in winter (Table 4). Triglyceride concentration correlated strongly and positively with cholesterol concentration in females (P , 0.0001; r 5 0.620) and to a lesser extent in males (P , 0.0001; r 5 0.398). Calcium and phosphorus concentrations were significantly higher in females, and separate reference intervals were calculated for each sex (Tables 3, 7). Calcium con-
219
centration was strongly seasonal only in females, with low concentrations during hibernation and a marked increase in spring and summer (Table 4; Fig. 5). Females had higher peak calcium concentrations in years with above-average precipitation (Table 5). Phosphorus concentration was significantly lower during hibernation, and sharply increased to peak levels in spring in both sexes (Table 4). Peak phosphorus concentration in males was significantly lower in 1990–91 and 1993–94. Only female tortoises had a significant correlation between calcium and phosphorus concentrations (P , 0.0001; r 5 0.551). Magnesium concentration tended to be higher in females, but differences were not significant. The limited number of magnesium measurements precluded conclusions regarding seasonal, site, or year-to-year differences. Serum iron concentration increased significantly in spring, especially in tortoises at DTNA. Plasma AST and ALT activities were significantly higher in males than females (Table 3). Separate reference intervals by sex were calculated only for AST; the mean difference between male and female ALT activity was 1 U/L, less than the coefficient of variation for the assay. Enzyme activities were consistently low in winter and higher in spring (Table 4; Fig. 6). Activity peaked in spring (AST, ALT) or summer (ALP), and higher peak AST activity occurred in years with above-average rainfall (Table 5). Seasonal differences in ALT activity were small (61 U/L). Plasma glucose, total protein, albumin, and globulin concentrations were low in fall and winter, increased in spring, and highest in spring or summer (Table 4). Mean spring and fall glucose concentrations were lower in 1993–94 (Table 5). Total protein, albumin and globulin concentrations were lower at all times of year in tortoises at DTNA, especially in 1990–91 and 1991–92 (Table 3; Fig. 7). Proportionally lower globulins accounted for higher A/G ratios in tortoises at DTNA. Plasma creatinine and total bilirubin
Female
— — — — — H H — — — — — — H H — — — — — —
Male
Hb H H H — — — — — — — H H — — — — — — — — 4.3 4.2 0.1 1.01 * 104 242 * * * * 1 23 4.7 0.9 * * * * * *
F-Value
40.3 37.5 23.0 42.6 * 97.9 195.3 * * * * 7.6 27.9 217.1 66.6 * * * * * *
P-Value
,0.0001 ,0.0001 ,0.0001 ,0.0001 nsd ,0.0001 ,0.0001 nsd nsd nsd nsd 0.0075 ,0.0001 ,0.0001 ,0.0001 nsd nsd nsd nsd nsd nsd
Sex Differences Meansa
c
b
Difference in mean values between statistically different groups. Mean values were significantly higher (H) or lower (L) than means for the other sex or sites. Males only. d Not calculated. e No significant difference. f Females only.
a
PCV, field (%) PCV, lab (%) RBC (3106/ml) Hemoglobin (g/dl) Uric Acid (mg/dl) Cholesterol (mg/dl) Triglycerides (mg/dl) Total Protein (g/dl) Albumin (g/dl) Globulins (g/dl) A/G Ratio ALT (U/L) AST (U/L) Calcium (mg/dl) Phosphorus (mg/dl) Potassium (mmol/L) Chloride (mmol/L) Total CO2 (mmol/L) Anion Gap (mmol/L) Na/K Ratio Total Iron
Analyte
— — — — Lb — — L L L H — — — — L — H — — H
DTNA
H — — — — H — — — — — — — — — — H — H — —
Goffs
— — — — — — L — — — — — — — — — — — — L —
Ivanpah
3.5 *d * * 1.0 65 91 0.8 0.2 0.6 0.1 * * * * 0.4 7 3 3 3 27
Meansa
Site Difference
0.0057c nsde nsd nsd 0.0024 0.00003 0.003f ,0.0001 0.0001 ,0.0001 0.0027 nsd nsd nsd nsd 0.0070 ,0.0001 0.0006 0.0010 0.0079 0.0012
P-Value
6.1 * * * 6.6 9.2 13.9 16.9 7.7 15.5 6.5 * * * * 5.4 16.7 8.4 7.7 5.2 9.2
F-Value
TABLE 3. Hematologic and plasma biochemical analytes for which results differed significantly between sexes or among sites in 70 adult desert tortoises in the Mojave Desert (California, USA).
220 JOURNAL OF WILDLIFE DISEASES, VOL. 35, NO. 2, APRIL 1999
CHRISTOPHER ET AL.—HEMATOLOGIC AND BIOCHEMICAL VALUES OF FREE-RANGING DESERT TORTOISES
FIGURE 3. Seasonal variation in packed cell volume (PCV, obtained in the field) for male and female tortoises in the Mojave Desert over a 5 yr period. An average of 16 females and 18 males were sampled each season. Note the pronounced seasonal changes in female tortoises compared with males, especially in years with above-average rainfall (1991–92, 1992– 93, 1994–95). Data are mean 6 SE.
concentrations remained between 0 and 0.4 mg/dl in all tortoises; both increased significantly in summer, especially 1993– 94, but the magnitude of increase was small (0.03–0.10 mg/dl). Direct bilirubin concentration was always negligible. Bile acids concentration did not differ significantly between sexes, sites or seasons, attributable, in part, to the limited number of measurements. Slightly higher concentrations of bile acids in winter and spring were attributed to higher values in 1993– 94, especially in summer, in tortoises at Goffs (range 5 0–77.3 mg/dl; median 5 25 mg/dl). The BUN concentration was high in all tortoises at emergence from hibernation, but markedly and significantly decreased in spring by an average of 10 mg/dl (Table 4; Fig. 8). Variable increases in BUN in summer and fall were dependent on rainfall pattern. A marked increase in BUN (and osmolality, sodium and chloride) concentration occurred in tortoises at Goffs on three occasions (Fig. 8): summer 1990– 91, when although NOAA records indicated average summer rainfall, on-site rain gauges recorded no rainfall since spring; fall 1992–93 and winter 1993–94, which were preceded by at least 5 mo with essentially no rainfall (1.5 mm in on-site rain gauges). Plasma BUN was significantly lower at Goffs and higher at Ivanpah and DTNA in fall 1994–95 (Fig. 8). On-site
221
rain gauges showed 6.6 mm (Goffs), 11.2 mm (Ivanpah) and 3.6 mm (DTNA) of rain since summer, but no rain at Ivanpah and DTNA between spring and summer of that year compared to 13.7 mm of rain at Goffs. Mean BUN concentration in all tortoises was significantly higher in 1993– 94 than in 1991–92 (Table 5). Males tended to have slightly higher BUN values than females. Uric acid concentration increased between winter and spring and decreased in fall (Table 4; Fig. 8). There was an inverse relationship between uric acid and BUN concentration (Fig. 9). Tortoises at DTNA had significantly lower concentrations of uric acid, especially in fall (Table 7). A marked increase in uric acid concentration occurred in tortoises at Goffs on three occasions: spring 1991–92, when on-site rain gauges showed that since winter, Goffs had received less rain (22 mm) than both DTNA (72 mm) and Ivanpah (175 mm); spring 1992–93, when on-site rain gauges showed that since winter, Goffs received 49 mm rain compared to DTNA (56 mm) and Ivanpah (13 mm); and spring 1994– 95, when on-site rain gauges showed that since winter, Goffs received more rain (19 mm) than both DTNA (15 mm) and Ivanpah (8 mm) (Fig. 8). Tortoises from Goffs and Ivanpah had significantly higher uric acid concentrations in 1991–92 compared to 1993–94 and 1994–95 (Table 5). Male tortoises had slightly higher uric acid values than females. Osmolality, sodium and chloride concentrations were closely related and generally changed in parallel. Concentrations of these analytes as well as potassium increased significantly in summer, although variation occurred with site, season and year (Tables 3, 4, 5). Osmolality, sodium, chloride, potassium and anion gap concentrations were particularly high in tortoises at Goffs in summer 1990–91, fall 1992–93 and winter 1993–94, concurrent with increased BUN (Fig. 8). Also like BUN, osmolality, sodium, potassium and chloride concentrations were lower at Goffs and
— — — — — — — — — L L — H H — H — — — — L — L L L — L L — — L L
Winter
Summer
H H H H — — — — — — — — — — H — H — — — — — — — — — — — — — — —
Spring
Hb — H — Lb L — — — — — — — — — L — — — — — — — — — — — — H — — H — — — — — — H — — — — L — — L — — L — — — — — — — — — — — — — —
Fall
1.8 2.4 0.06 0.9 38 16 1.7 * * 262 499 67 42 126 20 10 0.1 1.7 0.03 * 42 * 0.7 0.2 0.4 * 30 1 30 * 2.5 1.3
Meansa
Seasonal Differences F-Value
9.5 14.0 5.0 20.3 5.3 10.6 12.3 * * 4.9 16.1 5.6 6.0 12.4 44.7 81.7 28.7 23.1 8.8 * 23.7 * 58.6 65.7 38.4 * 101.9 9.3 51.0 * 28.9 119.5
P-Value
,0.0001 ,0.0001 0.0024 ,0.0001 0.0015 ,0.0001 ,0.0001 nsd nsd 0.0027 ,0.0001 0.0010 0.0007 ,0.0001 ,0.0001 ,0.0001 ,0.0001 ,0.0001 ,0.0001 nsd ,0.0001 nsd ,0.0001 ,0.0001 ,0.0001 nsd ,0.0001 ,0.0001 ,0.0001 nsd ,0.0001 ,0.0001
,0.0001 ,0.0001 ,0.0001 nsd ,0.0001 ,0.0001 ,0.0001 nsd nsd ,0.0001 0.0066 nsd nsd nsd ,0.0001 0.0088 nsd ,0.0001 nsd nsd 0.0021 nsd ,0.0001 0.0042 ,0.0001 nsd 0.0002 0.0007 0.0001 nsd nsd 0.0066
P-Value
8.3 10.3 7.9 * 5.2 8.8 13.3 * * 4.0 3.1 * * * 7.4 3.0 * 9.1 * * 3.6 * 5.5 3.3 5.2 * 4.6 4.1 4.8 * * 3.1
F-Value
Season/Site Interaction
0.0083 0.0043 nsdc 0.0002 nsd nsd nsd nsd nsd nsd nsd nsd nsd nsd nsd 0.0002 nsd ,0.0001 nsd nsd 0.0002 0.0021 ,0.0001 0.0009 ,0.0001 nsd 0.0053 0.0025 0.0002 nsd ,0.0001 ,0.0001
P-Value
4.0 4.5 *d 6.9 * * * * * * * * * * * 6.8 * 7.6 * * 6.8 5.3 11.3 5.7 9.3 * 4.4 4.9 6.8 * 36.3 30.2
F-Value
Season/Sex Interaction
Significant seasonal differences in hematologic and plasma biochemical values of 70 adult desert tortoises in the Mojave Desert (California, USA).
PCV, field (%) PCV, lab (%) RBC (3106/ml) Hemoglobin (g/dl) MCV (fl) MCH (pg) MCHC (g/dl) WBC (/ml) Heterophils (/ml) Lymphocytes (/ml) Basophils (ml) Eosinophils (ml) Monocytes (ml) Azurophils (ml) Glucose (mg/dl) BUN (mg/dl) Creatinine (mg/dl) Uric Acid (mg/dl) Total Bilirubin (mg/dl) Direct Bilirubin (mg/dl) Cholesterol (mg/dl) Triglycerides (mg/dl) Total Protein (g/dl) Albumin (g/dl) Globulins (g/dl) A/G Ratio ALP (U/L) ALT (U/L) AST (U/L) Bile Acids (mg/dl) Calcium (mg/dl) Phosphorus (mg/dl)
TABLE 4.
222 JOURNAL OF WILDLIFE DISEASES, VOL. 35, NO. 2, APRIL 1999
Difference in mean values between statistically different groups. Mean values from seasons with the same letter were significantly higher (H) or lower (L) than means for other seasons. c No significant difference. d Not calculated. b
a
7.8 6.5 7.1 * 4.6 4.5 * * * 0.0005 0.0003 0.0002 nsd 0.0039 0.0042 nsd nsd nsd * 7.4 6.7 * 9.5 7.7 5.5 * 5.6 nsd ,0.0001 ,0.0001 nsd ,0.0001 ,0.0001 ,0.0001 nsd ,0.0001 * 13 6 0.7 8 4 3 4 37 — — — — — — — — — — H H H H L H — — — — — — — — — — — — — — — — H L H L Magnesium (mg/dl) Osmolality (mOsm/kg) Sodium (mmol/L) Potassium (mmol/L) Chloride (mmol/L) Total CO2 (mmol/L) Anion Gap (mmol/L) Na/K Ratio Total Iron (mg/dl)
Meansa Fall
nsd ,0.0001 ,0.0001 ,0.0001 ,0.0001 ,0.0001 ,0.0001 ,0.0001 ,0.0001
* 20.7 19.4 45.7 55.2 64.9 18.3 25.8 34.2
F-Value
Season/Sex Interaction
P-Value P-Value
Season/Site Interaction
TABLE 4.
Continued.
Winter
Spring
Summer
Seasonal Differences
P-Value
F-Value
F-Value
CHRISTOPHER ET AL.—HEMATOLOGIC AND BIOCHEMICAL VALUES OF FREE-RANGING DESERT TORTOISES
223
FIGURE 4. Seasonal variation in major blood leukocytes (WBC; cells/ml) in desert tortoises in the Mojave Desert over a 5 yr period. An average of 34 tortoises were sampled each season. There were no significant differences in WBC numbers on the basis of sex or site. Mean values for all WBC types indicated were lower in 1990–91 compared to 1994–95. Data are mean 6 SE.
higher at Ivanpah and DTNA in fall 1994– 95. Potassium concentration was significantly lower in tortoises at DTNA; however, the mean difference was small (0.4 mmol/L) and resulted largely from lower concentrations in 1993–94. Potassium concentrations were higher in tortoises at DTNA in 1991–92 compared to 1994–95, and were higher in tortoises at Ivanpah in summer 1991–92. Changes in potassium concentration alone accounted for changes in Na/K ratio. Total CO2 concentration was significantly lower in summer and higher in winter at all sites (Table 4). Seasonal differences in anion gap were small, and inversely related to TCO2. Seasonal and site differences in anion gap were exaggerated by isolated seasons of extreme values in tortoises at Goffs in summer 1990–91 (range 18–49) and in tortoises at DTNA in winter 1992–93 (range 211.2–3.8). Because significant site differences in electrolytes resulted from a few, distinct seasonal episodes rather than from consistent differences over the 5 yr period, reference intervals were annotated to indicate occasional extreme values (Table 7).
224
JOURNAL OF WILDLIFE DISEASES, VOL. 35, NO. 2, APRIL 1999
TABLE 5. Hematologic and biochemical analytes for which results differed significantly on the basis of year in 98 adult desert tortoises in the Mojave Desert (California, USA). 1990– 1991– 1992– 1993– 1994– 91a 92b 93b 94c 95b
Analyte
PCV (%) Hemoglobin (g/dl) WBC (/ml) Heterophils (/ml) Lymphocytes (/ml) Basophils (/ml) Eosinophils (/ml) Monocytes (/ml) Azurophils (/ml) Glucose (mg/dl) BUN (mg/dl) Creatinine (mg/dl) Uric Acid (mg/dl) Total Bilirubin (mg/dl) Triglycerides (mg/dl) Total Protein (g/dl) Albumin (g/dl) Globulins (g/dl) ALP (U/L) ALT (U/L) AST (U/L) Calcium (mg/dl) Phosphorus (mg/dl) Osmolality (mOsm/kg) Sodium (mmol/L) Potassium (mmol/L) Chloride (mmol/L) Total Iron (mg/dl)
Ld
Hd
L L L L L — — — — — — — — — — L — L — — — L — — — — —
H — — — — — H — — L — H — — H — H H H H H — — — H — —
H H — — H H H — — — — — H — — H — H H H H H — L L — L —
— — — — — — — H H L H H L H L — — L — — — L L H H — H L
H H H H H H — — H — — — H — — — — H — H H H — — — L — —
Comments
all tortoises (L); females in summer (H) all tortoises (L); females in summer (H) — — — — spring only — — spring and fall — — Goffs and Ivanpah summer only males only Goffs and Ivanpah — Goffs and Ivanpah — peak seasonal activity peak seasonal activity female peak seasonal levels males only DTNA (H); Goffs and Ivanpah (L) DTNA (H); Goffs and Ivanpah (L) DTNA only DTNA (H); Goffs and Ivanpah (L) Ivanpah only
a
A year of average rainfall, preceded by two years of below-average annual and winter rainfall. A year of above-average annual and winter rainfall. A year of below-average annual, winter and summer rainfall. d Mean values from years with the same letters were significantly higher (H) or lower (L) than means for other years. b c
DISCUSSION
Because desert tortoises are capable of profound physiologic adaptation in conjunction with extreme variations in habitat and season, reference intervals for hematologic and biochemical data from freeranging tortoises must be obtained under well-defined conditions to provide meaningful information. In the present study, we comprehensively analyzed the influences of sex, geographic location, time of year, and annual rainfall patterns on laboratory profiles of clinically healthy adult desert tortoises. Reference intervals were defined to reflect the seasonal differences in nearly all analytes, the sex differences in a limited number of analytes, and occasional site
differences. Although reference intervals were calculated using limited repeated determinations, weighting was minimized by use of minimum, maximum and median values and because values were from years with variable rainfall. The central 95 percentiles provided the best indication of the expected range of values, as they excluded occasional extreme values. Because site differences were minimal over the 5 yr period, the reference intervals are readily applicable to other desert tortoise populations provided there is understanding of the impact of rainfall, forage type, and other ecological aspects of the desert environment. Most physiologic variations occurred consistently from year-to-year and
b
29.5 22.0 27.0 20.3 0.69 0.49 7.2 5.4 402 106 26 4,780 3,074 410 46 80 532 99
Median
WINTER
18.4–39.6 15.0–30.6 17.0–39.9 13.7–30.8 0.39–1.04 0.28–0.80 4.6–9.9 3.6–7.2 264–688 64–165 20–35 967–10,520 600–7,256 23–1,881 0–568 0–557 5–2,704 0–902
Mid-95%
76 76 76 76 76 76 76 76 152 152 152 152 152 152 152 152 152 152
nb
29.5 25.0 27.0 22.5 0.69 0.59 7.0 5.8 374 98 26 4,550 2,315 494 0 56 1,196 50
Median
SPRING
19.8–39.0 18.0–31.5 15.8–37.4 15.0–31.7 0.31–1.35 0.36–1.00 4.5–9.5 4.1–7.4 197–608 39–162 19–32 1,424–10,857 490–6,832 0–3,194 0–337 0–856 0–4,355 0–660
Mid-95%
90 91 90 91 90 91 90 91 181 181 181 181 181 181 181 181 181 181
n
29.0 25.0 27.0 25.0 0.68 0.59 7.4 6.6 407 110 28 4,885 2,563 583 0 61 1,011 0
Median
SUMMER
21.8–37.1 19.5–31.8 19.0–34.5 18.0–33.6 0.36–1.08 0.39–0.94 5.2–9.9 4.1–9.1 254–638 74–186 20–33 1,496–10,924 719–7,159 63–2,746 0–324 0–950 62–3,574 0–557
Mid-95%
93 78 93 78 93 78 93 78 171 171 171 171 171 171 171 171 171 171
n
20.2–36.0 16.6–30.0 16.2–37.5 15.0–28.2 0.33–1.31 0.32–0.90 4.7–10.3 4.3–8.4 218–655 68–189 23–35 394–10,121 171–6,918 8–3,816 0–318 0–708 32–3,759 0–619
Mid-95%
28.0 23.0 25.0 21.0 0.64 0.52 7.0 5.8 404 112 28 4,520 2,596 580 0 0 751 0
Median
FALL
109 106 109 106 109 106 109 106 215 215 215 215 215 215 215 215 215 215
n
Population specifications: M 5 males; F 5 females; All 5 all tortoises. Total number of samples obtained that season over a 5 yr period (including years of above- and below-average rainfall) from a population of 98 (47 male, 51 female) desert tortoises at the Desert Tortoise Research Natural Area (31 tortoises), Goffs (36 tortoises), and Ivanpah (31 tortoises).
M F M F M F M F All All All All All All All All All All
PCV (%; field) PCV (%; field) PCV (%; lab) PCV (%; lab) RBC (3106/ml) RBC (3106/ml) Hemoglobin (g/dl) Hemoglobin (g/dl) MCV (fl) MCH (pg) MCHC (g/dl) WBC (/ml) Heterophils (/ml) Lymphocytes (/ml) Monocytes (/ml) Eosinophils (/ml) Basophils (/ml) Azurophils (/ml)
a
PSa
Hematology reference intervals for clinically healthy, adult, male and female, free-ranging desert tortoises in the Mojave Desert (California, USA).
Analyte
TABLE 6.
CHRISTOPHER ET AL.—HEMATOLOGIC AND BIOCHEMICAL VALUES OF FREE-RANGING DESERT TORTOISES 225
Analyte
D G, I All All D G, I Alld M F All All All All M F Alle M, G M, D, I F, G F, D, I All D G, I All D G, I All All All
PSa
0.9 1.1 17 5 0.57 0.50 7 47 32 1.5 0 0.1 17 10.8 12.0 105 77 48 152 112 0.2 1.5 2.1 87 46 6 4.3 33 277
0.5–1.3c 0.7–1.7 6–45 1–5 0.29–1.20c 0.32–0.86 29–19 21–153 11–86 0–44.0 0 0–0.2 6–57 8.1–13.2 9.6–16.2 89–132 18–333c 17–103 67–365c 58–241 0.2–0.3 1.0–2.0c 1.2–3.6 40–169 1–104c 2–49 3.3–5.5 25–51 249–346
Median
Mid-95%
WINTER
33 119 152 152 33 119 152 76 76 152 152 152 152 76 76 152 33 43 31 45 152 33 119 152 33 119 152 152 152
nb
1.2 1.3 39 4 0.55 0.50 9 84 50 0.7 0 0.1 2 11.1 17.5 107 119 104 227 165 0.2 2.2 2.5 101 126 51 4.9 31 274
Median
SPRING
0.9–2.0 20–88 1–16 0.38–1.07c 0.33–0.86 1–21 46–177 25–113 0–18.0 0–0.1 0–0.3 1–13 8.7–13.6 10.6–30.7 94–122 67–243c 52–171 127–339c 77–286 0.1–0.4 1.2–2.7c 1.5–3.9 52–161 98–236c 9–112 3.5–7.6 23–40 247–314
0.9–2.2c
Mid-95%
38 143 181 181 38 143 181 90 91 181 181 181 181 90 91 181 39 51 33 58 181 38 143 181 38 143 181 181 181
n
0.8–1.8 1.0–1.9 25–114 1–5 0.41–0.97 0.33–0.82 2–29 24–123 15–78 0–55.0 0 0–0.3 1–37 8.6–12.5 11.3–23.9 101–138 41–217c 33–118 90–381c 60–281 0.2–0.4 1.3–2.7 1.7–3.9 65–186 27–123 20–101 3.5–6.4 22–38 252–352
Mid-95%
1.4 1.4 50 5 0.69 0.52 10 48 37 0 0 0.1 6 10.5 18.3 119 85 69 223 183 0.3 2.0 2.6 113 64 46 4.2 28 292
Median
SUMMER
41 130 171 171 41 130 171 93 78 171 171 171 171 93 78 171 34 59 28 50 171 41 130 171 41 130 171 171 171
n
0.6–1.6 0.8–1.8 23–82 1–5 0.35–1.24 0.33–0.86 0–23 25–134 11–62 0–37.0 0 0–0.2 1–53 9.2–13.0 10.8–18.2 100–141 35–251 32–146 110–496 86–298 0.2–0.4 1.0–2.6 1.3–3.8 45–130 26–118 13–102 3.8–7.1 22–42 250–346
Mid-95%
1.2 1.2 41 5 0.66 0.50 6 50 28 1.5 0 0.1 9 11.0 15.0 113 109 68 243 164 0.3 1.6 2.3 73 61 39 5.0 29 285
Median
FALL
49 166 215 215 49 166 215 109 106 215 215 215 215 109 106 215 45 64 43 63 215 49 166 215 49 166 215 215 215
n
Plasma biochemistry reference intervals for clinically healthy, adult, male and female, free-ranging desert tortoises in the Mojave Desert (California, USA).
Albumin (g/dl) Albumin (g/dl) ALP (U/L) ALT (U/L) A/G Ratio A/G Ratio Anion Gap (mmol/L) AST (U/L) AST (U/L) Bile Acids (mg/dl) Bilirubin, Direct (mg/dl) Bilirubin, Total (mg/dl) BUN (mg/dl) Calcium (mg/dl) Calcium (mg/dl) Chloride (mmol/L) Cholesterol (mg/dl) Cholesterol (mg/dl) Cholesterol (mg/dl) Cholesterol (mg/dl) Creatinine (mg/dl) Globulins (g/dl) Globulins (g/dl) Glucose (mg/dl) Iron (mg/dl) Iron (mg/dl) Magnesium (mg/dl) Na/K Ratio Osmolality (mOsm/kg)
TABLE 7.
226 JOURNAL OF WILDLIFE DISEASES, VOL. 35, NO. 2, APRIL 1999
Analyte
Continued.
M F Allf All Allg D G, I M F, I F, D, G D G, I
PSa
1.0 1.0 4.2 139 32 2.4 3.3 8 215 269 3.5 5.0
Median
WINTER
0.5–1.8 0.4–2.4 2.8–5.9 125–168 22–45 1.7–3.0c 2.0–5.0 2–26 7–274c 68–424 1.3–11.5c 1.7–8.7
Mid-95%
76 76 152 152 152 33 119 76 28 48 33 119
nb
2.8 4.6 4.5 139 27 3.4 3.8 46 179 271 5.4 5.2
Median
SPRING
1.0–4.2 1.0–8.7 3.4–6.0 125–160 14–40 2.3–4.7c 2.6–5.4 7–164 12–303c 75–610 1.8–8.9c 2.1–14.7
Mid-95%
90 91 181 181 181 38 143 90 39 52 38 143
n
1.1–3.3 2.0–6.5 3.7–7.5 127–176 14–32 2.3–4.1 2.9–5.3 7–32 14–439c 11–603 1.7–8.3 2.6–9.2
2.1 3.1 5.2 147 24 3.3 4.0 14 276 400 3.4 4.9
Median
SUMMER Mid-95%
93 78 171 171 171 41 130 93 28 50 41 130
n
0.8–2.6 0.9–3.2 3.3–7.1 127–176 17–36 1.9–3.7 2.3–5.1 6–32 27–299c 208–491 1.2–4.6 1.6–7.4
Mid-95%
1.8 1.9 4.9 144 27 2.8 3.7 16 216 329 2.5 3.4
Median
FALL
109 106 215 215 215 49 166 109 37 69 49 166
n
a
Population specifications: M 5 males; F 5 females; D 5 Desert Tortoise Research Natural Area (DTNA), western Mojave; G 5 Goffs, eastern Mojave; I 5 Ivanpah, northeastern Mojave; All 5 all tortoises. b Total number of samples obtained that season over a 5 yr period (including years of above- and below-average rainfall) from a population of 98 (47 male, 51 female) desert tortoises at the DTNA (31 tortoises), Goffs (36 tortoises), and Ivanpah (31 tortoises). c Minimum and maximum values are reported instead of mid-95 percentile because of small sample size (n , 40). d Anion gap .30 mmol/L may be observed in tortoises at Goffs during extreme dry conditions. e Chloride .130 mmol/L may be observed in tortoises at Goffs during extreme dry conditions. f Potassium concentrations do not exceed 6.5 mmol/L in tortoises at DTNA. g Total CO .40 mmol/L may be observed occasionally in tortoises at DTNA. 2
Phosphorus (mg/dl) Phosphorus (mg/dl) Potasssium (mmol/L) Sodium (mmol/L) Total CO2 (mmol/L) Total Protein (g/dl) Total Protein (g/dl) Triglycerides (mg/dl) Triglycerides (mg/dl) Triglycerides (mg/dl) Uric Acid (mg/dl) Uric Acid (mg/dl)
TABLE 7.
CHRISTOPHER ET AL.—HEMATOLOGIC AND BIOCHEMICAL VALUES OF FREE-RANGING DESERT TORTOISES 227
228
JOURNAL OF WILDLIFE DISEASES, VOL. 35, NO. 2, APRIL 1999
FIGURE 5. Seasonal variation in plasma calcium and phosphorus concentrations (mg/dl) in male and female desert tortoises in the Mojave Desert over a 5 yr period. An average of 16 females and 18 males were sampled each season. Note the marked increases in spring, and the lower peak values for both analytes in 1993-94, a year of below-average rainfall. Data are mean 6 SE.
were attributable to sex/reproductive cycle, hibernation and the availability of food and water. The magnitude and direction of year-to-year changes were dependent on winter precipitation amounts. Effects of sample quality
Ensuring high quality samples and optimal sample handling was a major challenge in the desert environment. Jugular venipuncture avoided contamination or dilution of blood with lymph, which can markedly impact hematologic and biochemical results (Hart et al., 1991; Jacobson et al., 1992). Even in the absence of lymphatic dilution, differences in venipuncture site can significantly affect laboratory values (Gottdenker and Jacobson, 1995). Because ethylenediaminetetraacetic acid (EDTA) causes lysis of chelonian blood, heparin was used as an anticoagulant, despite problems with thrombocyte and WBC clumping, and background staining on blood smears (Jacobson, 1987; Hawkey and Dennett, 1989; Alleman et al., 1992). Leukocyte clumping could account for differences between our total and differential WBC counts and those of others in which WBCs were estimated
FIGURE 6. Seasonal variation in plasma activity (U/L) of aspartate aminotransferase (AST) and alkaline phosphatase (ALP) in desert tortoises in the Mojave Desert. An average of 16 females and 18 males were sampled each season. Female tortoises had significantly lower AST activity than males; ALP activity did not differ by sex, and data are combined for all tortoises. Data are mean 6 SE.
from smears (Dickinson et al., 1995, 1996). Clots were the most common problem in whole blood samples, and may have resulted from difficult venipunctures. In reptiles, clotting times are slow and unpredictable (warranting use of plasma versus serum) which probably explains why clots were not usually apparent until the time of analysis (Dessauer, 1974; Bolten et al., 1992). Although 24 hr is considered an acceptable time until whole blood is analyzed (Jacobson et al., 1992), the difference and variation in PCV obtained in the laboratory versus the field suggested RBC shrinkage or lysis during transport, or operator differences. Insufficient sample volume, fibrin clots and other technical problems accounted for most of the unacceptable plasma specimens. Although heparin is an effective anticoagulant, fibrin sometimes forms in the separated plasma, which may interfere with the autoanalyzer (Kaplan and Pesce, 1996). Drastic changes in iron and creatinine values coincided with a change in autoanalyzer (done as part of a routine laboratory upgrade) which forced us to exclude some early values. The method of
CHRISTOPHER ET AL.—HEMATOLOGIC AND BIOCHEMICAL VALUES OF FREE-RANGING DESERT TORTOISES
FIGURE 7. Seasonal variation in total protein, albumin and globulin concentrations (g/dl) in desert tortoises in the Mojave Desert over a 5 yr period. An average of 8 tortoises at DTNA, 14 at Goffs and 13 at Ivanpah were sampled each season. Tortoises at DTNA had significantly lower concentrations of all proteins compared to tortoises at Goffs and Ivanpah. Note that globulins decreased in 1993–94, a year of below-average rainfall. Data are mean 6 SE.
analysis and type of autoanalyzer are known to affect biochemical results (Bolten et al., 1992; Duncan et al., 1994). Sex differences
Sex differences in body weight and MCL and the relation between these parameters were similar to those previously described for desert tortoises and other chelonia (Jackson, 1980; Spratt, 1990; Jacobson et al., 1993; Blakey and Kirkwood, 1995). Season, sex, diet and other factors can influence the relationship between body weight and length in desert tortoises; however, the only significant difference we observed was between female and male tortoises, which may have related to oviposition (Jacobson et al., 1993; Blakey and Kirkwood, 1995). A sex difference in RBC mass was previously noted in desert tortoises (O’Connor et al., 1994) and other chelonia (Hart et al., 1991), and was thought to be consistent with lower female body mass.
229
FIGURE 8. Seasonal variation in plasma urea (BUN) and uric acid concentrations (mg/dl) and osmolality (mOsm/kg) in desert tortoises in the Mojave Desert over a 5 yr period. An average of 8 tortoises at DTNA, 14 at Goffs and 13 at Ivanpah were sampled each season. Tortoises at Goffs (shown separately from tortoises at DTNA and Ivanpah combined) had marked, episodic fluctuations in these analytes, apparently the result of drought (increased BUN and osmolality) or hydration (increased uric acid). Data are mean 6 SE.
However, in desert tortoises in the Mojave and Sonoran deserts of Utah and Arizona, sex differences were not observed in PCV or Hb (Dickinson et al., 1995, 1996), nor were significant associations observed between PCV and sex or size in green turtles (Bolten and Bjorndal, 1992). In this study,
FIGURE 9. There was an inverse relationship between blood urea nitrogen (BUN) and uric acid concentrations (mg/dl) in 98 desert tortoises in the Mojave Desert sampled over a 5 yr period. Data are mean 6 SE for all years and tortoises.
230
JOURNAL OF WILDLIFE DISEASES, VOL. 35, NO. 2, APRIL 1999
hormonal, dietary, and hydration influences also affected RBC mass, as evidenced by annual seasonal changes (especially in females), and increased values in years with above-average rainfall. The RBC mass in these free-ranging tortoises was slightly lower than for captive desert tortoises (Rosskopf, 1982), but PCV was slightly higher and Hb was slightly lower than mean values for free-ranging tortoises in Utah and Arizona (Dickinson et al., 1995, 1996). Considerable variation in MCV and MCH values (and wide reference limits) were attributed to the large degree of error inherent in manual RBC counting, compounded by the fact that these are calculated values (Duncan et al., 1994). The RBC count, MCV and MCH also could have been affected by in vitro RBC shrinkage, swelling, or lysis; the field PCV, Hb and MCHC would be least affected by these artifacts. Erythrocyte parasites have been observed in some desert tortoises (Alleman et al., 1992), but were absent in tortoises in this study and in blood smears from over 300 captive desert tortoises (Rosskopf, 1982). High concentrations of cholesterol, triglycerides, calcium, and phosphorus in female tortoises were consistent with egg production and vitellogenesis. In the eastern and northeastern Mojave, female tortoises ovulate in early spring followed by deposition and calcification of eggshells (Turner et al., 1986; Rostal et al., 1994). The latter coincided with sharp increases in plasma calcium and phosphorus concentrations. Calcium levels remained high throughout nesting and into summer. Plasma lipid concentrations increased in late summer and early fall, coinciding with follicular growth and vitellogenesis (Rostal et al., 1994). We observed no biochemical difference in reproductive cycling between tortoises in the eastern and western Mojave, although females at Ivanpah had lower triglyceride concentrations, which may reflect lower fat stores, less fat mobiliza-
tion, less dietary fat, or differences in vitellogenin composition. High concentrations of the plasma protein vitellogenin can markedly impact plasma concentrations of calcium, lipids and total protein in egg-producing females (Dessauer, 1977). High plasma lipid and/ or total protein concentrations were observed in captive, gravid female Testudo graeca and T. hermanni (Lawrence, 1987), free-ranging desert tortoises in the Sonoran Desert (Dickinson et al., 1996), and female Gopherus polyphemus (Taylor and Jacobson, 1982). Although lipids were higher in females in this study, total protein concentration was not significantly different from that of males. Effects of hibernation
Hibernation was associated with the greatest number and magnitude of hematologic and biochemical changes, which were categorized as (1) decreased immune function, (2) production and retention of nitrogenous wastes, (3) decreased food intake, and (4) decreased metabolic activity. Decreased immune stimulation was evidenced by decreased numbers of lymphocytes (lymphopenia) and low globulin concentration. Hibernation lymphopenia (and sometimes heteropenia) has been observed in other reptiles (Saad and El Ridi, 1988) and other species of tortoises (Lawrence and Hawkey, 1986). Lymphopenia is considered evidence of suppressed immune function and antibody production, secondary to low ambient temperature, change in photoperiod, and elevation in plasma cortisol level (Saad, 1988; Montali, 1988; Lance, 1994). Because lymphocytes synthesize immunoglobulins, the main component of plasma globulins, globulin (and sometimes, total protein) concentration is subsequently affected. Immunoglobulins and antibody responses are greatest in spring and summer (Dessauer, 1977; Lance, 1994). The decrease in basophils during hibernation may also be indicative of decreased immune function or absence of antigenic
CHRISTOPHER ET AL.—HEMATOLOGIC AND BIOCHEMICAL VALUES OF FREE-RANGING DESERT TORTOISES
stimulation, but the exact function of these cells in reptiles is unknown. Basophils are thought to play a prominent role in host defense in birds and reptiles, since circulating numbers are considerably higher than in mammals (Montali, 1988). In agreement with a previous study, heterophils (analogous to mammalian neutrophils) were the predominant WBC in desert tortoises (Alleman et al., 1992). Unlike lymphocytes and basophils, monocytes and azurophils increased during hibernation. In Gopherus polyphemus, monocytes also were increased in spring (Taylor and Jacobson, 1982). After leaving the blood, monocytes differentiate into macrophages and contribute to the inflammatory response. Desert tortoise azurophils contain peroxidase-positive granules similar to mammalian monocytes and are morphologically distinct from azurophils observed in snakes and alligators (Alleman, 1992). Although commonly observed in chelonia and squamata, the function of azurophils remains unknown. Altered WBC numbers during hibernation suggest a shift in the way tortoises process antigens, or changes in WBC production, circulation or sequestration. Further investigation into desert tortoise WBC and immune function is essential for better understanding seasonal variations and their potential impact on response to disease. Eosinophil numbers did not change during hibernation, but decreased in fall, an opposite effect from that observed in captive Testudo spp. in fall (Lawrence and Hawkey, 1986). While an eosinophil response to internal parasites has been reported (Rosskopf, 1982), it is not a consistent finding in reptiles (Montali, 1988). During hibernation, tortoises store nitrogenous wastes (urea and uric acid) in their bladder, increasing the osmolality of urine (Peterson, 1996a). Uric acid precipitates out as potassium salts, which are visible as a gelatinous sludge or silt in the urine, and which prevent accumulation of toxic plasma levels of potassium. Urea con-
231
centration gradually increases in urine during hibernation. Because urea can diffuse passively across the bladder wall, increased urine urea eventually leads to increased blood urea (BUN), which in turn leads to increased plasma osmolality (Baze and Horne, 1970). Some increase in BUN may be caused by protein catabolism, since proteins may serve as an energy source during hibernation (Baze and Horne, 1970; Christopher et al., 1994; Henen, 1997). If protein was catabolized, it had no apparent effect on body weight, but could have accounted for part of the decrease in albumin and total protein. Body weight decreased during hibernation in 1993–94, the year of below-average rainfall. Because hydration (particularly bladder water) is a major determinant of body weight, it is likely that tortoises entered hibernation that year with less stored urinary water, probably because of dry fall conditions (Peterson, 1996a). The desert tortoise bladder is an effective water reservoir during hibernation (and drought) (Dantzler and SchmidtNielsen, 1966; Baze and Horne, 1970; Nagy and Medica, 1986; Peterson, 1996a). Stored water from the bladder (and to a lesser extent the gastrointestinal tract) shifts into the circulatory system, and together with decreased tortoise activity, humid and cool burrows, cool ambient temperature, and decreased metabolic and respiratory rates, serves to limit increases in osmolality and sodium concentration. A transient increase in MCV in hibernating Mediterranean tortoises was thought to result from an intravascular water shift and subsequent RBC swelling (Gilles-Ballien, 1973; Lawrence and Hawkey, 1986). This was not observed in desert tortoises; however, a temporary shift easily could have been missed since blood was obtained only at the beginning and end of hibernation. A fluid shift may have contributed to slightly lower PCV and protein values. Both hemodilution and hemoconcentration have been reported during hibernation in other reptiles (Gilles-Ballien,
232
JOURNAL OF WILDLIFE DISEASES, VOL. 35, NO. 2, APRIL 1999
1973), which may reflect variation in technique or blood handling. Hibernation also was characterized by lower concentrations of cholesterol, glucose, total protein, albumin, phosphorus, iron, and, in females, calcium, consistent with decreased nutrient intake. Because a portion of calcium is protein-bound, decreased protein may have contributed to decreased calcium; however, no effect was observed in male tortoises. Glucose concentration sometimes increased between fall and the emergence from hibernation, suggesting that some tortoises may have already emerged from their burrows and eaten prior to the winter sampling. Gluconeogenesis also may have occurred, and contributed to arousal of tortoises from hibernation (Lawrence, 1987). Lawrence (1987) suggested that when nutrients are available, hepatic glycogen stores peak in summer and fall for use during hibernation. In this study, glucose peaked in summer but decreased by fall, suggesting that glycogen depletion occurred prior to hibernation, i.e., was used as fuel during the dry, late summer. High summer glucose concentration in tortoises in the Las Vegas Valley (northeastern Mojave) was followed by increased plasma ketones, suggesting that lipid catabolism may take over as an energy source as tortoises enter hibernation (Christopher et al., 1994). The large digestive capacity and slow transit time of intestinal vegetation also may provide energy in fall (Meienberger et al., 1993; Barboza, 1995). Decreased metabolic activity during hibernation was indicated by low plasma enzyme activities. The sex difference in AST has been described previously (O’Connor et al., 1994; Dickinson et al., 1996), but the tissue origin of plasma AST in desert tortoises remains unknown. In most species, large amounts of AST are found in liver, skeletal muscle, and erythrocytes, and ALT is found primarily in liver (Duncan et al., 1994). Although differences in methods limit comparison of enzyme activities with those reported in other stud-
ies, ALT activity is consistently low in desert tortoises (Gottdenker and Jacobson, 1995; Dickinson et al., 1995, 1996) and other tortoise species (Samour et al., 1986). Increased TCO2 (and decreased anion gap) during hibernation may be attributed to renal retention of bicarbonate in compensation for decreased respiration (Christopher et al., 1994). Total CO2, equivalent to plasma bicarbonate concentration, is generally higher in tortoises because of their herbivorous nature (Samour et al., 1986). Gut fermentation probably halts during hibernation, however, so that fermentation is an unlikely source of increased TCO 2 (Woodbury and Hardy, 1948). Decreased albumin (an anion) also may have contributed to decreased anion gap. Effects of hydration and food intake
The time between emergence from hibernation (late winter) and spring was marked by increased body weight, and biochemical changes associated with hydration (decreased BUN, increased uric acid), ingestion of nutrients (increased glucose, total protein, albumin, phosphorus, cholesterol, iron, and potassium concentrations) and increased metabolic activity (increased ALP, AST and ALT activities). Male fighting behavior with subsequent muscle or tissue injury is another possible cause of high spring AST activity. Winter precipitation at all three sites is crucial for growth and germination of succulent, green, winter and spring annuals; herbaceous perennials and cacti; and ephemeral forbs and grasses which flower and set seed the following spring. All of these are important edible forage for desert tortoises (Burge and Bradley, 1976; Turner and Randall, 1989; Jennings, 1993; Henen, 1994). The BUN concentration was the most sensitive indicator of availability of water and green forage, with uniformly low values in hydrated tortoises in spring and high concentrations in dry seasons. Upon
CHRISTOPHER ET AL.—HEMATOLOGIC AND BIOCHEMICAL VALUES OF FREE-RANGING DESERT TORTOISES
eating and drinking in the spring, tortoises produce dilute urine, which is quickly voided to clear the bladder of wastes accumulated during hibernation (Minnich, 1977; Nagy and Medica, 1986; Christopher et al., 1994; Peterson 1996a). Decreased urea synthesis also occurs, concurrent with increased uric acid production (Dantzler and Schmidt-Neilsen, 1966). Stimulation of uric acid synthesis by potassium-rich plant ingestion ensures effective precipitation of potassium in the urine as urate salts (Oftedal et al., 1996). Direct dietary effects on uric acid are also possible, but uric acid concentration did not increase as much as in captive tortoises fed diets supplemented with concentrated animal protein (Mautino and Page, 1993). Seasons of relative drought (usually summer or fall) were characterized by increased BUN, osmolality, electrolytes, and anion gap, and decreased body weight and TCO2, consistent with dehydration. Of the electrolytes, chloride concentrations changed most consistently in response to hydration. Changes in potassium concentration were least consistent, probably because of dietary influences and close regulation by precipitation with uric acid in the urine. Dehydration had a minimal effect on total protein and albumin concentrations, and RBC mass. The very low concentrations of creatinine, and total and direct bilirubin, despite increases in dry seasons, made them less sensitive indicators of dehydration (Taylor and Jacobson, 1982; Samour et al., 1986; Dickinson et al., 1996). Overall, the degree of change in laboratory values during drought was usually small, probably because of efficient water retention. This concurred with findings in one study, in which free-ranging tortoises without available water had water, salt and nutrient levels that closely matched watersupplemented captive tortoises (O’Connor et al., 1994). Dilute urine stored in the bladder provides a source of body water during drought, just as it does during hibernation. Only when urine osmolality
233
reaches 300 mOsm/kg does plasma osmolality (and BUN concentration) begin to rise (Dantzler and Schmidt-Neilsen, 1966; Peterson, 1996a). Compared with captive (Rosskopf, 1982), and free-ranging desert tortoises in the Mojave and Sonoran deserts in Utah and Arizona (Dickinson et al., 1995, 1996), tortoises in this study had higher average values for BUN, osmolality, and electrolytes, especially in summer and fall. This suggests greater environmental extremes and a more arid environment in the eastern and western Mojave Desert. Effects of rainfall patterns and geographic site
Winter precipitation, which tends to be widespread, long in duration and evenly distributed, is more representative of longterm environmental conditions than summer rainfall and can be a more sensitive measure of drought than annual precipitation (Rowlands, 1995). Laboratory values for several analytes differed in those years with above-average winter rainfall (1991– 92, 1992–93 and 1994–95) compared to a year of below-average rainfall (1993–94). These included analytes affected by available forage (phosphorus, glucose, uric acid, iron, triglycerides), which were lower in 1993–94, and indicators of dehydration (BUN, osmolality, electrolytes), which were higher. The year 1990–91 had average to slightly above-average rainfall but had been preceded by two years of low winter rainfall at all three sites, possibly accounting for lower values of blood cells, albumin and phosphorus (Peterson, 1994, 1996a). Enhanced metabolic and reproductive activities during wetter years were indicated by higher PCV and calcium values in females and increased ALP, AST and ALT activities in all tortoises. In addition, lymphocyte and globulin concentrations increased in years with above-average rainfall, consistent with enhanced immune function and less physiologic stress (Lance, 1994). Residual or long-term effects of increased rainfall were suggested by more prominent changes in laboratory values in
234
JOURNAL OF WILDLIFE DISEASES, VOL. 35, NO. 2, APRIL 1999
the second consecutive year of above-average rainfall (1992–93) compared with the first (1991–92). For example, spring weight gains were highest in 1992–93. Long-term effects may be physiologic, or related to regional forage growth. Patterns of change in laboratory data during drier years were similar to those observed during hibernation, confirming the similarity in physiologic responses to drought and dormancy, including decreased tortoise activity and food intake; retention of water, urine and nitrogenous wastes; precipitation of urate salts; and decreased immune function. Body weight was maintained in drier years, consistent with minimal water loss and slowed metabolism (Peterson, 1994, 1996a; Henen, 1997). In contrast to the broad impact of winter rainfall, summer precipitation (or lack thereof) resulted in sporadic, transient, site-specific alterations in laboratory values. Summer rainfall is brief, patchy and localized, so that measurements at moderately distant weather stations may not accurately reflect conditions on study plots. In this regard, on-site rain gauges were particularly useful in interpreting the effects of summer rainfall. Eastern and northeastern Mojave sites tend to have the most summer rain, which although sporadic and below-average some years, may provide tortoises with free drinking water as well as a separate summer flora (Medica et al., 1980; Peterson, 1996b; Henen, 1997). Summer precipitation in 1991–92 at Ivanpah probably resulted in availability and ingestion of summer annuals, causing the increased plasma potassium concentration in those tortoises. Conversely, even though rainfall was recorded in the gauge at Ivanpah in summer 1994–95, high BUN values the ensuing fall suggested rain did not fall directly on the study plot. Tortoises at Goffs, the hottest of the three sites, experienced the most extreme environmental and physiologic alterations in relation to drought, e.g., the sharp increase in electrolytes, osmolality, BUN, and anion gap in summer 1990–91. Al-
though average amounts of rain fell at Goffs that summer, it either fell late in summer (after sampling), or at a time or place that did not benefit the tortoises. The high anion gap pointed to an increase in endogenous anions (e.g., ketones or uremic acids). Similar episodes of drought occurred in fall 1992–93 and winter 1993– 94. In contrast, based on low BUN values, tortoises at Goffs were more hydrated than other tortoises in fall 1994–95, probably because considerably more rain fell the previous spring and summer. Dramatic peaks in spring uric acid concentration in tortoises at Goffs were not associated with abundant recent rain, but did follow winters with above-normal precipitation. Interestingly, tortoises at DTNA and Ivanpah did not respond similarly to abundant winter precipitation, nor did they experience the dramatic changes in laboratory values seen in tortoises at Goffs with dehydration, despite experiencing equally or more severe periods of drought. Perhaps there are physiologic differences, e.g., in efficiency of water retention, in tortoises in the eastern Mojave. Also, the western Mojave, although drier in summer and fall, has far greater variety and biomass in its winter-spring flora than the eastern or northeastern Mojave (Jennings, 1993). Tortoises at DTNA may be able to eat more in the spring, and subsequently undergo less dramatic alterations in drier months. Summer rain at DTNA, the driest site, was very low over the long-term and rare during the study period (except 1994–95), restricting tortoise above-ground activity to spring months. Summer flora is usually absent at DTNA, and cacti as well as perennial grasses largely have been depleted by historical cattle and sheep grazing. It is likely that the particularly dry summer and fall conditions of the western Mojave, and subsequent decline in availability of nutritients, contributed to lower potassium, protein, and uric acid concentrations in tortoises at DTNA (Minnich, 1977; Jacobson et al., 1991; Bolten and Bjorndal,
CHRISTOPHER ET AL.—HEMATOLOGIC AND BIOCHEMICAL VALUES OF FREE-RANGING DESERT TORTOISES
1992). Total protein concentrations in tortoises at Goffs and Ivanpah were not only higher, but were similar to those observed in captive desert tortoises (Rosskopf, 1982). Regional plant composition and diet also may have contributed to site differences in cholesterol (Goffs) and iron (DTNA) concentrations (Burge and Bradley, 1976; Turner and Randall, 1989; Jennings, 1993). Plasma iron concentration at all three sites exceeded previously reported values of 0–150 mg/dl for six chelonian species (Dessauer, 1977). Differences in the nutritional contribution of Mojave Desert forage is also suggested by the lower glucose, total protein, albumin, phosphorus and uric acid concentrations in these tortoises compared to free-ranging tortoises in the Sonoran Desert (Dickinson et al., 1996). In summary, seasonal effects on laboratory values resulting from hibernation and the availability of food and water were marked and consistent from year-to-year so that seasonal reference intervals must be used in interpretation of most laboratory values in desert tortoises. In addition, sex-specific reference intervals must be used for some analytes. The reference intervals provided here are directly applicable to desert tortoises in the western and eastern Mojave Desert, but may be applied to other tortoise populations provided there is understanding of the impact of regional forage and precipitation patterns. ACKNOWLEDGEMENTS
This work was funded by the Department of the Interior, Bureau of Land Management Contract Nos. B950-C1-0060 (Christopher), YA-651-CT0-340079 (Nagy), and CA950-CT047 (APL Laboratories) and National Biological Service Contract No. 14-48-0006-95-003. Federal and state permits were issued to and administered by K. Berry. The hard work and dedication of the following field workers made this work possible: B. S. Wilson, M. A. Wilson, A. Ancel, I. Girard, and C. Tran. The authors also thank M. Brown, E. R. Jacobson, V. Dickinson, J. Klaassen, and J. Lumsden for their contributions to this work.
235
LITERATURE CITED ALLEMAN, A. R., E. R. JACOBSON, AND R. E. RASKIN. 1992. Morphologic and cytochemical characteristics of blood cells from the desert tortoise (Gopherus agassizii). American Journal of Veterinary Research 53: 1645–1651. BARBOZA, P. S. 1995. Digesta passage and functional anatomy of the digestive tract in the desert tortoise (Xerobates agassizii). Journal of Comparative Physiology 165: 193–202. BAZE, W. B., AND F. R. HORNE. 1970. Ureogenesis in chelonia. Comparative Biochemistry and Physiology 34: 91–100. BENNETT, P. M., S. C. GASCOYNE, M. G. HART, J. K. KIRKWOOD, AND C. M. HAWKEY. 1991. Development of LYNX: a computer application for disease diagnosis and health monitoring in wild mammals, birds and reptiles. The Veterinary Record 128: 496–499. BERRY, K. H. 1997. Demographic consequences of disease in two desert tortoise populations in California, USA. In Proceedings: Conservation, Restoration, and Management of Tortoises and Turtles, An International Conference. J. Van Abbema (ed.). Wildlife Conservation Society Turtle Recovery Program and the New York Turtle and Tortoise Society, New York, New York, pp. 91– 99. BLAKEY, C. S. G., AND J. K. KIRKWOOD. 1995. Body mass to length relationships in chelonia. The Veterinary Record 136: 566–568. BOLTEN, A. B., AND K. A. BJORNDAL. 1992. Blood profiles for a wild population of green turtles (Chelonia mydas) in the southern Bahamas: sizespecific and sex-specific relationships. Journal of Wildlife Diseases 28: 407–413. , E. R. JACOBSON, AND K. A. BJORNDAL. 1992. Effects of anticoagulant and autoanalyzer on blood biochemical values of loggerhead sea turtles (Caretta caretta). American Journal of Veterinary Research 53: 2224–2227. BROWN, M. B., I. M. SCHUMACHER, P. A. KLEIN, K. HARRIS, T. CORRELL, AND E. R. JACOBSON. 1994. Mycoplasma agassizii causes upper respiratory tract disease in the desert tortoise. Infection and Immunity 62: 4580–4586. , K. H. BERRY, I. M. SCHUMACHER, K. A. NAGY, M. M. CHRISTOPHER, AND P. A. KLEIN. 1999. Seroepidemiology of upper respiratory tract disease in the desert tortoise. Journal of Wildlife Diseases 35: In press. BURGE, B. L., AND W. G. BRADLEY. 1976. Population density, structure, and feeding habits of the desert tortoise (Gopherus agassizii), in a low desert study area of southern Nevada. In Proceedings of the Desert Tortoise Council Symposium, N. J. Engberg, S. Allan, and R. L. Young, (eds.). Desert Tortoise Council, Long Beach, California, pp. 51–74.
236
JOURNAL OF WILDLIFE DISEASES, VOL. 35, NO. 2, APRIL 1999
BURTIS, C. A., AND E. R. ASHWOOD. 1994. Tietz textbook of clinical chemistry, 2nd edition. W. B. Saunders, Philadelphia, Pennsylvania, 2326 pp. CAMPBELL, T. 1988. Avian hematology and cytology. Iowa State University Press, Ames, Iowa, 101 pp. CHRISTOPHER, M. M., R. BRIGMON, AND E. JACOBSON. 1994. Seasonal alterations in plasma b-hydroxybutyrate and related biochemical parameters in the desert tortoise (Gopherus agassizii). Comparative Biochemistry and Physiology 108A: 303–310. , K. NAGY, C. PETERSON, B. T. HENEN, M. A. WILSON, J. LONGMATE, AND E. R. JACOBSON. 1992. Laboratory health profiles of free-ranging desert tortoises in California: Use of clinicopathologic data in the evaluation of physiologic and pathologic alterations (May 1989–March 1990). Report to U.S. Department of the Interior, Bureau of Land Management, Contract No. B950C1-0060, Riverside, California, 125 pp. , , I. WALLIS, AND K. H. BERRY. 1997. Laboratory health profiles of desert tortoises in the Mojave Desert: a model for health status evaluation of chelonian populations. In Proceedings: Conservation, Restoration, and Management of Tortoises and Turtles, An International Conference. J. Van Abbema (ed.). Wildlife Conservation Society Turtle Recovery Program and the New York Turtle and Tortoise Society, New York, New York, pp. 76–82. DANTZLER, W. H., AND B. SCHMIDT-NEILSEN. 1966. Excretion in fresh-water turtle (Pseudemys scripta) and desert tortoise (Gopherus agassizii). American Journal of Physiology 2110: 198–210. DESSAUER, H. C. 1974. Plasma proteins of reptilia. In Chemical zoology, Vol. 9. M. Florkin and B. T. Scheer (eds). Academic Press, New York, New York, pp. 187–216. DICKINSON, V. M., T. DUCK, C. R. SCHWALBE, AND J. L. JARCHOW. 1995. Health studies of freeranging Mojave Desert tortoises in Utah and Arizona. Arizona Game and Fish Department Research Branch Technical Report No. 21, Phoenix, Arizona, 70 pp. , J. L. JARCHOW, AND M. H. TRUEBLOOD. 1996. Health studies of free-ranging Sonoran Desert tortoises in Arizona. Arizona Game and Fish Department Research Branch Technical Report No. 24, Phoenix, Arizona 79 pp. DUNCAN, J. R., K. W. PRASSE, AND E. MAHAFFEY. 1994. Veterinary laboratory medicine: clinical pathology. Iowa State University Press, Ames, Iowa, 300 pp. FISH AND WILDLIFE SERVICE. 1994. Desert tortoise (Mojave population) recovery plan. U.S. Fish and Wildlife Service, Portland, Oregon. 73 pp. GERMANO, D. J. 1992. Longevity and age-size relationships of populations of desert tortoises. Copeia 1992: 367–374. GILLES-BALLIEN, M. 1973. Seasonal variations and
osmoregulation in the red blood cells of the diamondback terrapin Malaclemys centrata centrata (Latreille). Comparative Biochemistry and Physiology 46A: 505–512. GOTTDENKER, N. L., AND E. R. JACOBSON. 1995. Effect of venipuncture sites on hematologic and clinical biochemical values in desert tortoises. American Journal of Veterinary Research 56: 19– 21. HART, M. G., H. J. SAMOUR, D. M. J. SPRATT, B. SAVAGE, AND C. M. HAWKEY. 1991. An analysis of haematological findings on a feral population of Aldabra giant tortoises (Geochelone gigantea). Comparative Haematology International 1: 145– 149. HAWKEY, C. M., AND T. B. DENNETT. 1989. Comparative veterinary hematology. Iowa State University Press, Ames, Iowa, 192 pp. HENEN, B. T. 1994. Seasonal and annual energy and water budgets of female desert tortoises (Xerobates agassizii) at Goffs, California. Ph.D. Dissertation. University of California, Los Angeles, California, 198 pp. . 1997. Seasonal and annual energy budgets of female desert tortoises (Gopherus agassizii). Ecology 78: 283–296. JACKSON, O. F. 1980. Weight and measurement data on tortoises (Testudo graeca and Testudo hermanni) and their relationship to health. Journal of Small Animal Practice 21: 409–416. JACOBSON, E. R. 1987. Reptiles. Veterinary Clinics of North America 17: 1203–1225. , J. M. GASKIN, M. B. BROWN, R. K. HARRIS, C. H. GARDINER, J. L. LAPOINTE, H. P. ADAMS, AND C. REGGIARDO. 1991. Chronic upper respiratory tract disease of free-ranging desert tortoises (Xerobates agassizii). Journal of Wildlife Disease 27: 296–316. , J. SCHUMACHER, AND M. E. GREEN. 1992. Field and clinical techniques for sampling and handling blood for hematologic and selected biochemical determinations in the desert tortoise, Xerobates agassizii. Copeia 1992: 237–241. , M. WEINSTEIN, K. BERRY, B. HARDENBROOK, C. TOMLINSON, AND D. FREITAS. 1993. Problems with using weight versus carapace length relationships to assess tortoise health. The Veterinary Record 132: 222–223. , T. J. WRONSKI, J. SCHUMACHER, C. REGGIARDO, AND K. H. BERRY. 1994. Cutaneous dyskeratosis in free-ranging desert tortoises, Gopherus agassizii, in the Colorado desert of southern California. Journal of Zoo and Wildlife Medicine 25: 68–81. JENNINGS, W. B. 1993. Foraging ecology of the desert tortoise (Gopherus agassizii) in the western Mojave Desert. M.S. Thesis, University of Texas, Austin, Texas, 89 pp. KAPLAN, L. A., AND A. J. PESCE. 1996. Clinical chemistry: theory, analysis, and correlation, 3rd
CHRISTOPHER ET AL.—HEMATOLOGIC AND BIOCHEMICAL VALUES OF FREE-RANGING DESERT TORTOISES
edition. Mosby Inc., St. Louis, Missouri, 1211 pp. LANCE, V. A. 1990. Stress in reptiles. In Progress in coparative endocrinology, E. A. Epple, C. G. Scones, and M. H. Stetson (eds.). Wiley–Liss, New York, New York, pp. 461-466. . 1994. Life in the slow lane: hormones, stress, and the immune system in reptiles. In Perspectives in Comparative Endocrinology, K. G. Davey, R. E. Peter, and S. S. Loke (eds.). National Research Council of Canada, Ottawa, Canada, pp. 529–534. LAWRENCE, K. 1987. Seasonal variation in blood biochemistry of long-term captive Mediterranean tortoises (Testudo graeca and Testudo hermanni). Research in Veterinary Science 43: 379–383. , AND C. M. HAWKEY. 1986. Seasonal variations in haematological data from Mediterranean tortoises (Testudo graeca and Testudo hermanni) in captivity. Research in Veterinary Science 40: 225–230. LUMSDEN, J. H. 1978. On establishing reference values. Canadian Journal of Comparative Medicine 42: 293–301. MARTIN, H. F., B. J. GUDZINOWICZ, AND H. FANGER. 1975. Normal values in clinical chemistry: a guide to statistical analysis of laboratory data. Marcel Dekker, Inc., New York, New York, 504 pp. MAUTINO, M., AND C. D. PAGE. 1993. Biology and medicine of turtles and tortoises. Veterinary Clinics of North America 23: 1251–1270. MEDICA, P. A., R. B. BURY, AND R. A. LUCKENBACH. 1980. Drinking and construction of water catchments by the desert tortoise, Gopherus agassizii, in the Mojave Desert. Herpetologica 36: 301– 304. MEIENBERGER, C., I. R. WALLIS, AND K. A. NAGY. 1993. Food intake rate and body mass influence transit time and digestibility in the desert tortoise (Xerobates agassizii). Physiological Zoology 66: 847–862. MINNICH, J. E. 1977. Adaptive responses in the water and electrolyte budgets of native and captive desert tortoises, Gopherus agassizi, to chronic drought. In Proceedings of the Desert Tortoise Council Symposium, K. B. Berry, (ed.). Desert Tortoise Council, San Diego, California, pp. 102– 109. MONTALI, R. J. 1988. Comparative pathology of inflammation in the higher vertebrates. Journal of Comparative Pathology 99: 1–26. NAGY, K. A., AND P. A. MEDICA. 1986. Physiological ecology of desert tortoises in southern Nevada. Herpetologica 42: 73–92. NATIONAL OCEANIC AND ATMOSPHERIC ADMINISTRATION (NOAA). 1989–1995. Climatological data for California, Vols. 93–99, National Climatic Data Center, Asheville, North Carolina, 572, 588, 578, 573, 576, 582, and 731 pp., respectively.
237
O’CONNOR, M. P., J. S. GRUMBLES, R. H. GEORGE, L. C. ZIMMERMAN, AND J. R. SPOTILA. 1994. Potential hematologic and biochemical indicators of stress in free-ranging desert tortoises and captive tortoises exposed to a hydric stress gradient. Herpetological Monographs. 8: 5–26. OFTEDAL, O. T., M. E. ALLEN, AND T. E. CHRISTOPHER. 1996. Dietary potassium affects food choice, nitrogen retention and growth of desert tortoises. In Proceedings of the Desert Tortoise Council Symposium, K. B. Berry, (ed.). Desert Tortoise Council, San Diego, California, pp. 58– 61. PETERSON, C. C. 1994. Different rates and causes of high mortality in two populations of the threatened desert tortoise Gopherus agassizii. Biological Conservation 70: 101–108. . 1996a. Anhomeostasis: seasonal water and solute relations in two populations of the desert tortoise (Gopherus agassizii) during chronic drought. Physiological Zoology 69: 1324–1358. . 1996b. Ecological energetics of the desert tortoise (Gopherus agassizii): effects of rainfall and drought. Ecology 77: 1831–1844. ROSSKOPF, W. J. 1982. Normal hemogram and blood chemistry values for California desert tortoises. Veterinary Medicine/Small Animal Clinician 77: 85–87. ROSTAL, D. C., V. A. LANCE, J. S. GRUMBLES, AND A. C. ALBERTS. 1994. Seasonal reproductive cycle of the desert tortoise (Gopherus agassizii) in the eastern Mojave desert. Herpetological Monographs 8: 72–82. ROWLANDS, P. G. 1995. Regional bioclimatology of the California desert. In The California desert: an introduction to natural resources and man’s impact, Volume 1. J. Latting and P. G. Rowlands (eds.). June Latting Books, Riverside, California, pp. 95–134. SAAD, A. H. 1988. Corticosteroids and immune systems of non-mammalian vertebrates: a review. Developmental Comparative Immunology 12: 281–494. , AND R. EL RIDI. 1988. Endogenous corticosteroids mediate seasonal cyclic changes in immunity of lizards. Immunobiology 177: 390–403. SAMOUR, J. H., C. M. HAWKEY, S. PUGSLEY, AND D. BALL. 1986. Clinical and pathological findings related to malnutrition and husbandry in captive giant tortoises (Geochelone species). The Veterinary Record 118: 299–302. SCHUMACHER, I. M., M. B. BROWN, E. R. JACOBSON, B. R. COLLINS, AND P. A. KLEIN. 1993. Detection of antibodies to a pathogenic mycoplasma in desert tortoises (Gopherus agassizii) with upper respiratory tract disease. Journal of Clinical Microbiology 31: 1454–1460. SPRATT, D. M. J. 1990. ‘‘Jackson’s ratio’’ and the Aldabra giant tortoise (Geochelone gigantea). The Veterinary Record 127: 262–263.
238
JOURNAL OF WILDLIFE DISEASES, VOL. 35, NO. 2, APRIL 1999
TAYLOR, R. W., AND E. R. JACOBSON. 1982. Hematology and serum chemistry of the gopher tortoise, Gopherus polyphemus. Comparative Biochemistry and Physiology 72A: 425–428. TURNER, F. B., P. HAYDEN, B. L. BURGE, AND J. B. ROBERSON. 1986. Egg production by the desert tortoise (Gopherus agassizii) in California. Herpetologica 42: 92–104.
, AND D. C. RANDALL. 1989. Net production by shrubs and winter annuals in Southern Nevada. Journal of Arid Environments 17: 23–26. WOODBURY, A. M., AND R. HARDY. 1948. Studies of the desert tortoise, Gopherus agassizii. Ecological Monographs 18: 146–200. Received for publication 22 September 1997.