Reference photon dosimetry data and reference phase space data for the 6 MV photon beam from Varian Clinac 2100 series linear accelerators Sang Hyun Cho, Oleg N. Vassiliev, Seungsoo Lee, H. Helen Liu, Geoffrey S. Ibbott, and Radhe Mohan Citation: Medical Physics 32, 137 (2005); doi: 10.1118/1.1829172 View online: http://dx.doi.org/10.1118/1.1829172 View Table of Contents: http://scitation.aip.org/content/aapm/journal/medphys/32/1?ver=pdfcov Published by the American Association of Physicists in Medicine
Reference photon dosimetry data and reference phase space data for the 6 MV photon beam from Varian Clinac 2100 series linear accelerators Sang Hyun Cho,a) Oleg N. Vassiliev, Seungsoo Lee, H. Helen Liu, Geoffrey S. Ibbott, and Radhe Mohan Department of Radiation Physics, The University of Texas M. D. Anderson Cancer Center, 1515 Holcombe Boulevard, Unit 547, Houston, Texas 77030
(Received 5 January 2004; revised 15 October 2004; accepted for publication 15 October 2004; published 20 December 2004) The current study presents the reference photon dosimetry data (RPDD) and reference phase space data (RPSD) for the 6 MV photon beam from Varian 2100 series linear accelerators. The RPDD provide the basic photon dosimetry data, typically collected during the initial commissioning of a new linear accelerator, including output factors, depth dose data, and beam profile data in air and in water. The RPSD provide the full phase space information, such as position, direction, and energy for each particle generated inside the head of any particular linear accelerator in question. The dosimetric characteristics of the 6 MV photon beam from the majority of the aforementioned accelerators, which are unaltered from the manufacturer’s original specifications, can be fully described with these two data sets within a clinically acceptable uncertainty 共⬃ ± 2 % 兲. The current study also presents a detailed procedure to establish the RPDD and RPSD using measured data and Monte Carlo calculations. The RPDD were constructed by compiling our own measured data and the average data based on the analysis of more than 50 sets of measured data from the Radiological Physics Center (RPC) and 10 sets of clinical dosimetry data obtained from 10 different institutions participating in the RPC’s quality assurance monitoring program. All the measured data from the RPC and the RPC-monitored institutions were found to be within a statistically tight range (i.e., 1 ⬇ 1% or less) for each dosimetric quantity. The manufacturer’s standard data, except for in-air off-axis factors that are available only from the current study, were compared with the RPDD, showing that the manufacturer’s standard data could also be used as the RPDD for the photon beam studied in this study. The RPSD were obtained from Monte Carlo calculations using the BEAMnrc/ DOSXYZnrc code system with 6.2 MeV (a spread of 3% full width at half maximum) and 1.0 mm full width at half maximum as the values of the energy and radial spread of a Gaussian electron pencil beam incident on the target, respectively. The RPSD were capable of generating Monte Carlo data that agreed with the RPDD within the acceptance criteria adopted in the current study (e.g., 1% or 1 mm for depth dose). A complete set of the RPDD and RPSD from the current study is available from the RPC website (http://rpc.mdanderson.org) or via mass storage media such as DVD or CD-ROM upon request. © 2005 American Association of Physicists in Medicine. [DOI: 10.1118/1.1829172] Key words: reference photon dosimetry data, reference phase space data, 6 MV photon beam, Monte Carlo calculations I. INTRODUCTION The modern computer-controlled linear accelerators for radiation therapy are becoming more reproducible, in terms of their structures and dosimetric characteristics, as long as the make and model of the machines are identical.1,2 Consequently, dosimetry data commonly applicable for linear accelerators of the same make, model, and nominal energy may exist. The availability of such data will significantly benefit a wide range of radiation oncology and medical physics practices. As discussed elsewhere,2 some of the possible benefits and applications include the simplification of photon beam commissioning, the creation of generic beam models for model-based and/or Monte Carlo-based dose calculation algorithms, and the generation of the standard photon dosimetry data for the quality assurance (QA) of nationwide clinical trials. 137
Med. Phys. 32 (1), January 2005
Although no serious attempt has been made to establish commonly applicable dosimetry data, some manufacturers of linear accelerators have established their own standard dosimetry data for their recent models,3 which may be used for cross-checking of each user’s measured dosimetry data. Due to lack of investigation, however, it is uncertain at this time how closely these standard data match each institution’s measured dosimetry data. Clearly, any investigation on the common applicability of the manufacturers’ standard dosimetry data is not a trivial task, because it requires a multiinstitutional effort and needs to be coordinated in such a way that the consistency in measurement techniques and data analysis could be maintained. Over the last few years, some investigators adopted the Monte Carlo method to characterize photon beams from
0094-2405/2005/32(1)/137/12/$22.50
© 2005 Am. Assoc. Phys. Med.
137
138
Cho et al.: Reference photon dosimetry data for 6 MV photon beam
medical linear accelerators of the same make, model, and nominal energy.3–10 However, it seems difficult to extract generic beam models from their work, due to some variations in the results among the studies and, often, insufficient amounts of data presented. Some of these variations were partly due to the measured data (e.g., depth dose data) used during the Monte Carlo modeling of linear accelerators. As a result, it is unclear at this time whether or not the Monte Carlo beam models studied so far can be used to generate a commonly applicable dosimetry data set for linear accelerators of the same make, model, and nominal energy. In the meantime, Cho and Ibbott2 showed in their recent preliminary study that the similarity in the dosimetric characteristics between machines could be quantified by establishing the standard dosimetry data for each make, model, and nominal energy. This preliminary study suggested that the dosimetry data needed to establish such standard data might be obtained from the Radiological Physics Center (RPC) at M. D. Anderson Cancer Center, which has been accumulating a consistently measured set of dosimetry data through its on-site dosimetry audit program. A similar approach was also taken in the past, especially by the American Association of Physicists in Medicine (AAPM) Task Group 46 to establish some standard dosimetry data, although no task group report has ever been published. Cho and Ibbott’s study further demonstrated that the overall dosimetric characteristics of the machines with the same make, model, and nominal energy could be described by a single dosimetry data set within a clinically acceptable tolerance level 共⬃ ± 2 % 兲. The same study also pointed out that the concept of common dosimetry data could be valid, at least for photon beams whose dosimetric characteristics are generally less sensitive to minute changes in the machine structure than those for electron beams. In addition, the study suggested that the use of the Monte Carlo method would be necessary to complement measurements, because it might be difficult to establish such commonly applicable dosimetry data, referred to as the reference photon dosimetry data (RPDD), entirely based on the RPC-measured dosimetry data. The definition of the RPDD is presented in Sec. II, along with the definition of the reference phase space data (RPSD). A major project is currently being planned at the RPC to establish the RPDD and RPSD for the most common medical linear accelerators. The current study was conducted as a pilot study for this project. The main goal of the current study was to establish the RPDD and RPSD for the 6 MV photon beam from the most popular dual photon energy linear accelerator model, the Varian Clinac 2100 series (including all variations of this model such as C, C/D, and 21EX). A secondary goal was to demonstrate the feasibility and effectiveness of the approaches adopted in the current study to achieve the main goal. The basic photon dosimetry data (i.e., RPDD), typically collected during the commissioning of a new accelerator, were determined for the 6 MV photon beam. Also, the phase space files (i.e., RPSD) corresponding to these dosimetry data were generated by the Monte Carlo calculations. The entire study was conducted following the Medical Physics, Vol. 32, No. 1, January 2005
138
approaches described in Sec. II. The detailed data and phase space files are available from the RPC website (http:// rpc.mdanderson.org) or via mass storage media such as DVD or CD-ROM upon request. II. METHODS AND MATERIALS A. Definitions
1. Definitions of the RPDD and the RPSD The RPDD are defined as a set of photon dosimetry data by which the dosimetric characteristics of any linear accelerator with the same make, model, and nominal energy can be described within a clinically acceptable uncertainty 共⬃ ± 2 % 兲. These data are for reference only and not meant to replace the clinical data. Also, the RPDD may not be applicable for those machines significantly modified from the manufacturers’ original specifications. Therefore, we may alternatively define the RPDD as a set of photon dosimetry data for a generic linear accelerator of a particular make, model, and nominal energy. Accordingly, the RPSD for each generic linear accelerator can be defined as a data set that provides the full phase space information, such as position, direction, and energy for each particle generated inside the head of a linear accelerator. The RPDD may include typical basic photon dosimetry data closely related with the structures of a linear accelerator head. Therefore, the RPDD would include depth dose data, output factor, and beam profile data in water and in air. Photon dosimetry data related with accessories such as wedge factors are to be excluded from the RPDD for the sake of simplicity, even if one might be able to observe a similar standard behavior as seen for other basic dosimetry data. Similarly, no data related with a physical wedge mounted inside the linear accelerator head (e.g., universal wedge) will be considered for the RPDD. However, these data might be presented as some ancillary data to the RPDD, if available. The RPSD can be used as input data for the Monte Carlo simulation to generate the RPDD and any other dosimetry data related with accessory devices such as multileaf collimators (MLC), dynamic wedges, etc.
2. Definitions of variables and dosimetric quantities The definitions of variables and dosimetric quantities used in this study are provided in the following. • Fractional depth dose (FDD) and percentage depth dose (PDD): FDD⫽(rdg at depth for FS along CAX/rdg at dmax for FS along CAX) PDD⫽FDD⫻100 where rdg: the meter reading of an ion chamber; FS: the field size of a given beam; CAX: the central axis of a given beam; dmax: the depth at which the absorbed dose in medium is maximum for a given beam. • Off-axis factor (OAF): OAF= rdg at off-axis distance/rdg at CAX Note OAF is usually defined for the largest field size available (e.g., 40⫻ 40 cm2 for photon beams), at a
139
Cho et al.: Reference photon dosimetry data for 6 MV photon beam
depth in a phantom or at the isocenter in air. All the in-air OAFs reported in this study were measured with farmer-type ionization chambers, at a source-toaxis distance (SAD) of 100 cm, with an appropriate plastic buildup cap for the 6 MV photon beam.2 • Output factor (OF): OF⫽[(rdg at dref for FS)/(FDD at dref for FS)]/[(rdg at dref for RFS)/(FDD at dref for RFS)] where dref: the reference depth for measurements in a phantom; RFS: the reference field size (RFS is normally a 10 ⫻ 10 cm2 field for photon beams.); other variables are as defined earlier. B. Creation of the RPDD by compilation of measured data
A set of the RPDD was created for the 6 MV photon beam from Varian Clinac 2100 series by compiling measured data from various sources. Basically, each entry in the RPDD was derived from the average data based on the analysis of measured data from the RPC and the institutions participating in the RPC’s QA monitoring program. When no such average data were available, measured data from the current study were entered into the RPDD.
1. The RPC-measured data Typical photon dosimetry data measured by the RPC staff physicists during an on-site dosimetry audit are OF, FDD, in-air OAF, and wedge factors. The RPC uses several models of popular Farmer-type cylindrical chambers and an identical model of electrometers for measurements in water and in air. Details about the RPC’s measurement techniques and instrumentation can be found elsewhere.2 The RPC has accumulated a sufficient number of data on the Varian Clinac 2100 series linear accelerators and, therefore, a statistical analysis on the data could reveal some similarity among photon dosimetry data. The RPC-measured FDD, OF, and in-air OAF data were extracted from the RPC database for a statistical analysis. At least 50 sets of the RPC-measured data were used to obtain the averages and standard deviations for each dosimetric characteristic at selected depth and field sizes or off-axis distances reported in this study. The RPC-measured data for each dosimetric quantity were sorted so that the maximum and minimum values could also be determined during this procedure.
2. Clinical data from the institutions participating in the RPC’s monitoring program The RPC-measured data were obtained from spotchecking of clinical data from the RPC-monitored institutions and, therefore, the final results (i.e., averages) were available only for selected depths, field sizes, and off-axis distances. As a complementary way to obtain the data corresponding to a wider range of field sizes and depths, 10 different sets of the data were extracted from the RPCmonitored institutions’ clinical data for the field sizes and depths unavailable from the RPC’s measurements. The instiMedical Physics, Vol. 32, No. 1, January 2005
139
tutions’ clinical data showed an acceptable statistical spread (i.e., 1 ⬇ 1% or less and max/min ratio of less than 4%). Each institution’s clinical data selected here were previously compared at selected depths and field sizes during the RPC’s spot-checking, showing agreement between the RPCmeasured and the RPC-monitored institution’s data, mostly better than ±1% and no worse than ±2% in any case. A similar agreement was assumed for the extracted data, although these data were not directly verified by the RPC’s measurements. In general, the basic dosimetry data corresponding to small (e.g., less than 6 ⫻ 6 cm2) and large field sizes (e.g., larger than 30⫻ 30 cm2) needed to be determined by this approach. Similar to the RPC-measured data, these data were used to determine the averages, standard deviations, and min/max for each dosimetric characteristic considered in this step.
3. Dosimetry data from in-house measurements and manufacturer More dosimetry data were needed to create a complete set of the RPDD for the 6 MV photon beam from Varian Clinac 2100 series because the average data determined in the above-noted steps were not as comprehensive as typical clinical data. Therefore, two more data sets, comprehensive depth dose (DD) data including the dose buildup region and in-water beam profiles, were extracted from our own beam commissioning data. These data were measured in a scanning water tank with a Wellhofer IC-10 chamber (6 mm inner diameter) on a Clinac 2100 C/D linear accelerator at M. D. Anderson Cancer Center that exhibits the same dosimetric characteristics as shown in the average data obtained in Secs. II B 1 and II B 2 (i.e., Tables I–III) within a typical measurement uncertainty 共⬃1 % 兲. The manufacturer’s standard data were also compared with our own measured data. The manufacturer’s standard data provide a comprehensive set of the basic dosimetry data (i.e., DD data, OF, and in-water beam profiles) for a wide range of field sizes and depths. The data are reported to be measured for the Clinac 21EX model in a scanning water tank using a IC-15 ionization chamber (6 mm inner diameter).3 The agreement between the manufacturer’s standard data and our own measured data was within 1% (or 1 mm where applicable). Therefore, these two data sets were considered to be identical within the measurement uncertainty and no separate comparison was made during the validation of the Monte Carlo beam model. Accordingly, the manufacturer’s standard data may substitute for the RPDD determined in this study, except for the in-air OAFs that are available only from the current study. C. Creation of the RPSD by Monte Carlo calculations
The Monte Carlo calculations to obtain the RPSD were conducted by the procedure shown in Fig. 1. The BEAMnrc/ 11–13 was used for the Monte Carlo calculaDOSXYZnrc code tions along with a model for the head of Varian Clinac 2100 series derived from detailed specifications provided by the manufacturer. The following structures were modeled: target,
140
Cho et al.: Reference photon dosimetry data for 6 MV photon beam
FIG. 1. Flow chart for the Monte Carlo simulation to generate the RPSD.
primary collimator, flattening filter, monitor chamber, upper (Y) and lower (X) jaws. The phase space data were collected at a plane located right below the lower jaws. The Monte Carlo output factors calculated using these phase space data did not properly take into account the effect of backscattered photons from the jaws to the monitor chamber. Since published literature14,15 provide correction factors for this effect for the linear accelerator model studied here, however, no further Monte Carlo simulation was performed in this study to derive separate correction factors. The calculated output factors from the current study were corrected using the results from Liu et al.14 The matching between the RPDD and Monte Carlo results was accomplished by varying only two transport parameters of the BEAMnrc/DOSXYZnrc code: the energy 共Ee兲 and the radial spread 共Re兲 of a Gaussian electron beam incident on the target. Other parameters, such as the densities of the target and flattening filter, were not allowed to vary, assuming the manufacturer’s material specifications were accurate. The manufacturer’s nominal value for Ee is 6.0 MeV with a Gaussian spread of 3% full width at half maximum (FWHM) and the nominal Re value is 1 mm FWHM.3,8 The adjustment of Ee and Re values was guided by an observation that the depth dose is strongly dependent on the choice of Ee value whereas so-called “horn” of in-water beam profile and in-air OAF are dependent on both Ee and Re values.3,6,8 For instance, the size of the horn increases as the Re value decreases. The same effect can also be seen as the Ee value decreases. During the data matching process, particle phase space data were generated using the BEAMnrc code for a 4 ⫻ 4 cm2 field, a reference field (i.e., 10⫻ 10 cm2), and the largest field available (i.e., 40⫻ 40 cm2). In addition, during the generation of phase space data for the largest field size, in-air OAFs at 100 cm SAD were also calculated following the approach described by Sheikh-Bagheri and Rogers.8 In detail, in-air OAFs were approximated as the ratios of waterkerma-weighted photon fluence between the central and concentric radial scoring bins. The water-kerma-weighted photon fluence was calculated by weighting each photon Medical Physics, Vol. 32, No. 1, January 2005
140
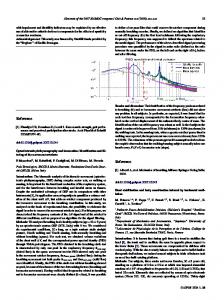
reaching the scoring plane located at 100 cm SAD by the product of its energy, the mass-absorption coefficient for water at that energy, and one over the cosine of the angle it makes with the z axis.8 The central scoring bin was a circular region with a radius of 2.5 cm and the subsequent radial scoring bins were 2.5-cm-wide annular regions located at 5, 10, and 15 cm from the center. The statistical uncertainty 共1 兲 for the calculated in-air OAF at each off-axis distance was less than 0.5%. The uncertainty associated with the central bin was added in quadrature to that associated with each subsequent bin during the normalization of the data. After phase space data were obtained, DD data and inwater beam profiles for the above-mentioned field sizes at 100 cm source-to-surface distance (SSD) were calculated using the DOSXYZnrc code. All the calculated data including in-air OAFs were compared with the RPDD to check if a match was found. In-water beam profiles were compared at least at dmax and several other clinically useful depths (e.g., 3, 5, 10 cm, etc.). The whole procedure was repeated until a match between Monte Carlo data and RPDD was found. The following agreement levels were used as the matching criteria. (a)
Depth dose • Dose fall-off region (between dmax and 30 cm depth): within 1% of measured local dose for the majority 共⬃95% 兲 of the data points and no worse than 1.5% in any case • Dose buildup region: within 1 mm of measured depth dose curve or within 3% of measured local dose
(b)
In-water beam profiles: • Plateau region: within 2% of measured profile • Penumbra region: within 2 mm of measured profile
(c)
Output factor and in-air off-axis factor: within 1% of measured value
The above criteria are better than or at least comparable to those used for validating beam models of model-based radiation treatment planning systems.16,17 The BEAMnrc calculations were first started with the manufacturer’s nominal Ee and Re values, followed by DOSXYZnrc calculations. Then, the BEAMnrc/DOSXYZnrc calculations were repeated for a number of times using the values from other groups’ work such as Sheikh-Bagheri and Rogers8 and Keall et al.3 The results from these initial calculations indicated that an optimum pair of values could be found around the values reported by Keall et al. (i.e., 6.2 MeV and 1.3 mm FWHM), considering the matching criteria and dosimetry data used in this study. A further attempt to find a more optimum pair of values was made and resulted in a pair of values, 6.2 MeV and 1.0 mm FWHM, that produced the match within the criteria used in this study across the field sizes ranging from 4 ⫻ 4 to 40⫻ 40 cm2. These values generally produced a better agreement for beam profiles, especially for a 40⫻ 40 cm2 field, than the values reported by
141
Cho et al.: Reference photon dosimetry data for 6 MV photon beam
Keall et al. and provide some similarity to the values from manufacturer and published literature (see Table IV). All the RPSD in this study were generated using these values. The Monte Carlo calculations were done on a dual processor machine equipped with two 2.4 GHz Xeon® processors running Redhat® Linux 8.0. The electron and photon cutoff energies, AE/ECUT and AP/PCUT, were chosen as 0.7 and 0.01 MeV, respectively. The selective bremsstrahlung splitting parameters were Nmin = 20, Nmax = 200, R f = 50 (for a 40⫻ 40 cm2 field), and Russian Roulette was switched off. The photon forcing option was not used and the range rejection was turned on with ESAVE= 0.7 MeV for the target region and ESAVEគ GLOBAL= 1.0 MeV for the rest of the linear accelerator head. The definitions and descriptions for the BEAMnrc/DOSXYZnrc parameters are omitted here for the sake of brevity and can be found elsewhere.11–13 The size of scoring voxels during the DOSXYZnrc simulation varied between 1.0⫻ 1.0⫻ 0.2 cm3 and 1.0⫻ 1.0 ⫻ 1.0 cm3, depending on the spatial resolution required. Usually, a smaller voxel size was chosen for the depth dose buildup region and the beam penumbra region. The size of the water phantom for the DOSXYZnrc simulation was 50 ⫻ 50⫻ 50 cm3. The total number of histories for the Monte Carlo calculations varied depending on each situation. For example, the number of histories for generating a phase space file and DD data for a 10⫻ 10 cm2 field were on the order of 108 and 109, respectively. During the DOSXYZnrc simulation, the phase space sources were recycled many times (up to eight times) for the most cases to obtain acceptable statistical uncertainty. According to Walters et al.,18 the recycling of phase space sources is accurately reflected in the uncertainty estimation of photon beam simulation. When the phase space source was restarted more than once, the DOSXYZnrc simulation was repeated after adjusting a parameter, NRCYCL, by taking into account the number of missing and rejected particles during the previous run, to avoid an underestimation of the uncertainty.13,18 The typical CPU time on a 2.4 GHz Xeon® processor for the generation of phase space files was about 2 ms per history, whereas it took about 70 s per history on average for the simulation in water. The statistical uncertainty 共1兲 was mostly less than 0.5% and no worse than 0.7% for the CAX depth dose simulation. For in-water beam profile simulation, it was generally less than 1% except for a few data points outside the beam penumbra region. These values were better than typical measurement uncertainties and approximately half of the values used for the acceptance criteria adopted during the data matching process (e.g., 1% or 2%).
TABLE I. The RPC-measured in-air OAF for the 6 MV photon beam from Varian Clinac 2100 series accelerators. The statistical analysis was performed with 216 RPC-measured data sets. The RPC data presented have been chosen as the RPDD in the current study. The standard deviation (s.d.) is 1 associated with the sample. The data from Monte Carlo (MC) calculations are also presented. The statistical uncertainty 共1兲 of each MCcalculated OAF is less than 0.5%. OAF (RPC)
s.d. (RPC)
Max (RPC)
Min (RPC)
OAF (MC)
MC/RPC
5 10 15
1.030 1.042 1.055
0.0070 0.0095 0.0114
1.049 1.061 1.078
1.001 1.015 1.029
1.027 1.036 1.056
0.997 0.994 1.001
B. Output factor
The reference photon output factors determined from a statistical analysis of measured data from the RPC and the RPC-monitored institutions are presented in Table II. The maximum and minimum values vary within 4% for all the field sizes. The standard deviation 共1兲 was always less than 1%, showing an overall statistical tightness in the sample. The statistical characteristics in the RPC-measured data can also be seen in a scatter plot (Fig. 2). Figure 3 presents a comparison between the data from Table II and Monte Carlo TABLE II. The 6 MV photon beam output factor at dmax, 100 cm SSD, for Varian Clinac 2100 series linear accelerators. The statistical analysis was performed with more than 150 RPC-measured data sets and 10 RPCmonitored institutions’ clinical data sets. Outliers that deviated more than ±4 were discarded during the analysis. The number of such outliers was two and four for 20⫻ 20 cm2 and 30⫻ 30 cm2 fields, respectively. The data presented have been chosen as the RPDD in the current study. The standard deviation (s.d.) is 1 associated with the sample.
A. In-air off-axis factor
Medical Physics, Vol. 32, No. 1, January 2005
Off-axis distance (cm)
the difference between the maximum and minimum values at each off-axis point was up to about 5%, slightly more than that for FDD and OF data. The largest standard deviation 共1兲 associated with the sample was about 1%. Considering a very small standard deviation associated with a fairly large amount of data points (i.e., 216 at each off-axis point), an overall statistical tightness in the sample is deemed well demonstrated. Table I also shows that the Monte Carlo data are in agreement with the RPC-measured data better than 1%. The results presented in Table I are in-air OAF and may not be identical to in-water OAF (or off axis ratio), primarily due to the difference in scatter condition between water and air.
III. RESULTS
Although the beam profiles measured in water are more clinically relevant, in-air beam profiles are also known to be useful for deriving the characteristics of electron pencil beam incident on the target in the head of a linear accelerator.8 In Table I, the reference data from the analysis of the RPCmeasured in-air OAF are presented. As shown in this table,
141
a
Field size 共cm2兲
Output factor
s.d.
Max
Min
4 ⫻ 4a 6⫻6 10⫻ 10 15⫻ 15 20⫻ 20 30⫻ 30 40⫻ 40a
0.923 0.957 1.000 1.032 1.053 1.080 1.099
0.0074 0.0046 ¯ 0.0042 0.0051 0.0063 0.0101
0.937 0.971 ¯ 1.046 1.066 1.100 1.108
0.913 0.945 ¯ 1.020 1.039 1.061 1.075
Based on clinical data from the institutions monitored by the RPC.
142
Cho et al.: Reference photon dosimetry data for 6 MV photon beam
142
FIG. 2. A scatter plot of the RPC-measured 6 MV photon output factor at 100 cm SSD, dmax for Varian Clinac 2100 series linear accelerators.
calculations, showing agreement within 1% when the Monte Carlo calculated output factors were corrected using the results from Liu et al.14 C. Depth dose
The reference photon PDD data at selected depths and field sizes are presented in Table III along with the standard
deviations associated with the sample. Similar to OF, the data were obtained from the RPC and the RPC-monitored institutions. As seen in Table III, the standard deviation is less than about 1%, suggesting that the 6 MV depth dose (DD) characteristic changes very little between machines. In Fig. 4, a scatter plot of the RPC-measured data is shown for a 6 ⫻ 6 cm2 field at selected depths. In Fig. 5, the depth dose
FIG. 3. Comparison between measured and Monte Carlo (MC) calculated output factors for the 6 MV photon beam at dmax, 100 cm SSD, for Varian Clinac 2100 series linear accelerators. “RPDD/RPC data” means that the presented RPC data have been chosen as the RPDD in the current study. “MC-corrected” denotes MC data corrected by applying the results from Ref. 14. The error bars represent 1 associated with the data. Medical Physics, Vol. 32, No. 1, January 2005
143
Cho et al.: Reference photon dosimetry data for 6 MV photon beam
143
TABLE III. Reference photon dosimetry data: PDD at selected depths for the 6 MV photon beam from Varian Clinac 2100 series.a Physical/ effective depth (cm)
4⫻4 cm2
s.d.
6⫻6 cm2
s.d.
10⫻ 10 cm2
s.d.
20⫻ 20 cm2
s.d.
30⫻ 30 cm2
s.d.
40⫻ 40 cm2
s.d.
5.0/ 4.8 10.0/ 9.8 15.0/ 14.8 20.0/ 19.8
84.39 62.55 46.22 34.31
0.213 0.227 0.297 0.296
85.78 64.63 48.24 36.05
0.699 0.547 0.515 0.463
86.90 67.22 51.18 38.80
0.473 0.411 0.419 0.409
87.96 70.15 55.06 42.82
0.553 0.428 0.419 0.377
88.33 71.55 56.99 45.24
0.236 0.232 0.463 0.232
88.64 72.28 57.94 46.25
0.135 0.312 0.470 0.498
The data for 4 ⫻ 4 cm2, 30⫻ 30 cm2, and 40⫻ 40 cm2 are based on the 10 different institutions’ clinical data. The rest of the data are based on at least 50 sets of the RPC-measured data. The standard deviation (s.d.) is 1 associated with the sample. About 2 mm shift, approximately 0.6rcav for typical farmer chambers that the RPC uses, is applied to the physical depth to obtain the effective depth.
a
data from Monte Carlo calculations are compared with the data from Table III and ionization chamber measurements. The data are normalized at 10 cm depth for a 10⫻ 10 cm2 field. Also, the measured DD data are shifted, by 0.6 times the radius of the ionization cavity (i.e., 0.6rcav ⬇ 2 mm for an IC-10 chamber), to the effective point of measurements, following the recommendation of the TG-51 report.19 Figure 6 presents a detailed comparison between Monte Carlo and measured data, showing agreement within the matching criteria for DD data. Similar to a well-known problem in DD matching over the dose buildup region for higher energy (e.g., 18 MV) and large field sizes,3,6,20 the agreement for a 40⫻ 40 cm2 field was relatively poor as compared to that for smaller field sizes (e.g., 4 ⫻ 4 cm2, 10⫻ 10 cm2, etc.). However, agreement within 1 mm appears to be achievable, at least for the 6 MV photon beam, according to the current results. Note that no comparison at the depths less than 0.5 cm was made because the ionization chamber used in the
current study might not be suitable for accurate depth dose measurements over such a region. Further discussion on this issue is beyond the scope of the current study and, as a result, the RPDD from the current study do not include DD data for the depth less than 0.5 cm. D. Beam profiles in water
In Figs. 7 and 8, in-water profiles for the 6 MV photon beam obtained from Monte Carlo calculations and measurements are compared at various depths and field sizes. As seen in these figures, Monte Carlo data agreed with measured data within 2% in a flat region or within 2 mm in the penumbra region. E. Optimum values for Ee and Re
The current study determined the two key parameters for the BEAMnrc simulation, Ee and Re, as shown in Table IV.
FIG. 4. A scatter plot of the RPC-measured 6 MV photon depth dose data for a 6 ⫻ 6 cm2 field from Varian Clinac 2100 series linear accelerators. Medical Physics, Vol. 32, No. 1, January 2005
144
Cho et al.: Reference photon dosimetry data for 6 MV photon beam
144
FIG. 5. The 6 MV photon depth dose curves for various field sizes at 100 cm SSD. “MC” denotes the data from Monte Carlo calculations. The ionization chamber-measured DD are shifted to the effective point of measurements by 0.6rcav 共⬃2 mm兲. The statistical uncertainty 共1兲 of MC data are comparable to the size of the symbols. The size of the symbol for the “RPDD/RPC data” is exaggerated for a better visibility, compared to that for other data points.
The results from published literature are also shown in this table for comparison. The value of Ee determined from the current study is the same as that found by two previous studies,3,6 while the value of Re for a Gaussian beam varies
between 1 and 2 mm among the listed studies. The variation in Ee and Re could be due to a number of factors such as difference in measured data used for the Monte Carlo modeling, possible difference in the computational model of the
FIG. 6. Difference between calculated and measured local doses. The percent differences are given as 关共Monte Carlo-measured兲 / 共measured兲兴 ⫻ 100. Medical Physics, Vol. 32, No. 1, January 2005
145
Cho et al.: Reference photon dosimetry data for 6 MV photon beam
145
FIG. 7. The 6 MV photon beam profiles in water for a 4 ⫻ 4 cm2 field at 3.0 cm depth and 10⫻ 10 cm2 field at 1.5 cm depth. The profiles are presented along the direction of X-jaw for a 4 ⫻ 4 cm2 field and Y-jaw for a 10⫻ 10 cm2 field. The y axis is approximately scaled based on the CAX dose ratio between the two cases.
FIG. 8. The 6 MV photon beam profile in-water for a 40 cm⫻ 40 cm field at 1.5, 5.0, and 10.0 cm depths. The profiles are presented along the direction of X-jaw. The y axis is approximately scaled based on the CAX dose ratio between the cases. Medical Physics, Vol. 32, No. 1, January 2005
146
Cho et al.: Reference photon dosimetry data for 6 MV photon beam
146
TABLE IV. Comparison between various studies in terms of the values for the energy 共Ee兲 and radial spread 共Re兲 of the electron pencil beam incident on the target (adapted from Ref. 3). The nominal energy of the electron pencil beam is 6 MeV for all of the listed studies.
Author
Accelerator model
Ee (MeV)
FWHM spread in Ee (%)
Ding (Ref. 7)
Clinac 21EX
6.02
17
Fix et al. (Ref. 5) Hartmann-Siantar et al. (Ref. 6) Liu et al. (Ref. 4)
Clinac 2100 C/D Clinac high energy (generic) Clinac 2100C
6.05 6.2
0 0
6.5
0
Sheikh-Bagheri and Rogers (Ref. 8) Keall et al. (Ref. 3)
Clinac high energy (generic) Clinac 21EX
5.7
3
6.2
3
This work
Clinac 2100 (generic)
6.2
3
linear accelerator head, difference in data matching criteria, etc. F. Phase space files
In this study, the RPSD (i.e., phase space files) have been determined for the following field sizes: 4 ⫻ 4 cm2, 6 ⫻ 6 cm2, 10⫻ 10 cm2, 15⫻ 15 cm2, 20⫻ 20 cm2, 30 ⫻ 30 cm2, and 40⫻ 40 cm2. The typical size of each file ranges from about 1 to 5 Gbytes as the field size increases
Re 1.2 mm FWHM Gaussian Pencil beam 2 mm diameter cylindrical 4 mm diameter cylindrical 2.0 mm FWHM Gaussian 1.3 mm FWHM Gaussian 1.0 mm FWHM Gaussian
from the smallest (i.e., 4 ⫻ 4 cm2) to the largest (i.e., 40 ⫻ 40 cm2). The phase space files for the smallest and largest field sizes contain full phase space information (i.e., type of particle, energy, and direction) for about 30 million and 170 million particles, respectively, that can be used as input to the DOSXYZnrc code for in-phantom simulation. IV. DISCUSSION The approaches adopted in this study can be applicable to the development of the RPDD and RPSD for all the modern
FIG. 9. The distribution of the RPC-measured output factors for a 20⫻ 20 cm2 field shown in Fig. 2. Outliers deviating more than ±4 from the mean are not included in this plot. After rejecting two outlying data points, the total number of data points 共N兲 is 165 and the number of data points within ±2 from the mean is 157. The correlation coefficient for a Gaussian fit is 0.95.
Medical Physics, Vol. 32, No. 1, January 2005
147
Cho et al.: Reference photon dosimetry data for 6 MV photon beam
computer-controlled linear accelerators, whose dosimetric characteristics can be duplicated from one unit to another. Alternatively, the manufacturers’ standard data may be considered as a potential candidate for the RPDD of a certain machine and nominal energy in question, as long as they are available. However, the applicability of the manufacturers’ standard data as the RPDD may not be claimed, until the data have been thoroughly verified against the measured data obtained in a consistent manner for a sufficiently large number of machine units. For instance, the Varian standard data for the 6 MV photon beam may be considered as the RPDD from now on, owing to the current study. A number of important issues are discussed here in order to avoid possible confusion and misinterpretation about the RPDD. First of all, it should be emphasized again that the RPDD might not be applicable for those machines significantly altered from the manufacture’s original specifications, especially in the head of the linear accelerator. For example, the RPDD may not be applicable to those machines deliberately modified for certain clinical procedures or those machines that underwent a major repair such as a waveguide change. In such cases, as usual, a comprehensive set of measurements should be performed during the initial commissioning (or re-commissioning) process to determine (or verify) the basic photon dosimetry data. At this time, it seems difficult to make any firm recommendation for the criteria that can be used to identify those machines significantly different from the manufacturer’s generic machine. Nevertheless, based on the way the RPDD are determined, one may consider a certain machine out of specifications, if its basic dosimetry data at selected field sizes and depths deviate from the RPDD, more than two standard deviations associated with the RPDD (e.g., 2 ⬇ 2%). This could be a reasonable criterion because the measured data used to establish the RPDD are distributed within ±2 of the mean with 95% probability assuming a Gaussian distribution in the measured data. In fact, as demonstrated for a 20⫻ 20 cm2 field output factor (Fig. 9), the RPC-measured data appear to be normally distributed, showing 95% of data to be found within ±2 from the mean. Figure 9 also shows that the data can be fit by a Gaussian function with a correlation coefficient of 0.95. A further, more rigorous study about this issue may be necessary, along with further refinement of the RPDD. V. CONCLUSIONS This study presents the RPDD and RPSD for the 6 MV photon beam from Varian 2100 series linear accelerators. The RPDD were constructed by compiling our own measured data and the average data obtained from the analysis of the measured data from the RPC and the RPC-monitored institutions. All the measured data from the RPC and the RPCmonitored institutions were found to be within a statistically tight range (i.e., 1 ⬇ 1% or less) for each dosimetric quantity. The manufacturer’s standard data, except for in-air OAFs that are available only from the current study, were compared with the average data and our own measured data Medical Physics, Vol. 32, No. 1, January 2005
147
during the generation of the RPDD, showing that the manufacturer’s standard data could also be used as the RPDD for the photon beam studied in this study. The RPSD were produced by the Monte Carlo calculations using the BEAMnrc/ DOSXYZnrc code system with the Ee and Re values, 6.2 MeV (a spread of 3% FWHM) and 1.0 mm FWHM, respectively. The RPSD were capable of generating Monte Carlo data that agreed with the RPDD within the acceptance criteria adopted in the current study (e.g., 1% or 1 mm for depth dose). ACKNOWLEDGMENTS This investigation was supported in part by Public Health Service Grant No. CA 10953 awarded by the National Cancer Institute, Department of Health and Human Services. The authors acknowledge the contribution of the RPC staff physicists to the measured data used in this study. The authors appreciate the following people for various help over the course of current investigation: Dr. Lei Dong, Roy Steadham, Paul Holguin, and Dr. Al Smith at M. D. Anderson Cancer Center; Dr. Jeff Siebers and Dr. Paul Keall at Medical College of Virginia. The authors express their gratitude to anonymous referees for their constructive comments during the peer-review process. Finally, the authors are grateful to Varian Medical Systems for providing us with the detailed machine specifications and standard data. a)
Author to whom correspondence should be addressed; electronic mail:
[email protected] 1 R. J. Watts, “Comparative measurements on a series of accelerators by the same vendor,” Med. Phys. 26, 2581–2585 (1999). 2 S. H. Cho and G. S. Ibbott, “Reference photon dosimetry data: A preliminary study of in-air off-axis factor, percentage depth dose, and output factor of the Siemens Primus linear accelerator,” J. Appl. Clin. Med. Phys. 4, 300–306 (2003). 3 P. J. Keall, J. V. Siebers, B. Libby, and R. Mohan, “Determining the incident electron fluence for Monte Carlo-based photon treatment planning using a standard measured data set,” Med. Phys. 30, 574–582 (2003). 4 H. H. Liu, T. R. Mackie, and E. C. McCullough, “A dual source photon beam model used in convolution/superposition dose calculations for clinical megavoltage x-ray beams,” Med. Phys. 24, 1960–1974 (1997). 5 M. K. Fix, M. Stampanoni, P. Manser, E. J. Born, R. Mini, and P. Ruegsegger, “A multiple source model for 6 MV photon beam dose calculations using Monte Carlo,” Phys. Med. Biol. 46, 1407–1427 (2001). 6 C. L. Hartmann Siantar, R. S. Walling, T. P. Daly, B. Faddegon, N. Albright, P. Bergstrom, A. F. Bielajew, C. Chuang, D. Garrett, R. K. House, D. Knapp, D. J. Wieczorek, and L. J. Verhey, “Description and dosimetric verification of the PEREGRIN Monte Carlo dose calculation system for photon beams incident on a water phantom,” Med. Phys. 28, 1322–1337 (2001). 7 G. X. Ding, “Energy spectra, angular spread, fluence profiles and dose distributions of 6 and 18 MV photon beams: Results of Monte Carlo simulations for a Varian 2100EX accelerator,” Phys. Med. Biol. 47, 1025–1046 (2002). 8 D. Sheikh-Bagheri and D. W. O. Rogers, “Sensitivity of megavoltage photon beam Monte Carlo simulations to electron beam and other parameters,” Med. Phys. 29, 379–390 (2002). 9 D. Sheikh-Bagheri and D. W. O. Rogers, “Monte Carlo calculation of nine megavoltage photon beam spectra using the BEAM code,” Med. Phys. 29, 391–402 (2002). 10 M. Fippel, F. Haryanto, O. Dohm, F. Nusslin, and S. Kriesen, “A virtual photon energy fluence model for Monte Carlo dose calculation,” Med. Phys. 30, 301–311 (2003). 11 D. W. O. Rogers, B. A. Faddegon, G. X. Ding, C.-M. Ma, J. We, and T. R. Mackie, “BEAM: A Monte Carlo code to simulate radiotherapy treat-
148
Cho et al.: Reference photon dosimetry data for 6 MV photon beam
ment units,” Med. Phys. 22, 503–524 (1995). D. W. O. Rogers, C.-M. Ma, G. X. Ding, B. R. Walters, D. SheikhBagheri, and G. G. Zhang, “BEAMnrc users manual,” National Research Council Report PIRS-0509(A) rev. G, Ottawa, Canada, 2002. 13 B. R. Walters and D. W. O. Rogers, “DOSXYZnrc users manual,” National Research Council Report PIRS-794, Ottawa, Canada, 2002. 14 H. H. Liu, T. R. Mackie, and E. C. McCullough, “Modeling photon output caused by backscattered radiation into the monitor chamber from collimator jaws using a Monte Carlo technique,” Med. Phys. 27, 737–744 (2000). 15 G. X. Ding, “Using Monte Carlo simulation to commission photon beam output factors—A feasibility study,” Phys. Med. Biol. 48, 3865–3874 (2003). 16 G. Starkschall, R. E. Steadham, R. A. Popple, S. Ahmad, and I. I. Rosen, “Beam-commissioing methodology for a three-dimensional convolution/ superposition photon dose algorithm,” J. Appl. Clin. Med. Phys. 1, 8–27 12
Medical Physics, Vol. 32, No. 1, January 2005
148
(2000). B. Fraass, K. Doppke, M. Hunt, G. Kutcher, G. Starkshall, R. Stern, and J. Van Dyk, “American Association of Physicists in Medicine Radiation Therapy Committee Task Group 53: Quality assurance for clinical radiotherapy treatment planning,” Med. Phys. 25, 1773–1829 (1998). 18 B. R. Walters, I. Kawrakow, and D. W. O. Rogers, “History by history statistical estimators in the BEAM code system,” Med. Phys. 29, 2745– 2752 (2002). 19 P. R. Almond, P. J. Biggs, B. M. Coursey, W. F. Hanson, M. S. Huq, R. Nath, and D. W. O. Rogers, “AAPM’s TG-51 protocol for clinical reference dosimetry of high-energy photon and electron beams,” Med. Phys. 26, 1847–1870 (1999). 20 G. X. Ding, “Dose discrepancies between Monte Carlo calculations and measurements in the buildup region for a high energy photon beams,” Med. Phys. 29, 2459–2463 (2002). 17