International Journal of Obesity (2014) 38, S76–S85 © 2014 Macmillan Publishers Limited All rights reserved 2046-2166/14
OPEN
www.nature.com/ijo
ORIGINAL ARTICLE
Reference values of bone stiffness index and C-terminal telopeptide in healthy European children D Herrmann1, T Intemann1, F Lauria2, S Mårild3, D Molnár4, LA Moreno5, I Sioen6, M Tornaritis7, T Veidebaum8, I Pigeot1,9 and W Ahrens1,9 on behalf of the IDEFICS consortium BACKGROUND/OBJECTIVE: Quantitative ultrasound measurements and bone metabolic markers can help to monitor bone health and to detect impaired skeletal development. Population-based reference values for children may serve as a basis for preventive measures to reduce the risk of osteoporosis and osteoporotic fractures in later life. This is the first paper providing age-, sex- and height-specific reference values for bone stiffness index (SI) and serum carboxy-terminal cross-linking telopeptide of type I collagen (CTX) in healthy, apparently prepubertal children. SUBJECTS/METHODS: In the population-based IDEFICS baseline survey (2007–2008) and follow-up (2009–2010), 18 745 children from eight European countries were newly recruited. A total of 10 791 2–10.9-year-old and 1646 3–8.9-year-old healthy children provided data on SI of the right and left calcaneus and serum CTX, respectively. Furthermore, height and weight were measured. Percentile curves were calculated using the General Additive Model for Location Scale and Shape (GAMLSS) to model the distribution of SI and CTX depending on multiple covariates while accounting for dispersion, skewness, and the kurtosis of this distribution. RESULTS: SI was negatively associated with age and height in children aged 2–5 years, whereas a positive association was observed in children aged 6–10 years. The dip in SI occurred at older age for higher SI percentiles and was observed earlier in taller children than in smaller children. The CTX reference curves showed a linear-positive association with age and height. No major sex differences were observed for the SI and CTX reference values. CONCLUSION: These reference data lay the ground to evaluate bone growth and metabolism in prepubertal children in epidemiological and clinical settings. They may also inform clinical practice to monitor skeletal development and to assess adverse drug reactions during medical treatments. International Journal of Obesity (2014) 38, S76–S85; doi:10.1038/ijo.2014.138
INTRODUCTION Unhealthy lifestyle habits, like physical inactivity may hamper the child attaining its genetically programmed peak bone mass. Moreover, an impaired skeletal development in early life can be caused by an underlying genetically or lifestyle-related disorder, for example, adiposity as well as by certain medical treatments.1–4 This may in return increase the risk of osteoporosis and osteoporotic fractures later in life.5–7 Previous studies reported that children having a low bone mineral density in prepuberty remain to have a low bone mineral density in adolescence.8–10 In contrast, other studies showed that an impaired skeletal development during childhood may be largely reversible when treating underlying diseases.11–13 Age- and sex-specific bone reference values can help to assess skeletal development during childhood and to compare the bone health status of a child with that of a healthy population having the same age, sex and ethnicity. Thus, deviations from a normal skeletal development may be identified in an early stage. Until now, paediatric reference data have mainly been used for diagnosing poor bone acquisition in children who are suffering from multiple fractures, diseases or receiving medical treatments affecting bone metabolism.11,14 Bone reference data may be not only a diagnostic 1
tool for children with bone diseases15 but may also serve to monitor apparently healthy subjects and to identify those who may benefit from specific interventions to improve bone health. Only few studies established paediatric reference values for physical bone measurements. Reference values are mainly reported for bone mineral content and areal bone mineral density (aBMD) assessed with dual-energy X-ray absorptiometry (DXA). These reference data are mostly based on Asian, mixed American and Caucasian populations and are predominantly available for children above the age of 6 years.10,14,16–21 Several studies reported limitations of DXA to assess bone status in growing individuals. Especially, the use of aBMD results in an artificial underestimation of the bone status in short people and an overestimation in tall people due to its areal but not volumetric measurement. This measure is size dependant owing to its twodimensional image projection of a three-dimensional structure. That is, it does not account for depth or size and hence, it is not able to predict the ‘true density’ of the bone.16,22 Furthermore, DXA does not distinguish between trabecular and cortical bone. It provides only little information on bone geometry and trabecular microarchitecture. Moreover, there is no evidence that aBMD is predictive for fracture risk in children.23
Leibniz Institute for Prevention Research and Epidemiology—BIPS, Bremen, Germany; 2Unit of Epidemiology and Population Genetics, Institute of Food Sciences, Consiglio Nazionale delle Ricerche, Avellino, Italy; 3Department of Pediatrics, Institute of Clinical Sciences, The Queen Silvia Children’s Hospital, Sahlgrenska Academy at University of Gothenburg, Gothenburg, Sweden; 4Department of Pediatrics, University of Pécs, Pécs, Hungary; 5GENUD (Growth, Exercise, Nutrition and Development) Research Group, University of Zaragoza, Zaragoza, Spain; 6Department of Public Health, Ghent University, Ghent, Belgium; 7Research and Education Institute of Child Health, Strovolos, Cyprus; 8 Department of Chronic Diseases, National Institute for Health Development, Estonian Centre of Behavioral and Health Sciences, Tallinn, Estonia and 9Institute of Statistics, Faculty of Mathematics and Computer Science, Bremen University, Bremen, Germany. Correspondence: Professor Dr W Ahrens, Leibniz Institute for Prevention Research and Epidemiology—BIPS, Achterstr. 30, D-28359 Bremen, Germany. E-mail:
[email protected]
Reference values for bone stiffness D Herrmann et al
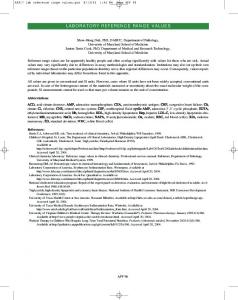
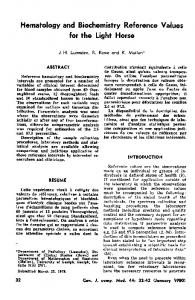
S77 Quantitative ultrasound (QUS) may be a more appropriate method to monitor skeletal development in children compared to DXA. QUS is a quick, cost-efficient and radiation-free method to evaluate bone stiffness that indicates density, structure and composition of the bone.24,25 Especially, the calcaneus was found to be a reliable location to assess bone status. The calcaneus consists of 90% trabecular bone that shows a high metabolic rate. The bone microarchitecture is similar to that of the lumbar spine and the femoral neck, which are major body sites for diagnosing osteoporosis.24 Besides the difference between QUS and DXA measurements assessing bone status, bone stiffness showed good correlations with aBMD assessed by DXA in adults25 and children.26,27 Furthermore, it revealed to be highly prognostic with regard to bone fractures in adults28 and proved to be a valid measure for the risk for osteopenia in young patients.27 Up to now, QUS references were established mainly for adults but are barely available for children and adolescents.20,24 According to the recommendation of the International Society for Clinical Densitometry, a combined assessment of physical measures and biochemical bone metabolic markers is useful to identify a reduced skeletal development in children.11,15,29 Physical bone measurements predict the actual bone status. Bone metabolic markers, such as osteocalcin or collagen cross-linked telopeptides indicate reduced or increased bone turnover processes. These clinical parameters may be useful to monitor skeletal development, as they can be repeated at much shorter intervals. Hence, they allow detection of acute effects caused by diseases or treatments long time before changes in bone mass occur.15 Reference data on these bone metabolic markers are rare in children and are mostly limited to selected clinical populations with a limited age range.11,15,30,31 In the IDEFICS (Identification and prevention of Dietary- and lifestyle-induced health Effects in Children and InfantS) study, bone stiffness index (SI) was measured using QUS in a large European child cohort. Serum carboxy-terminal cross-linking telopeptide of type I collagen (β-CrossLaps, CTX) as an indicator for bone resorption and bone turnover was measured in a case-control subsample. The aim of the present study was to provide age- and sexspecific reference values for SI and CTX adjusted for body size for apparently prepubertal children based on an European sample of 18 745 healthy children who participated in the IDEFICS study. To calculate reference values and percentile curves, the General Additive Model for Location Scale and Shape (GAMLSS) was used to model the distribution of SI and CTX depending on multiple covariates while accounting for dispersion, skewness, and particularly the kurtosis of this distribution.32,33 MATERIALS AND METHODS Analysis group In the population-based IDEFICS baseline survey (2007–2008, T0) and follow-up (2009–2010, T1) 18 745 children aged 2–10.9 from eight European countries (Belgium, Cyprus, Estonia, Germany, Hungary, Italy, Spain, Sweden) were newly recruited and examined. The IDEFICS study is one of the current largest prospective European child cohorts.34 Besides the comprehensive IDEFICS examination programme, heel QUS was applied in a subsample. Written informed consent was obtained from the parents and each child was asked to give verbal assent immediately before examination. Participants were free to omit specific modules like blood drawing. In each country, the participating centres obtained ethical approval by their responsible authority. The whole examination programme of the IDEFICS study as well as further information regarding the study design were recently described in detail.34–36 Figure 1 summarises all exclusion criteria as well as the number of included and excluded children of the final SI analysis group. A total of 11 414 children having their first QUS measurement in T0 (N = 7539) or having no QUS in T0 but in T1 (N = 2714) as well as all newly recruited children with QUS measurement in T1 (N = 1161) were considered for the © 2014 Macmillan Publishers Limited
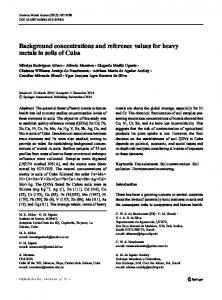
current analysis. Thirty-three children from T0 having no QUS in T0 but in T1 had an age above 10.9 years at T1 and were therefore excluded from the present analysis. We conducted a small reliability study based on five of eight Achilles devices that were used within the IDEFICS study to investigate measurement errors and outliers of SI values. QUS measurements were performed in 91 subjects and repeated three times per foot and device. Accounting for repeated measurements, a multilevel regression was performed, but showed no differences in SI values between the three repeated measurements and between measurements at the left and right foot. However, a significant deviation of the SI values between the devices was observed varying within a range of 0–5 SI units on average. A significant discrepancy between the devices was also found for the absolute SI difference of the left and right foot. Based on these results, the 97th percentile of the absolute difference between the SI values of the right and left foot was considered to reflect unreliable measurements. According to this quality criterion, 341 children were excluded from the present analysis. Decreased birth weight associated with premature birth and growth retardation causes reduced bone accretion. Hence, 14 children with a birth weight o1000 g were excluded according to the ICD-10 criterion on ‘extremely low birth weight’.37,38 Moreover, diseases and medical treatments that directly affect bone metabolism were identified by a health and medical history questionnaire. Diseases and treatments were categorized according to the ICD-10 and ATC coding, respectively (see Table 1).37,39 We excluded 111 children with a disease and 115 children receiving medical treatments that directly impair bone metabolism.5,15 Finally, nine children were excluded because their measurement values exceeded five s.d. values of the age- and sex-specific height z-score according to International Obesity Task Force.40 Thus, the final analysis group consisted of 10 791 children for SI (see Figure 1). Besides other bone metabolic markers, serum CTX has been analysed in a subsample drawn from the IDEFICS cohort for a case-control study. SI was chosen as an indicator for bone health. Within this case-control study, children between 2 and 9.9 years who had an SI below the 15th age- and sex-specific percentile of all IDEFICS children were eligible and classified as cases having low SI. Controls were randomly selected from the remaining cohort and matched to cases by age, sex and study centre. A total of 1646 children aged 3.0–8.9 years provided sufficient data on CTX and SI and were considered for the CTX analysis group, applying the same exclusion criteria as for the SI analysis group (see Table 1 and Figure 2).
Measurements QUS (Lunar Achilles Insight, GE Healthcare, Milwaukee, WI, USA)41 was used to measure SI on the right and left foot. Both measurements were used to calculate the mean, which was considered for calculating the present reference values. In a subsample, the raw QUS measurements broadband ultrasound attenuation and speed of sound were measured. Reference values of these parameters will be considered in further publications. For standardised measurements, the child was asked to sit barefoot on a stable chair directly in front of the device. The leg was positioned so that the foot and calf were aligned with the foot positioner. The foot was positioned using an adapter for children’s feet to put the calcaneus in focus. The study nurse made sure that the foot was flat and positioned firmly against the bottom of the footplate and that the child was not moving during the measurement. When changing the measured foot, the position on the chair had to be adjusted. Quality control was performed weekly, using the implemented quality assurance test of Achilles Insight.41 For laboratory analysis of CTX, blood samples were drawn in the morning (between 8 a.m. and 10 a.m.) after an overnight fast. Blood samples were centrifuged (2100 g, 10 min, room temperature) within 2 h of venipuncture, frozen within about 4 h after withdrawal and stored at − 80 °C. Serum CTX (ng ml− 1) was determined by electrochemiluminescence assay using Roche, ECLIA Modular E17 (Roche, Diagnostics, Mannheim, Germany). Body height (Seca 225 stadiometer, seca, Birmingham, UK) and body weight (Tanita BC 420 SMA, Tanita Europe, Sindelfingen, Germany) were measured to the nearest 0.1 cm and 0.1 kg, respectively. Body mass index (kg m −2) as well as z-scores of height, weight and body mass index were calculated according to the British 1990 growth reference.40 Moreover, children were categorised as thin (grade 1–3), normal weight, overweight and obese using the International Obesity Task Force criteria.42 Leg-to-leg bioelectrical impedance was measured with the Tanita scale and used to calculate fat-free mass based on the Tyrrell formula.43 fat-free mass index (kg m−2) was calculated according to Wells and Cole.44 International Journal of Obesity (2014) S76 – S85
Reference values for bone stiffness D Herrmann et al
S78 Baseline survey (2007 – 2008)
Newly recruited children (2009 – 2010)
16 228
2517
18 745
Table 1. Frequency of excluded disorders and medical treatments for establishing the SI and CTX analysis group
Exclusion Criteria and number of excluded children Missing SI (N=7331)
11 414 T0 children older than 10.9 years with QUS measurement at T1 (N=33) 11 381 Measurement error in SI (N=341) 11 040 Birth weight 5th s.d. (N=9) 10 791
Figure 1. Number of included and excluded children per exclusion criteria for the SI analysis group from the IDEFICS population.
Statistical analyses For both analysis groups, mean and s.d. of SI and CTX as well as of age, height and weight of 1-year age groups were calculated to describe study characteristics. In particular, percentile values of SI and CTX were calculated as a function of different covariates, for example, age, height or weight, stratified by sex using the GAMLSS method. Due to the case-control design, the CTX sample included a high percentage (50%) of cases with a low SI that was defined below the 15th age- and sex-specific SI percentiles. To correct the GAMLSS analyses for oversampling of cases against controls, we used weights for cases and controls in the GAMLSS models calculating percentile values for CTX. These weights were based on the original distribution in the study sample (cases: 15%; controls: 85%). The GAMLSS method is an extension of the LMS method that models three parameters depending on one explanatory variable: (M) accounts for the median of the outcome variable and the coefficient of variation; (S) accounts for the variation around the mean and adjusts for non-uniform dispersion, while the skewness (L) accounts for the deviation from a normal distribution using a Box–Cox transformation. The GAMLSS method is able to consider distributions with varying kurtosis and multiple covariates in the model. We used the gamlss package (version 4.2–6) of the statistical software R (version 3.0.1).45 Different distributions, that is, the Box–Cox power exponential, the Box–Cox transformation or the Box–Cox Cole and Green distribution were fitted to the observed distribution of SI. The normal, the power exponential and the t-family distribution were fitted to the observed and weighted distribution of CTX. Depending on the potential covariates (for example, age, height, height z-score, weight, weight z-score, body mass index, body mass index z-score and fat-free mass index), distribution parameters were modelled either as a constant, as a linear function or as a cubic spline. To identify the best combination of these covariates, different combinations were investigated to choose the best model. Goodness of fit for both dependant variables SI and CTX was assessed based on the Bayesian Information Criterion, Q–Q plots and worm plots.46 The best model for SI and CTX included the covariates, age and height. For modelling SI percentiles, no adjustment for kurtosis was needed. Therefore, the final SI model for both sexes considered a Box–Cox Cole and Green distribution modelling μ as a linear International Journal of Obesity (2014) S76 – S85
Medication and Treatments Chemotherapeutics Corticosteroids Sex hormones Pituitary and hypothalamic hormones and analogues Tetracyclines Sum
Abbreviations: CTX, cross-linking telopeptide of type I collagen; SI, stiffness index.
function of age and a cubic spline of height, log(σ) and ν as cubic splines of height only. The final model for CTX considered a normal distribution modelling μ as a linear function of age and height and log(σ) as constant in both sexes. Figure 3, in which the Q–Q plots of residuals for SI and CTX in boys are depicted, shows that the derived percentiles fit the data well. The same was observed for girls (data not shown). Final models of SI and CTX were used to calculate percentile values for the 1st, 3rd, 10th, 25th, 50th, 75th, 90th, 97th and 99th percentiles.33,45 To present values of the calculated percentiles, tables were presented for 1-year age groups and seven height percentiles (3rd, 10th, 25th, 50th, 75th, 90th and 97th). Further age- and sex-specific reference values of the 5th, 15th, 85th and 95th percentiles of SI and CTX will be provided in (Supplementary Tables A–D). In the following, children aged 2–o6 years and 6–o 11 years will be referred to as preschool and primary school children, respectively.
RESULTS Characteristics of the analysis groups for SI and CTX Tables 2 and 3 present the sex-specific characteristics of the SI and CTX analysis groups, stratified by 1-year age groups, respectively. The SI analysis group included children aged 2–10.9 years and consisted of 5412 boys and 5379 girls. Boys and girls had similar average SI values. Although, preschool girls tended to have slightly higher SI values compared with boys, the primary school girls had marginally lower SI values. Age-specific average body height and weight were similar in boys and girls (see Table 2). The CTX analysis group aged 3–8.9 years consisted of 857 boys and 789 girls. Within 1-year age groups, CTX values differed by © 2014 Macmillan Publishers Limited
Reference values for bone stiffness D Herrmann et al
S79
0.01–0.07 ng ml − 1 between both sexes. With increasing age, slightly higher mean CTX values were observed in boys and girls. Boys and girls showed similar age-specific body height and weight values (see Table 3).
observed earlier in taller children than in smaller children. The association of SI with height was inverted around the dip. In boys, height had a smaller effect on SI after the dip compared with girls (Figure 4 and Tables 4 and 5).
Age- and sex-specific reference percentiles for SI Tables 4 and 5 show the 1st, 3rd, 10th, 25th, 50th, 75th, 90th, 97th and 99th SI percentile values by 1-year age groups and height for girls and boys, separately. Figure 4 presents sex-specific reference curves of the 1st, 50th and 99th SI percentile by age for small, average and tall children (that is, 3rd, 50th and 97th height percentile). In preschool children, SI percentiles showed a negative association with age and height. In primary school children, a positive association with age and height was observed. The dip in SI occurred at an older age for higher SI percentiles and was
Age- and sex-specific reference percentiles for CTX Tables 6 and 7 show the 1st, 3rd, 10th, 25th, 50th, 75th, 90th, 97th and 99th CTX percentile values by 1-year age groups and height for girls and boys, separately. Figure 5 presents sex-specific reference curves of the 1st, 50th and 99th CTX percentile by age for small, average and tall children. The CTX values showed a linear-positive association with age and height. The impact of height was slightly stronger in boys than in girls.
Newly recruited children (2009 – 2010)
Baseline survey (2007 – 2008) 16 228
2517 Exclusion Criteria and number of excluded children 18 745 Missing CTX (N=16 992) 1753 Missing SI (N=9) 1744 Birth weight < 1000g (N=2) 1742 Diseases (N=15) 1727 Medication or treatment (N=12) 1715 Height z-score >5th s.d. (N=1) 1714