Reflection properties and defect formation in photonic crystals ¨ zbaya) and B. Temelkuran E. O Department of Physics, Bilkent University, Bilkent, Ankara 06533, Turkey
~Received 13 May 1996; accepted for publication 28 May 1996! We have investigated the surface reflection properties of a layer-by-layer photonic crystal. By using a Fabry–Perot resonant cavity analogy along with the reflection-phase information of the photonic crystal, we predicted defect frequencies of planar defect structures. Our predictions were in good agreement with the measured defect frequencies. Our simple model can also predict and explain double defect formation within the photonic band gap. © 1996 American Institute of Physics. @S0003-6951~96!03532-2#
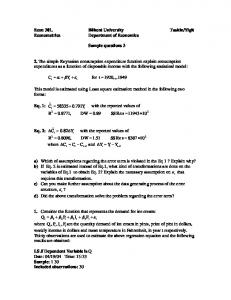
In analogy to electrons in an atomic crystal, the propagation of electromagnetic ~EM! waves in periodic dielectric structures can be forbidden in a certain range of frequencies. These three-dimensional structures that are called photonic band gap ~PBG! or photonic crystals, have recently received both theoretical and experimental attention and motivated the scientists to explore new possibilities.1–4 The initial interest in this area came from the proposal to use PBG crystals to control spontaneous emission in photonic devices, leading to more efficient light emitters like thresholdless semiconductor lasers5 and single-mode light-emitting diodes.6,7 However, the technological challenge associated with the fabrication of smaller scale structures have restricted the experimental demonstration of the basic photonic band gap crystals to microwave frequencies ~12–15 GHz!.8 Recently, we designed a three-dimensional layer-bylayer structure which alleviates some of the fabrication difficulties inherent with the earlier designs.9 By using either alumina or silicon as the dielectric material, we have built and tested crystals with photonic band gap frequencies ranging from 15 to 500 GHz.10–12 The frequency range of these photonic crystals are suitable for a number of millimeter and sub-millimeter wave applications, including efficient reflectors, millimeter wave antennas, filters, sources, and waveguides.13–15 Most of these applications are based on two important properties of photonic crystals. First, the photonic crystals act like ideal reflectors at PBG frequencies. Second, it is possible to obtain defect or cavity modes by locally disturbing the periodicity of the photonic crystal.16–18 In this letter, we investigate the reflection properties of layer-bylayer photonic crystals and use this information to develop a simple model which explains the defect formation in photonic crystals. In order to investigate the reflection properties of photonic crystals, we constructed a new layer-by-layer crystal where we used square-shaped alumina rods ~0.32 cm30.32 cm315.25 cm!. In the new crystal, we chose a center-tocenter separation of 1.12 cm, corresponding to a dielectric filling rate of ;0.29. Figure 1 shows the schematics of the measurement set up we used in our experiments. An HP 8510C network analyzer and three microwave horn antennas were used to measure both the transmitted and reflected waves. For reflection measurements, we used a metal sheet a!
Electronic mail:
[email protected]
Appl. Phys. Lett. 69 (6), 5 August 1996
to calibrate our measurements, where we assumed that the metal sheet is a 100% reflector at these frequencies. By changing the incidence angle u, we could obtain the reflection and transmission properties of the photonic crystals at different propagation directions. By using the aforementioned experimental setup, we first investigated the transmission properties of our photonic crystal. The band gap edge values obtained from our transmission measurements along different crystal directions, were very close to the theoretical calculations which predicted a full band gap from 10.6 to 12.7 GHz. We then focused our efforts to the reflection measurements. Although, it was relatively easy to obtain the magnitude of the reflected waves on a reproducible basis, we faced a significant challenge to obtain reproducible phase measurements where we used a metal sheet for calibration purposes. The flatness of the top surface of the photonic crystal and the positioning of the photonic crystal with respect to the calibration metal plate were very critical for a reliable measurement. In our setup, our typical calibration error for the phase measurements was measured to be around 65°. Figure 2~a! shows the reflection and transmission characteristics of a 16 layer crystal along the stacking direction with an incidence angle u55°. The magnitude of the reflected and the transmitted waves were found to be independent of the polarization vector e of the incident EM wave. However, we found a strong polarization dependence for the phase of the reflected waves. Figure 2~b! shows the phase of the reflected waves as a function of frequency for both polarizations where the polarization vector e of the incident EM wave is either perpendicular
FIG. 1. Experimental setup for measuring the reflection and transmission properties of the photonic crystals. 0003-6951/96/69(6)/743/3/$10.00
© 1996 American Institute of Physics
743
TABLE I. Experimental measured defect frequencies, and the calculated total phase contributions from the two photonic crystal mirrors are given for different separation widths. The second defect mode (m52) appears for separation widths larger or equal to 10 mm. Separation width L ~mm! 3 4 5 6 7 8 9 10 11 12 13 14
Frequency ~GHz! m51
ft ~degrees! m51
13.97 13.5 13.13 12.54 12.15 11.78 11.45 11.16 10.86 10.66 10.45 13.98
260 230 202 170 156 134 113 92 73 53 34
f t 5 f 1 1 f 2 52m p 24 p L
FIG. 2. ~a! Reflection ~thick solid line! and transmission ~thin solid line! characteristics of the photonic crystal. ~b! The phase of the reflected waves from the surface of the photonic crystal for different polarizations.
or parallel to the rods of the top layer of the photonic crystal. We used this phase information to understand and predict defect formation in photonic crystals. By separating a 16-layer photonic crystal from the middle with a separation width of L, we built planar defect structures and modeled them as Fabry–Perot resonators. We considered each 8-layer stack as the mirrors of the Fabry–Perot resonator with reflection coefficients r 1 e 2 j f 1 and r 2 e 2 j f 2 , where f 1 and f2 are the reflection-phase factors in radians. In a Fabry–Perot resonator, the circulating electric field E c can be written as a function of the incident electric field E i as19 E c5
12r 1 r 2 e
t2 2 j ~ 2 b L1 f 1 1 f 2 ! E i ,
~1!
where b is the propagation constant of air, and t 2 is the transmission coefficient of the second mirror. The resonant condition is satisfied when 2 b L1 f 1 1 f 1 52m p (m50, 61, 62, 63!, where enhancement of the circulating fields results in almost unity transmission at the resonant frequency. For photonic crystals, this resonance can be viewed as defect formation, where a narrow transmission window within the band gap region is observed. We used this resonant condition to estimate the defect frequencies for our planar defect structures. We first measured the transmission properties and the defect frequency as a function of separation width L. Using the resonance condition, along with the measured defect frequencies, we calculated the predicted total phase contribution, f t , from the two mirrors as 744
Appl. Phys. Lett., Vol. 69, No. 6, 5 August 1996
fL c
Frequency ~GHz! m52
ft ~degrees! (m52)
15.34 15.01 14.66 14.31 13.98
352 324 298 274 250
~ m50,61,62,63 ! ,
~2!
where f L is the defect frequency for a separation of length L, and c is the speed of light in air. Table I lists the measured defect frequencies, the corresponding value of m, and the calculated f t as a function of separation length L. We then measured the reflection properties of the two 8-layer mirrors, and found the experiment total phase of the two mirrors f t,exp as a function of frequency. Figure 3 compares the predicted, f t ( f L ) and the measured f t,exp(f) total phase of the two mirrors. As can be seen from the plot, the predicted phase values are in very good agreement with the measured phase values. With this model, the defect frequency ~or frequencies! for a given separation width L, can be predicted by solving, f L5
c @ 2m p 2 f t,exp~ f L !# 2L
~3!
by a graphical or an iteration method. As an example, for L59.5 mm our model predicted a frequency of 11.41 GHz for m51, while the experimental defect frequency was 11.36 GHz.
FIG. 3. Comparison of the experimental reflection-phase properties ~solid line! of the photonic crystal mirrors of the Fabry–Perot resonator, with the predicted reflection-phase properties for m51 ~squares!, and m52 ~circles!. ¨ zbay and B. Temelkuran E. O
Our model can also be used to explain double defect formation. From Fig. 2~b!, we know that the difference between the reflection phase at a frequency closer to the upper edge, and a frequency closer to the lower edge may be very high. For large separation widths, this phase difference along with the relatively large free-air propagation phase factor can satisfy the resonance condition at two different frequencies. As an example, for a separation width of 10.0 mm, resonance condition is satisfied for both f L 511.16 GHz (m51), and f L 515.34 GHz (m52) resulting in two separate defect windows within the stop band. As the separation width is further increased, the first defect (m51) disappears from the lower edge of the stop band, while new defects (m53,4, . . . ) appear from the upper edge of the stop band. In summary, we have investigated the reflection properties of a layer-by-layer photonic crystal. We have developed a Fabry–Perot resonant cavity model for planar defect structures, and compared the predicted reflection-phase properties with the experimentally measured reflection-phase properties. The agreement between the prediction and the experiment was very good, confirming the validity of the Fabry– Perot cavity model used for the planar defect structures. To our knowledge, our measurements are the first reported reflection-phase measurements of photonic crystals in scientific literature. The authors would like to thank G. Tuttle, R. Biswas. M. Sigalas, and K. M. Ho for useful discussions. This work is supported by the Turkish Scientific and Technical Research Council of Turkey ~Tubitak! under contract No. EEEAG156, and NATO-Collaborative Research Grant No. 950079.
Appl. Phys. Lett., Vol. 69, No. 6, 5 August 1996
1
E. Yablonovitch, T. J. Gmitter, and K. M. Leung, Phys. Rev. Lett. 67, 2295 ~1991!. 2 K. M. Ho, C. T. Chan, and C. M. Soukoulis, Phys. Rev. Lett. 65, 3152 ~1990!. 3 For a review, see the articles in Photonic Band Gaps and Location, edited by C. M. Soukolis ~Plenum, New York, 1993!. 4 I. I. Tarhan, M. P. Zinkin, and G. H. Watson, Opt. Lett. 20, 1571 ~1995!. 5 P. R. Villenevue, S. Fan, J. D. Joannopoulos, K. Y. Lim, G. S. Petrich, L. A. Kolodjeski, and R. Reif, Appl. Phys. Lett. 67, 167 ~1995!. 6 P. L. Gourley, J. R. Wendt, G. A. Vawter, T. M. Brennan, and B. E. Hammons, Appl. Phys. Lett. 6, 687 ~1994!. 7 J. P. Dowling, M. Scalora, M. J. Bloemer, and C. M. Bowden, Appl. Phys. Lett. 75, 1896 ~1994!. 8 E. Yablonovitch, J. Opt. Soc. Am. B 10, 283 ~1993!. 9 K. M. Ho, C. T. Chan, C. M. Soukoulis, R. Biswas, and M. Sigalas, Solid State Commun. 89, 413 ~1994!. 10 E. Ozbay, A. Abeyta, G. Tuttle, M. Tringides, R. Biswas. C. Soukoulis, C. T. Chan, and K. M. Ho, Phys. Rev. B 50, 1945 ~1994!. 11 E. Ozbay, E. Michel, G. Tuttle, M. Sigalas, R. Biswas, and K. M. Ho, Appl. Phys. Lett. 64, 2059 ~1994!. 12 E. Ozbay, E. Michel, G. Tuttle, R. Biswas, K. M. Ho, J. Bostak, and D. M. Bloom, Opt. Lett. 19, 1155 ~1994!. 13 E. R. Brown, C. D. Parker, and O. B. McMahon, Appl. Phys. Lett. 64, 3345 ~1994!. 14 C. J. Maggiore, A. M. Clogston, G. Spalek, W. C. Sailor, and F. M. Mueller, Appl. Phys. Lett. 64, 1451 ~1994!. 15 D. R. Smith, S. Shultz, N. Kroll, M. Sigalas, K. M. Ho, and C. M. Soukoulis, Appl. Phys. Lett. 65, 645 ~1994!. 16 E. Yablonovitch, T. J. Gmitter, R. D. Meade, A. M. Rappe, K. D. Brommer, and J. D. Joannopoulos, Phys. Rev. Lett. 67, 3380 ~1991!. 17 E. Ozbay, G. Tuttlel, M. Sigalas, C. Soukoulis, and K. M. Ho, Phys. Rev. B 51, 13 961 ~1994!. 18 E. Ozbay, J. S. McCalmont, G. Tuttle, R. Biswas, M. M. Sigalas, C. Soukoulis, and K. M. Ho, Appl. Phys. Lett. 67, 1969 ~1995!. 19 A. E. Siegman, Lasers ~University Science Books, Mill Valley, 1986!.
¨ zbay and B. Temelkuran E. O
745