VOLUME 84, NUMBER 10
PHYSICAL REVIEW LETTERS
6 MARCH 2000
Tight-Binding Description of the Coupled Defect Modes in Three-Dimensional Photonic Crystals Mehmet Bayindir,* B. Temelkuran, and E. Ozbay Department of Physics, Bilkent University, Bilkent, 06533 Ankara, Turkey (Received 22 September 1999) We have experimentally observed the eigenmode splitting due to coupling of the evanescent defect modes in three-dimensional photonic crystals. The splitting was well explained with a theory based on the classical wave analog of the tight-binding ( TB) formalism in solid state physics. The experimental results were used to extract the TB parameters. A new type of waveguiding in a photonic crystal was demonstrated experimentally. A complete transmission was achieved throughout the entire waveguiding band. We have also obtained the dispersion relation for the waveguiding band of the coupled periodic defects from the transmission-phase measurements and from the TB calculations. PACS numbers: 42.70.Qs, 42.60.Da, 42.82.Et, 71.15.Fv
The artificially created three-dimensional (3D) periodic structures inhibit the propagation of electromagnetic (EM) waves in a certain range of frequencies in all directions [1,2]. In analogy with electronic band gaps in semiconductors, these structures are called photonic band gap (PBG) materials or photonic crystals [3,4]. The initial interest in this area came from the proposal to use PBG crystals to control spontaneous emission in photonic devices [1]. However, the technological challenges restricted the experimental demonstrations and relevant applications of these crystals to millimeter wave and microwave frequencies [5–7]. Recently, Lin and Fleming reported a photonic crystal with a band gap at optical frequencies [8,9]. With this breakthrough, initially proposed applications like thresholdless semiconductor lasers [10] and single-mode light-emitting diodes [11,12] became feasible. By breaking the periodicity of the photonic crystal, it is possible to create highly localized defect modes within the photonic band gap, which are analogous to the localized impurity states in a semiconductor [13]. Photons hop from such a evanescent defect mode to the neighboring one due to overlapping of the tightly confined modes. This is exactly the classical wave analog of the tightbinding (TB) method in solid state physics [14,15]. The TB formulation has been proven to be very useful in studying electronic properties of solids [16,17]. Recently, the TB scheme was also successfully used for various photonic structures. Waveguiding along the impurity chains in photonic insulators [18], waveguiding through coupled resonators [19], and one-dimensional superstructure gratings [20] were theoretically investigated by using TB formalism. Lidorikis et al. tested the TB model by comparing the ab initio results of two-dimensional PBG structures with and without defects [21]. They obtained the TB parameters by an excellent fitting to ab initio results. Splitting of the coherent coupling of whispering gallery mode in quartz polystyrene spheres were reported and explained within the TB photon picture [22]. The optical modes in the micrometer-sized semiconductor coupled cavities were investigated by Bayer et al. [23].
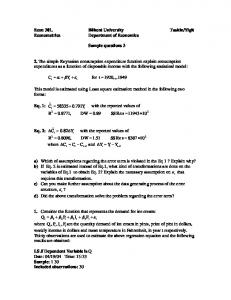
In this Letter, we investigated experimentally and theoretically the coupling between localized cavity modes in a dielectric-based layer-by-layer 3D photonic crystal within the TB framework. We reported on the observation of the eigenmode splitting in the coupled cavities. The splitting was well explained by the TB photon picture. The TB parameters were extracted from the transmission measurements. We demonstrated a new type of waveguiding through localized defects. A complete transmission, nearly 100%, was observed throughout the entire waveguiding band. The measured dispersion relation for the waveguiding band agrees well with the TB results. We used the layer-by-layer photonic crystal [24,25] based on square shaped alumina rods (0.32 cm 3 0.32 cm 3 15.25 cm), with center-to-center separation of 1.12 cm. The crystal exhibits a three-dimensional photonic band gap extending from 10.6 to 12.8 GHz. The experimental setup consists of a HP 8510C network analyzer and microwave horn antennas to measure the transmission-amplitude and transmission-phase properties of various defect structures built around photonic crystals (Fig.1). The defective unit cells were created by removing a single rod from a single layer of the cell, where each cell consists of four layers having the symmetry of a face centered tetragonal structure [26]. The electric field polarization vector of the incident EM wave e was parallel to the rods of the defect layer for all measurements. By using the aforementioned experimental setup, we first measured the transmission amplitude through a crystal with a single defective unit cell. This resulted in a localized defect mode within the PBG which is analogous to acceptor impurity state in semiconductor physics [13]. The defect mode occurred at a resonance frequency of V 苷 12.150 GHz with a Q factor (quality factor, defined as center frequency divided by the peak’s full width at half maximum) of ⬃1000 [Fig. 2(a)]. Next, we measured the transmission through the crystal that contains two consecutive single rod removed unit cells. We observed that the mode in the previous case split into two resonance modes at frequencies v1 苷 11.831 GHz and v1 苷 12.402 GHz [Fig. 2(b)]. The intercavity distance
2140
© 2000 The American Physical Society
0031-9007兾00兾84(10)兾2140(4)$15.00
VOLUME 84, NUMBER 10
PHYSICAL REVIEW LETTERS
We first considered an individual localized mode EV 共r兲 of a single defect that satisfies the Maxwell equations which can be further simplified as
Removed Rods E
= 3 关= 3 EV 共r兲兴 苷 e0 共r兲 共V兾c兲2 EV 共r兲 ,
H Transmitter
Photonic Crystal Network Analyzer
Receiver
FIG. 1. The experimental setup for measuring the transmission characteristics of the coupled defect structures in threedimensional photonic crystals. The electric field polarization is directed along the removed rods.
for this structure was a 苷 1.28 cm, which corresponds to single unit cell thickness in the stacking direction. Figure 2(c) shows the transmission characteristics of a crystal having three consecutive defective cells, where the resonant modes were observed at frequencies G1 苷 11.708 GHz, G2 苷 12.153 GHz, and G3 苷 12.506 GHz. In order to understand the observed splitting due to coupling of the individual cavity modes, we introduced the classical wave analog of the TB model. In our case, the eigenmodes of each cavity were tightly confined at the defect sites. However, the overlap of the modes is enough to provide the propagation of photons through neighboring defect sites via hopping. Various forms of this picture successfully applied to the photonic systems in the scientific literature [18–21]. In this paper, we adopted the notation used by Yariv et al. [19].
Ω
Transmission (arb. units)
(a)
ω1
(b)
ω2
2 v1,2 苷 V 2 共1 6 b1 兲兾共1 6 a1 1 Da兲 ,
11.5
11.8
Γ2 12.0
12.2
Γ3 12.5
12.8
Frequency (GHz) FIG. 2. Transmission characteristics along the stacking direction of the photonic crystal: (a) For single defect with resonance frequency V. ( b) For two consecutive defects resulting in two split modes at resonance frequencies v1 and v2 with intercavity distance a 苷 1.28 cm. (c) For three consecutive defects with resonance frequencies G1 , G2 , and G3 .
R
(2)
where the TB parameters are given by a1 苷 dr 3 R e共r兲EV 共r兲 ? EV 共r 2 ax兲, ˆ V 共r兲 ? ˆ b1R苷 dr e0 共r 2 ax兲E EV 共r 2 ax兲, ˆ and Da 苷 dr关e共r兲 2 e0 共r兲兴EV 共r兲 ? EV 共r兲. By inserting the experimentally obtained eigenfrequencies v1 and v2 [see Fig. 2(b)] into Eq. (2), the TB parameters are determined as a1 苷 20.102 and b1 苷 20.149. Here we assumed that Da is negligible compared to a1 and b1 . This splitting is analogous to the splitting in the diatomic molecules, for example H 2 1 , in which the interaction between the two atoms produce a splitting of the degenerate atomic levels into bonding and antibonding orbitals. Our results are the first direct experimental observation of the bonding/antibonding mechanism in a photonic crystal which was theoretically proposed by Antonoyiannakis and Pendry [27]. Similarly, for a system with three coupled defects, the eigenfrequency V is split into three resonant frequencies: 2 ⯝ V 2 共1 6 G1,3
Γ1
(1)
where e0 共r兲 is the dielectric constant of the single defect and V is the corresponding eigenfrequency. Here we assumed R that EV 共r兲 is real, nondegenerate, and orthonormal, i.e., dr e0 共r兲EV 共r兲 ? EV 共r兲 苷 1. This merely describes the experimental structure used for Fig. 2(a). In the case of two coupled defects, the eigenmode can be written as a superposition of the individual evanescent defect modes as Ev 共r兲 苷 AEV 共r兲 1 BEV 共r 2 ax兲. ˆ The eigenmode Ev 共r兲 also satisfies Eq. (1) where e0 共r兲 is replaced with the dielectric constant of the system e共r兲 苷 e共r 2 ax兲 ˆ and V is replaced with eigenfrequency v of the coupled defect mode. Inserting Ev 共r兲 into Eq. (1) and multiplying both sides from the left first by EV 共r兲 and then by EV 共r 2 ax兲 ˆ and spatially integrating resulting equations, the single defect mode V is split into two eigenfrequencies
G22 ⯝ V 2 ,
(c)
6 MARCH 2000
p
2 b1 兲兾共1 6
p
2 a1 兲 ,
(3)
where we ignored the second nearest neighbor coupling between the cavity modes. This turned out to be a reasonable assumption for our case, since our experimental observation showed that the second nearest neighbor coupling parameters are 1 order of magnitude smaller than the first nearest neighbor coupling parameters. Table I compares the resonance frequencies, which were calculated by inserting TB parameters a1 and b1 into Eq. (3), with the values obtained from the experiment [Fig. 2(c)]. The experimentally measured three split modes coincide well with the theoretically expected values. This excellent 2141
VOLUME 84, NUMBER 10
PHYSICAL REVIEW LETTERS
TABLE I. The measured and calculated values of resonant frequencies for the crystal with three defective unit cells. Measured [GHz]
Calculated [GHz]
11.708 12.153 12.506
11.673 12.150 12.492
G1 G2 G3
agreement shows that the classical wave analog of TB formalism is valid for our structure. In the presence of the coupled periodic defect array, the eigenmode can be written as a linear combination of the individual defect modes [19,20] X E共r兲 苷 E0 exp共2inka兲EV 共r 2 nax兲 ˆ . (4) n
The dispersion relation for this structure can be obtained from Eqs. (1) and (4) keeping only the nearest neighbor coupling terms [18,19] 1 1 2b1 cos共ka兲 v 2 共k兲 苷 V 2 . (5) 1 1 Da 1 2a1 cos共ka兲 If the TB parameters, a1 and b1 , are small compared to unity, Eq. (5) is simplified to v共k兲兾V ⯝ 1 1 k1 cos共ka兲, where k1 苷 b1 2 a1 苷 20.047. When the number of defective unit cells is increased, a waveguiding band is expected to be formed due to the coupling of individual resonant modes. We measured the transmission through a ten unit cell crystal, where a single rod is removed in each unit cell. As shown in Fig. 3, the waveguiding band stands within the PBG extending from 11.47 to 12.62 GHz, with a bandwidth of Dv 苷 1.15 GHz. Near 100% transmission was observed throughout the waveguiding band. The amplitude of the parameter k1 can also be determined from the waveguiding bandwidth which gives us jk1 j 苷 Dv兾2V ⯝ 0.047,
6 MARCH 2000
which is exactly the same with a previously obtained value from the coupling of two cavities. The dispersion relation for the waveguiding band can be obtained from the transmission-phase measurement as follows [28]. The net phase difference Df between the phase of the EM wave propagating through the photonic crystal and the phase of the EM wave propagating in free space for a total crystal thickness of L is given by Df 苷 kL 2 2pfL兾c. This expression can be used to determine the wave vector k of the crystal at each frequency f within the waveguiding band. Figure 4 shows the comparison of the measured (diamonds) and calculated (solid line) dispersion relations. As shown in Fig. 4, TB calculation gives good agreement with the measured result, and the deviations between the experiment and the theory are more pronounced around the edges of the waveguiding band. We expect this discrepancy to vanish as the number of unit cells used in the experiment is increased. The inset in Fig. 4 shows the comparison of the theoretical (solid line) and experimental (dotted line) variation of the group velocity, yg 共k兲 苷 dv共k兲兾dk ⯝ 2Vk1 a sin共ka兲, of the waveguiding band as a function of wave vector k. The theoretical curve is obtained from Eq. (5), while the experimental curve is obtained by taking the derivative of the best fitted cosines function to the experimental data. Notice that the group velocity vanishes at the waveguiding band edges [19,29]. It is important to note that, in the stimulated emission process, the effective gain is inversely proportional to the group velocity [30]. The group velocity can be made smaller if one can reduce the amplitude of the parameter k1 .
1.05
Experiment Theory
0
∆ω
0.03
0.95 −40
0.02 0.01 0.00 0.00
0.50
1.00
ka/π
0.90 −60
0.0
0.5
1.0
ka/π 10.0
12.0
14.0
Frequency (GHz) FIG. 3. Transmission amplitude as function of frequency for a waveguide structure which consists of ten consecutive defective crystals (solid line). Transmission through a perfect crystal is plotted for the comparison (dotted line).
2142
vg(k)/c
−20
ω(k)/Ω
Transmission (dB)
1.00
FIG. 4. Dispersion diagram of the waveguiding band predicted from the transmission-phase measurements (diamonds) and calculated by using tight-binding formalism (solid line) with k1 苷 20.047. Inset: The normalized group velocity diagrams calculated by the theory (solid line) and obtained from the experimental data (dotted line) agree well and both vanish at the guiding band edges, where c is the speed of light.
VOLUME 84, NUMBER 10
PHYSICAL REVIEW LETTERS
In conclusion, we have observed the splitting of the coupled localized cavity modes in the 3D layer-by-layer photonic crystal. We have also demonstrated formation of the waveguiding band within the stop band and compared the measured dispersion relation of the guiding band with the TB predictions. To our knowledge, these are the first reported measurements from which TB parameters and dispersion relation were directly obtained from the experiment. The excellent agreement between experiment and theory is an indication of the potential applications of the tight-binding scheme in the photonic structures. This work is supported by the Turkish Scientific and Technical Research Council of TURKEY (TÜB˙ITAK) under Contract No. 197-E044, NATO Grant No. SfP971970, National Science Foundation Grant No. INT-9820646, and NATO-Collaborative Research Grant No. 950079. It is a pleasure to acknowledge useful discussions with Ç. Kılıç. Note added.—After submission of this manuscript, we have observed the splitting phenomena by using laser-micromachined alumina photonic crystals (W-band, 75–120 GHz). The TB parameter k1 ⯝ 20.045 was found to be almost the same. Since the Maxwell’s equations have no fundamental length scale, we expect that our microwave and millimeter wave results can be extended to the optical frequencies.
*Author to whom correspondence should be addressed. Electronic address:
[email protected] [1] E. Yablonovitch, Phys. Rev. Lett. 58, 2059 (1987). [2] S. John, Phys. Rev. Lett. 58, 2486 (1987). [3] J. D. Joannopoulos, R. D. Meade, and J. N. Winn, Photonic Crystals: Molding the Flow of Light (Princeton University Press, Princeton, New Jersey, 1995). [4] For a recent review, see articles in Photonic Band Gap Materials, edited by C. M. Soukoulis (Kluwer, Dortrecht, 1996).
6 MARCH 2000
[5] M. C. Wanke, O. Lehmann, K. Muller, Q. Wen, and M. Stuke, Science 275, 1284 (1997). [6] B. Temelkuran et al., Appl. Phys. Lett. 72, 2376 (1998). [7] B. Temelkuran and E. Ozbay, Appl. Phys. Lett. 74, 486 (1999). [8] S. Y. Lin et al., Nature ( London) 394, 251 (1998). [9] J. G. Fleming and Shawn-Yu Lin, Opt. Lett. 24, 49 (1999). [10] P. R. Villenevue et al., Appl. Phys. Lett. 67, 167 (1995). [11] P. L. Gourley, J. R. Wendt, G. A. Vawter, T. M. Brennan, and B. E. Hammons, Appl. Phys. Lett. 64, 687 (1994). [12] J. P. Dowling, M. Scalora, M. J. Bloemer, and C. M. Bowden, J. Appl. Phys. 75, 1896 (1994). [13] E. Yablonovitch et al., Phys. Rev. Lett. 67, 3380 (1991). [14] N. W. Ashcroft and N. D. Mermin, Solid State Physics (Sounders, Philadelphia, 1976). [15] J. Callaway, Quantum Theory of the Solid State (Academic Press, Boston, 1991). [16] J. C. Slater and G. F. Koster, Phys. Rev. 94, 1498 (1954). [17] W. A. Harrison, Electronic Structure and the Properties of Solids (Freeman, San Francisco, 1980). [18] N. Stefanou and A. Modinos, Phys. Rev. B 57, 12 127 (1998). [19] A. Yariv, Y. Xu, R. K. Lee, and A. Scherer, Opt. Lett. 24, 711 (1999). [20] C. Martijn de Sterke, Phys. Rev. E 57, 3502 (1998). [21] E. Lidorikis, M. M. Sigalas, E. N. Economou, and C. M. Soukoulis, Phys. Rev. Lett. 81, 1405 (1998). [22] T. Mukaiyama, K. Takeda, H. Miyazaki, Y. Jimba, and M. Kuwata-Gonokami, Phys. Rev. Lett. 82, 4623 (1999). [23] M. Bayer et al., Phys. Rev. Lett. 81, 2582 (1998). [24] K. M. Ho, C. T. Chan, C. M. Soukoulis, R. Biswas, and M. M. Sigalas, Solid State Commun. 89, 413 (1994). [25] E. Ozbay, J. Opt. Soc. Am. B 13, 1945 (1996). [26] E. Ozbay et al., Phys. Rev. B 51, 13 961 (1995). [27] M. I. Antonoyiannakis and J. B. Pendry, Phys. Rev. B 60, 2363 (1999). [28] E. Ozbay et al., Phys. Rev. B 50, 1945 (1994). [29] K. Sakoda and K. Ohtaka, Phys. Rev. B 54, 5732 (1996). [30] K. Sakoda, Opt. Express 4, 167 (1999).
2143