REinforcement learning based Adaptive
arXiv:1710.00495v1 [q-bio.BM] 2 Oct 2017
samPling: REAPing Rewards by Exploring Protein Conformational Landscapes Zahra Shamsi,† Kevin J. Cheng,‡ and Diwakar Shukla∗,¶,§,k †Department of Chemical and Biomolecular Engineering, University of Illinois at Urbana-Champaign, Urbana, IL 61801, USA ‡Center for Biophysics and Quantitative Biology, University of Illinois at Urbana-Champaign, Urbana, IL 61801, USA ¶Center for Biophysics and Quantitative Biology, University of Illinois at Urbana-Champaign, Urbana, IL §Department of Chemical and Biomolecular Engineering, University of Illinois at Urbana-Champaign, Urbana, IL kDepartment of Plant Biology, University of Illinois at Urbana-Champaign, Urbana, IL E-mail:
[email protected]
1
Abstract One of the key limitations of Molecular Dynamics simulations is the computational intractability of sampling protein conformational landscapes with either large system size or long timescales. To overcome this bottleneck, we present the REinforcement learning based Adaptive samPling (REAP) algorithm that aims to sample a landscape faster than conventional simulation methods by identifying reaction coordinates that are relevant for sampling the system. To achieve this, the algorithm uses concepts from the field of reinforcement learning (a subset of machine learning), which rewards sampling along important degrees of freedom and disregards others that do not facilitate exploration or exploitation. We demonstrate the effectiveness of REAP by comparing the sampling to long continuous MD simulations and least-counts adaptive sampling on two model landscapes (L-shaped and circular). We also demonstrate that the algorithm can be extended to more realistic systems such as alanine dipeptide and Src kinase. In all four systems, the REAP algorithm outperforms the conventional single long trajectory simulation approach as it is able to consistently discover more states as a function of simulation time.
Introduction Molecular dynamics (MD) simulations have rapidly advanced into an invaluable tool for understanding the structure-function relationship in biological molecules. 1–4 Although they aid our understanding of intricate biomolecular dynamics, the bottleneck lies in the amount of computational resources available to the researcher. In common practice, running MD simulations on non-specialized computing hardware allows for nanoseconds worth of data per day. 1 The reality is that the salient protein conformational changes occur at the microsecond to millisecond timescale; a three to six order of magnitude difference in terms of ns, 2 which can cost up to years worth of simulation when using continuous simulations. Examples include the transport cycle for membrane transporter proteins, 5,6 protein folding, 4,7–9 and
2
large-scale conformational changes involved in cell signaling. 1,10–16 A number of enhanced sampling methods have emerged to address this computational drawback of conventional simulations. In general, three classes exist among these methods: one class requires the specification of reaction coordinate i.e. a function of system degrees of freedom that guides the simulation to reach a desired end state by enhancing sampling along the reaction coordinate. This class of methods either biasing the underlying potential (e.g. steered MD, 17 metadynamics, 18 Temperature Accelerated MD, 19 umbrella sampling 20 ) or perform unbiased adaptive sampling using the reaction coordinate as metric. 21–23 The second class of techniques encourages exploration of the conformational landscape in all directions by modifying the overall Hamiltonian (e.g. accelerated MD, 24 replica exchange MD, 25 or weighted-ensemble simulations 26 ). Depending on the scientific goal, the usefulness of each class of techniques will differ. Several techniques exist that combine the ideas from the different class of methods to achieve enhanced sampling efficiency. For this paper, we will primarily focus on the issue with the first class of methods which entails the identification of the appropriate reaction coordinates. Essentially, this class of methods can only succeed by knowing which reaction coordinates are relevant for sampling a priori. In the context of biomolecular simulations, reaction coordinates are observables that capture the progress of proteins undergoing conformational change between different states. For instance, the distance between two residues can serve as reaction coordinates such that they only approach each other when the protein is in an activated state. These computational techniques work by sampling the conformational space preferentially along the reaction coordinate, essentially pushing the protein process towards some final state of interest. Reaction coordinates have proven useful for researchers as they help reduce the high dimensionality of the system. Since protein dynamics involves highly complex processes, it is desirable to project this high dimensional space onto reaction coordinates that simplify the simulation data without losing essential information about the conformational change
3
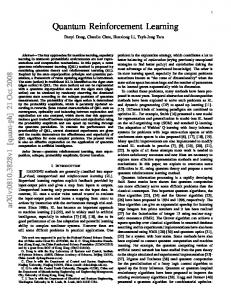
process. Furthermore, it is not uncommon to characterize the conformational dynamics as a projection onto two reaction coordinates (i.e. on 2-dimensional space), nonetheless, one is not limited to a 2-D projection, but is obviously preferred as it makes interpretation easier. This is especially useful if the protein under investigation undergoes a series of intermediate steps to achieve some final state. For instance, many protein kinases (proteins involved in signaling via phosphotransfer) only become active after two molecular events occur: the A-loop must unfold first, thus providing space for the αc-helix to rotate to form a K-E salt bridge. 16,27–29 In other words, while one reaction coordinate changes, the other remains relatively constant. Plotting the progression of these events gives rise to an “L-shaped” landscape. Furthermore, kinases are not the only biological systems that can be projected onto an L-shaped landscape using two reaction coordinates, these include membrane transporter proteins 30,31 and protein folding 1,4,8,9 (see Fig. 1 to visualize landscape). It is evident from these three landscapes that as one reaction coordinate is important for sampling, the other becomes less relevant. To illustrate this point concretely, consider the landscape associated with c-Src kinase activation. 16,27–29 If simulations started with a kinase in the deactivated state (Fig. 1 (a), top left), the optimal sampling strategy would be to first explore in the positive x direction (rightward) along the A-loop unfolding coordinate. Once state 2 has been reached, the x coordinate no longer becomes relevant for sampling (since the A-loop has completely unfolded) and now the y coordinate (the K-E bond distance) becomes the optimal direction to sample. By sampling along this L shape landscape, we can be assured that the most relevant protein conformations have been sampled, i.e. the complete kinase activation cycle. However, the only reason the optimal directions are known beforehand is from closely examining differences between crystal structures captured in various states. If in this example the protein were sampled without well-established structural information, the only option is to use a brute-force approach by which the landscape must be explored in all directions when there is clearly an optimal path in this case. The concept of optimal sampling along some reaction coordinate has led us to develop
4
Figure 1: The above figures illustrate that three significant biological processes can be projected onto an L-shaped landscape given the selection of appropriate reaction coordinates. These include: (a) The activation process in kinases, (b) transport cycle for transporter proteins, and (c) protein folding. In (a), the inactive kinase state is denoted as state 1, the intermediate state as 2, and the activated state as 3. the REAP (REinforcement learning based Adaptive samPling) algorithm that is “smart” enough to determine the importance of each reaction coordinate as it explores the landscape. Reinforcement learning (RL) constitutes a significant aspect of the artificial intelligence field with numerous applications ranging from finance to autonomous vehicles. 32 It is based on the Pavlovian conditioning and control theory, where the feedback from the environment is learned to maximize the accumulated award. 33 REAP takes principles from the field of RL 34,35 by which an agent (or learning system) takes actions in an environment to maximize a reward function. In this study, the action is picking new structures to start a swarm of simulations, while the reward is a mathematical function proportional to how far new protein configurations travel on the landscape . The agent keeps track of which direction accumulates the most reward during the algorithm, allowing it to learn which reaction coordinate is most relevant for exploration. In other words, the agent attempts to find the path of least resistance. The REAP algorithm builds upon count-based adaptive sampling method. Both methods perform the following: 1) Run a series of short MD simulations from a collection of starting structures. 2) Cluster the proteins based on reaction coordinates of interest. 3) Pick
5
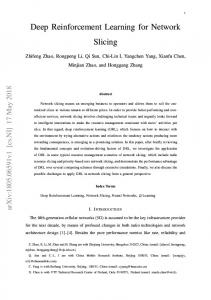
Figure 2: (a) The ’I’ (Illinois) landscape illustrates that the local optimal sampling strategy changes depending which basin that is currently being sampled (each labeled 1, 2, and 3). The importance of each reaction coordinate is denoted as weights that are updated in each iteration of the REAP algorithm, WX and WY . (b) Given that sampling occurs in basin 2, the orange regions shows structures selected from count based sampling are not optimal for reaching basin 3. Instead, REAP is able to identify the appropriate structures (white circular highlight) that facilitate sampling along Y, eventually reaching basin 3. structures from these clusters according to some sampling criterion to start new simulations. The difference between these methods resides in step 3, least count based adaptive sampling chooses new structures based on least populated states, while REAP chooses new structures based on a reward function. This reward function is dependent on weights (a parameter representing how important a reaction coordinate is) and how on the landscape the new simulation data samples compared to the current data. The advantage of REAP over adaptive sampling is that it decreases the chance of choosing structures for the next round of simulations that are irrelevant for sampling given the current state. Consider the ‘I’ (Illinois) potential in Fig. 2 (a) where the importance of the reaction coordinates X and Y changes in each basin. In the situation, where sampling occurs in basin 2, a count-based 21,23 adaptive sampling would give equal importance to both X and Y, allowing structures in the orange regions to be chosen for the next round of sampling. The disadvantage is that a lot of these structures are irrelevant towards reaching the final area of sampling, basin 3. The REAP algorithm is able to identify that the most important structures, that is, the white 6
highlighted region (Fig 2 (b)) since they facilitate sampling along the Y direction. Hence, the methodology of picking starting structures for new simulations becomes guided and rational, effectively saving precious computational resources for the user. The use of reward functions to increase the efficiency of sampling has been implemented in other studies as well. For example, Zimmerman and Bowman 36 have developed a goaloriented sampling method to search conformational space for structures with desirable observables. The reward function in this case is maximized by taking the gradient of the structural metric of interest. Furthermore, Perez et al. 37 have used the concept relevant to RL such as “explore-and-exploit” 38 to enhance conformational exploration using data derived from experiments. REAP differs from both of these methods since it does not require modification of the original Hamiltonion or a priori information regarding which physical properties should be maximized or minimized such as RMSD, residue pair distance, solvent accessible area, etc. The only input needed is a list of possible reaction coordinates. REAP can then inform the user which reaction coordinates reap the most rewards from exploring the landscape. In particular, the output of REAP can quantify which K reaction coordinates are most relevant for sampling a landscape. This paper discusses and outlines the basic algorithm of REAP, then evaluates its performance using two idealized potentials; an L and a circular landscape. The REAP algorithm is then applied to alanine dipeptide MD simulations and Src kinase. The kinase system was generated using a kinetic monte carlo sampling scheme based on markov state models obtained from previous works. 27 In every system, we demonstrated the algorithms ability to explore the landscape more efficiently than conventional continuous simulations by showing that the rate of discovering new conformational states is always greater when utilizing the REAP algorithm.
7
REAP Algorithm Here, we present each steps involved in the implementation of the REAP algorithm. We also introduce the RL concept of a policy which defines the agent’s way of behaving at a given time. In a mathematical sense, the policy π is the mapping between “states” belonging to the environment and “actions” to achieve the agent’s goal π : S → A. Put differently, the policy tells the agent how to behave at any point in time. The environment is defined as the landscape that is to be explored; with the state S defined as the set of all discovered points on the landscape or simply the current data available. The action A is defined as the agent choosing protein structures to run more simulations on. The user can provide different policies which differ in the reaction coordinates provided. By employing the sampling algorithm below, the user can evaluate which of these different policies ensures the most reward while sampling and then evaluate which reaction coordinates are relevant for sampling. To avoid any misunderstanding, the definition of “states” (S) here should not be confused with the common usage familiar to biophysicists to represent one particular protein configuration. 1. Identify some sampling policy πK and its corresponding set of reaction coordinates K = {θ1 , θ2 , . . . , θk }. These reaction coordinates could be based on known or likely reaction coordinates associated with the conformational transition under investigation. Each policy differs depending on the set of reaction coordinates and how new protein structures are chosen for each round of simulation. In our implementation for this work, the sampling policy involves choosing structures based on least populated clusters (performed at step 5, denoted as Cp ) and the reward function of each cluster (Eq. 1) 2. Set the weight wi for each θi ∈ K where wi ∈ [0, 1]. The initialization of each wi signifies which reaction coordinate θi is important for the first round of sampling. Of course, if no prior knowledge is available regarding the importance of each weight, each wi can be fixed to the constant value of 1/k, where k is the total number of reaction coordinates for the given policy πK . Every iteration of this algorithm produces a new 8
state S (the set of all discovered points), and since wi is different for each S, we will introduce new notation for the weights wiS . 3. Run simulations to generate a series of initial structures. This can be obtained either from a single trajectory, or from running short simulations from multiple structures that can be obtained from homology modeling, crystal structures, biased MD methods etc. 4. Cluster the data S into a set of L clusters C = {c1 , c2 , . . . , cL }. For each cluster cj ∈ C, identify all the structures that are closest to the cluster cj . The user could also assign a representative structure to each cluster e.g the centroid of each cluster. The goal of this step is to reduce the data size by clumping together structures in reaction coordinate space. Nonetheless, the clustering method can be arbitrarily chosen during this step. 5. Identify the set of clusters Cp ⊂ C which contain the top least number of data points. The cardinality (size) of Cp is at the discretion of the user. As mentioned in step 1, the set Cp can be obtained using a different criteria. 6. Given the set of K reaction coordinates for policy πK , calculate the reward for each cm ∈ C p .
rK (cm ) =
k X
wiS
i=1
| (θi (cm ) − hθi (C)i | σi (C)
(1)
Where wiS represents the weight or importance of each reaction coordinate for a given set of discovered points SRL , θi (cm ) is the reaction coordinate calculated for the cluster cm , hθi (C)i is the arithmetic mean of θi for all cj ∈ C, and σi (C) represents the standard deviation of θi for all cj ∈ C. Vertical bars indicate the absolute value being taken.
9
7. Calculate the cumulative reward.
R(Cp ) =
|Cp | X
rK (cm )
(2)
m=1
Where the sum is over each element in the set Cp , and | Cp | is cardinality of Cp . 8. The next step is to maximize Eq. 2 by tuning the parameter wiS . This can be achieved by choosing from a myriad of optimization algorithms already implemented. In our case, we took advantage of the SciPy python library 39 and used the Sequential Least SQuares Programming (SLSQP) 40 to find the optimal weights that maximize the cuP mulative reward. We also constrained the weights given that i wi = 1. Given the updated weights, step 6 is repeated to find the new rewards 9. Choose the structures from the clusters that give the highest reward to start new simulations given the updated weights. The two additional parameters, structures and clusters chosen with the highest reward, is up to discretion of the user. 10. Repeat steps 3-8 until the user deems the sampling is sufficient enough. The primary reason for using least count adaptive sampling as specified in step 4 is because it is widely considered as the most efficient strategy for exploration of free energy landscapes. 21–23 Even if the reward function cannot properly assign rewards to states to achieve optimal sampling, the least-count adaptive sampling protocol will still be used. The crucial step in this algorithm is step 8, which estimates the relative importance of these reaction coordinate as the agent explores the landscape. If, for example, some θi is provided that gives poor information on conformational changes (i.e. changes little for each round of simulations), the weights will eventually drop to zero from the optimization step. This essentially informs the user that the reaction coordinate is not important for understanding the conformational changes of the protein. In theory, one can provide different policies πK with the same reward function to determine which reaction coordinates are most relevant 10
for sampling by simply looking how each wi changes over time.
Applications to Model Potentials L-Shaped Potential To demonstrate that the REAP algorithm outperforms other sampling strategies, we will first consider an idealized system by which the time-evolution of two reaction coordinates, X and Y, are governed by the overdamped Langevin equation:
p r˙ (t) = −1/γ∇V (r(t)) + η(t) 2β −1 γ
(3)
Here, r˙ (t) denote time derivatives of the position vector r, ∇ is the gradient operator, γ is the friction coefficient, β = 1/kB T where kB is the Boltzmann constant and T is the temperature in Kelvin, η(t) represents a random force that models the collisions of molecules in a fluid. The random force obeys a Gaussian distribution with a zero mean and satisfies the following autocorrelation condition hηi (t)ηj (t0 )i = δij δ(t − t0 ). 41 The goal is to study the performance of this sampling method for a model potential representing landscapes common in protein conformational change, such as ion transports, activation processes, and protein folding (see Fig. 1 for examples). We will first assume that the potential is L-shaped with five metastable states, i.e. long-lived intermediate states between the initial and final state. To compare each sampling method, we performed the exact same amount of simulation time on the L-shaped landscape for each sampling procedures; traditional simulation (single long trajectory), least count based adaptive sampling, and the REAP algorithm 42 (Fig. 3 (a), (b), (c) respectively.). All three simulations were initiated at the bottom right corner of the landscape ( point (1.1 , 0) in Fig. 3). These model simulations clearly demonstrate the advantage of using REAP for exploring the landscape. This is due to the algorithms ability to quickly identify the important directions of sampling. These
11
Figure 3: Regions sampled using (a) single long trajectory, (b) least count based adaptive sampling, and (c) REAP algorithm methods performed on L-shaped potentials are shown with white circles on top of the potential. The white circles represents a data point generated from Eq. 3 (d) Weights for each reaction coordinate signify the importance of each reaction coordinate depending on the round number (or iteration of the algorithm). The fluctuations of weights show that the algorithm is able to identify the importance of each weight. For more information on what the weights signify, see step 2 in the REAP Algorithm section. (e) A plot of the number of states discovered as a function of simulation time showing that trajectories generated from REAP are far more efficient at discovering states. directions are quantified as weights for each reaction coordinate (see Eq. 1), facilitating immediate exploration to the left. This learning of directional importance can be visualized by looking at the change in weight values over time (see Fig. 3 (d)). In the first rounds of simulations, both X and Y directions are equally important (Fig. 3 (d) up to round 10) as sampling in all directions gives equal rewards. It is not until trajectories reach the high energy states in the Y direction, where the X direction now becomes more rewarding than 12
Y. As a result, the X weight increases while the Y weight decreases. When the trajectories reach the point where X no longer becomes rewarding near round 300 (point (0, 0) in Fig. 3 (c)), then the X weight decreases and Y weight dramatically increases until the trajectories reach the fifth basin (top left corner, point (0, 1.1) in Fig. 3 (c)). Upon examining the performance of the traditional long simulation, we found that the simulations were unable to overcome the first barrier of the metastable state in the given simulation time (Fig. 3 (a)). Simulations using the adaptive sampling method demonstrates slightly more exploration than conventional MD (Fig. 3 (b)). Given these model simulations, REAP demonstrably provides efficient sampling of the landscape. To quantify the performance of the algorithm compared to single long trajectories, we plotted the total number of discovered states as a function of simulation time (Fig. 3 (e)). The single long trajectory approach demonstrates a nearly constant curve around 50 states, indicating that the system reached a metastable basin that was difficult to exit. On the other hand, the REAP trajectories show a monotonically increasing curve of greater slope which demonstrates it had relatively less difficulty overcoming these basins. Given this data, it is clear that the REAP algorithm outperforms the long simulation approach for this particular landscape.
Circular Potential In the second model system, we tested the performance of the algorithm in which there is no important direction of sampling at any given time. Thus, we considered a single circular potential with a single metastable state. The reason for choosing this model potential is to show that the REAP algorithm performance is the same as the least-count adaptive sampling for a system with no preferred direction of sampling. The dynamics were governed by Eq. 3 with a single circular metastable state (Fig. 4). We performed three sampling procedures (traditional single long, least count based adaptive sampling and REAP) with the same amount of sampling. The majority of generated points from traditional single long simulation and least count adaptive sampling were mostly confined to the stable basin 13
(Fig. 4 (a) and (b)) while the REAP algorithm explored more regions of the landscape (Fig. 4 (c)). The trajectories using REAP demonstrated some directionality, attempting to sample one direction at a time. We found that the performance on the L-shaped landscape exceeds that of the circular landscape. This is evident by visually inspecting how REAP outperforms the other two sampling methods in the L-shaped landscaped, compared to the circular landscape. The difference is more pronounced in the former relative to the latter. This is due to the directional nature of this algorithm; at any given time, one reaction will have more weight given to than the other (only considering the 2D case). This is also evident from the oscillation of weights shown in Fig. 4 (d). We additionally show how the REAP algorithm fares against a single trajectory approach. In Fig. 4 (e), the number of discovered states remains the same until 2500 simulation time units. At this point, the two curves diverge as the slope of the single trajectory curve decreases and the REAP trajectory remains greater and nearly constant. Again, the REAP algorithm overall is more efficent at finding new states than that of the long simulation approach.
Alanine Dipeptide To illustrate that our algorithm remains effective when using MD to sample, we applied the REAP algorithm to alanine dipeptide. We performed a total of 2 ns simulations to sample the dihedral angle landscape with a single long trajectory and compared it with the sampling achieved from REAP (Fig. 5 (a) and (b)). Details regarding simulations are as follows: the starting structure of alanine dipeptide was obtained from the Python package MSMBuilder 3.8. 43 The simulation was carried out using OpenMM. 44 The AMBER99SB forcefield 45 was used along with the TIP3P 46 water model. A cubic box with periodic boundaries was employed to model bulk solvent. The final system consisted of 1831 atoms and simulated at temperature of 300 K while using a Langevin integrator to propagate particle motion and regulate temperature. A friction coefficient of 1.0 / ps. A Monte Carlo barostat 47 was used to maintain a pressure of 1 bar. To deal with long range interactions, a nonbonded cutoff 14
Figure 4: The Regions sampled using (a) single long trajectory, (b) least count based adaptive sampling, and (c) REAP algorithm methods performed on circular potentials are shown with white circles on top of the potential. The white circles represents a data point generated from Eq. 3 (d) Weights for each reaction coordinate signify the importance of each reaction coordinate depending on the round number (or iteration of the algorithm) (e) A plot of the number of states discovered as a function of simulation time. Initially both methods find new states at the same rate (same slope) until 2500. At this point, both curves diverge with the single trajectory approach decreasing in number of discovered states as a function of time. Overall, the REAP algorithm still performs better than the single trajectory method. of 10 ˚ A was used with the Particle Mesh Ewald (PME) 48 method to calculate long distance interactions. The system was initially minimized for 1 ps (500 steps) then equilibrated for 200 ps. A total of 2 ns was generated from production MD runs. Trajectories were saved every 0.1 ps . A timestep of 2 fs and hydrogen bonds were constrained for the entire simulation. Simulations started from the most stable state of the peptide with (-π/2, π) (Fig. 5). After 2 ns, the conventional long simulation of alanine dipeptide capture two metastable state 15
Figure 5: (a) Single long trajectory of alanine dipeptide samples two stable states within 2 ns MD simulation, while (b) the REAP algorithm is able to explore regions outside of these two metastable regions within same amount of simulation time. in the landscape of dihedral angles, but fails to sample new metastable states that have been revealed in other enhanced sampling methods (Fig. 5 (a) compared to (b)). 49 Conversely, the REAP algorithm is able to overcome the large barriers associated with sampling these new regions in the span of 2 ns (Fig. 5 (b)). In terms of directionality, the algorithm initially starts to φ direction, but quickly learns that the reaction coordinate that is best to sample along is along the ψ coordinate(Fig. 6). This change in weights effectively allowed the discovery of new regions along ψ. At the second intersection shown in the plot in Fig. 6 near round number 800 , the least-counts sampling built into REAP (step 5) allows for sampling of an entirely new region (with φ taking a value near π/4). The plot in Fig. 6 (b) illustrates that the REAP algorithm is most efficient at sampling the landscape when compared to conventional MD simulations. This plot shows that the REAP (blue curve) algorithm can find more conformational states given the same total simulation time of 2 ns. At 1.7 ns, the slope of the REAP curve shows a dramatic increase, while the single trajectory curve’s slope slightly increases. In general, the REAP trajectory discovers more states than conventional MD at almost every point in 16
Figure 6: (a) The weights corresponding to alanine dipeptide reaction coordinates (φ and ψ) change over each simulation round. As a result, these change in weights demonstrate how the algorithm identifies important direction of sampling as it explores the landscape (b) A plot of number of discovered states vs. simulation time in ns is shown. The blue curve represents newly discovered conformational states using the REAP algorithm while the red curve represents new states using a single trajectory approach (conventional MD). This figure illustrates that the REAP algorithm, again, outperforms the the single-trajectory approach. time.
Src Kinase We additionally demonstrated that the REAP algorithm is also efficacious in a protein system that has implications in cancer drug discovery. To provide some background, protein kinases are a famaily of enzymes that catalyze the transfer of phosphate group to serine, threonine, or tyrosine residues. 27,50,51 When the activity of this kinase becomes deregulated (perhaps due to a genetic mutation), it can cause uncontrolled cell proliferation leading to tumor development. Extensive analysis has been done previously using markov state models (MSMs) 3,52 to characterize the kinase dynamics. 27 Furthermore, it has been shown that the conformational dynamics can be projected onto an L-shaped landscape. 16,27 This system is therefore well suited to show that our algorithm is not only successful in a model system, 17
Figure 7: (a) The simulation data of Src kinase using a single trajectory approach is plotted using two reaction coordinates: K-E distances and RMSD of the A-loop. Simulations started in the inactive conformation and ran for a total time of 15 µs. The single trajectory approach was able sample both the inactive and intermediate conformations, but unable to overcome the energetic barrier to reach the active kinase configuration (b) This plot shows how the REAP sampling algorithm outperforms that of the single trajectory approach in (a). The algorithm was able to facilitate sampling of the active kinase conformation. but in realistic biomolecular systems. Using the same MSM from this work, we generated trajectories using what is called kinetic monte carlo (KMC) sampling. This sampling scheme uses the kinetics derived from the MSM to stochastically propogate the dynamics over time (as opposed to integrating Newton’s laws of motion). We used the python package MSMBuilder version 3.6 43 to carry out our stochastic simulations. Using KMC, we generated 15 µs of long continuous simulations and compared that to using the REAP algorithm. All of the simulations started from the same MSM state (the inactive kinase conformation), and we showed that the long simulation approach could not sample the active state within the given amount of time (Fig. 7 (a)). On the other hand, the REAP sampling approach was able to discover an entirely new area of the landscape corresponding to the active kinase conformation (Fig. 7 (b)). A plot of the weights fluctuating are shown in Fig. 8 (a) showing how the algorithm initially finds sampling in Y more important than X (round 20-40). Then at round 50, the 18
importance of weights immediately changes to X, sampling along the X reaction coordinate (RMSD of A-loop) to discover the intermediate kinase conformation. Near round 125, the importance of weights alternate in which the Y coordinate (K-E distance) now becomes important so that the active conformation can be sampled. The efficacy of the REAP algorithm is demonstrated in Fig. 8 (b) which shows a plot of the number of discovered states as a function of simulation time. The REAP algorithm consistently performs better than the single trajectory simulation approach. This is clearly shown by looking at the slope of each curve which can be interpreted as the rate of discovering new states. The blue curve (REAP trajectories) generally displays a larger slope at any point along the curve compared to the red (single long trajectory). It is evident from this data that REAP is the preferred method to discover new conformations along the landscape as opposed to conventional methods.
Figure 8: (a) Weights for each reaction coordinate signify the importance of each reaction coordinate depending on the round number (or iteration of the algorithm) (b) In this protein system, the REAP algorithm (blue curve) shows a significantly better performance than the the single trajectory approach (red curve) in terms of discovering more states.
19
Conclusion The proposed algorithm, REAP, has been shown to efficiently sample landscapes in the case of both model potentials (L-shaped, circular), alanine dipeptide, and Src kinase. It achieves this by identifying which reaction coordinates maximizes a reward function that encourages exploratory behavior. This is mathematically represented as weights and we have demonstrated that the algorithm is able to determine which reaction coordinates are preferrable while exploring the conformational landscape. In all systems that were studied, sampling using REAP always outperformed the conventional long simulation approach in terms of discovering new states as a function of simulation time. Regarding algorithm improvement, it is possible to introduce multiple structures at different positions along the landscape, essentially allowing the simulations to be explored from different starting points. This idea is motivated from the concept of “multi-agent reinforcement learning” 53–55 by which agents can either interact in a cooperative or competitive fashion. The biggest drawback of REAP is that the selection of initial reaction coordinates will most likely depend on structural or biophysical data. However, the algorithm allows for a use of a large number of reaction coordinates and the algorithm reduces the weight associated with the fast directions to zero within a few rounds of sampling. Another possible way of choosing reaction coordinates is using the approach outlined by Tajkhorshid and coworkers that involves estimating the work done by performing short pulling simulations along the reaction coordinate directions associated with the conformational change process. 6,56 If none are available, then one possibility is to use evolutionary coupling (EC) pairs 57 as reaction coordinates (distance between residues that evolve together over time) as reaction coordinates for the given sampling policy. Recent work from our research group 58 has shown that using 800 EC distances as a criteria for least-counts adaptive sampling can enhance the exploration of the landscape. Given that the REAP algorithm uses this count based sampling strategy, we expect that using ECs as reaction coordinates for REAP will not only sample the landscape faster, but also 20
differentiate between ECs that are actually relevant for conformational dynamics from those that are only important for protein folding. The separation between these two types of EC is still an open scientific question to the community. We believe this algorithm will be particularly beneficial for those interested in building MSMs. This is because it uses the swarm of simulation approach, which essentially runs many small trajectories in parallel. MSMs are the preferred theoretical framework at the moment to merge these discontinuous simulations and accurately reproduce the same observables as traditional MD. Additionally, REAP has advantages other than building MSMs. The principle challenge with most biased MD methods is that the original Hamiltonian is altered to preferentially sample some subset of the high dimensional space of proteins. The result of this alteration will then modify the probability distributions of protein configurations, with the possibility of favoring states that are less likely in actual biological systems. Therefore, observations on the dynamics of these biased simulations may not be useful for predicting the detailed kinetic or thermodynamic mechanism of conformational change in proteins.
Acknowledgement Authors acknowledge the Blue Waters sustained-petascale computing project, which is supported by the National Science Foundation (awards OCI-0725070 and ACI-1238993) and the state of Illinois. Z.S. was supported by the Widiger and 3M fellowships from the Department of Chemical & Biomolecular Engineering at University of Illinois, Urbana-Champaign, USA. K.J.C. is supported by the Ford Foundation fellowship from the National Academies of Arts, Sciences and Medicine. We also thank Stanford Digital Repository for providing the Src kinase MD simulation data.
21
References (1) Dror, R. O.; Dirks, R. M.; Grossman, J.; Xu, H.; Shaw, D. E. Biomolecular simulation: a computational microscope for molecular biology. Annu. Rev. Biophys. 2012, 41, 429– 452. (2) Adcock, S. A.; McCammon, J. A. Molecular dynamics: survey of methods for simulating the activity of proteins. Chem. Rev. 2006, 106, 1589–1615. (3) Shukla, D.; Hern´andez, C. X.; Weber, J. K.; Pande, V. S. Markov State Models Provide Insights into Dynamic Modulation of Protein Function. Acc. Chem. Res. 2015, 48, 414– 422. (4) Lane, T.; Shukla, D.; Beauchamp, K.; Pande, V. To milliseconds and beyond: challenges in the simulation of protein folding. Curr. Opin. Struct. Biol. 2013, 23, 58–65. (5) Jiang, J.; Shrivastava, I. H.; Watts, S. D.; Bahar, I.; Amara, S. G. Large collective motions regulate the functional properties of glutamate transporter trimers. Proc. Natl. Acad. Sci. USA 2011, 108, 15141–15146. (6) Moradi, M.; Tajkhorshid, E. Mechanistic picture for conformational transition of a membrane transporter at atomic resolution. Proc. Natl. Acad. Sci. U.S.A. 2013, 110, 18916–18921. (7) Lindorff-Larsen, K.; Piana, S.; Dror, R. O.; Shaw, D. E. How fast-folding proteins fold. Science 2011, 334, 517–520. (8) Voelz, V.; Bowman, G.; Beauchamp, K.; Pande, V. Molecular Simulation of ab Initio Protein Folding for a Millisecond Folder NTL9 (1- 39). J. Am. Chem. Soc. 2010, 132, 1526–1528. (9) Lapidus, L. J.; Acharya, S.; Schwantes, C. R.; Wu, L.; Shukla, D.; King, M.; De-
22
Camp, S. J.; Pande, V. S. Complex pathways in folding of protein G explored by simulation and experiment. Biophys. J. 2014, 107, 947–955. (10) Lemmon, M. A.; Schlessinger, J. Cell signaling by receptor tyrosine kinases. Cell 2010, 141, 1117–1134. (11) Kohlhoff, K.; Shukla, D.; Lawrenz, M.; Bowman, G.; Konerding, D. E.; Belov, D.; B., A. R.; Pande, V. S. Cloud-based simulations on Google Exacycle reveal ligand modulation of GPCR activation pathways. Nat. Chem. 2014, 6, 15–21. (12) Lawrenz, M.; Shukla, D.; Pande, V. S. Cloud computing approaches for prediction of ligand binding poses and pathways. Scientific Reports 2015, 5 . (13) Shukla, D.; Lawrenz, M.; Pande, V. S. Elucidating Ligand-Modulated Conformational Landscape of GPCRs Using Cloud-Computing Approaches. Methods Enzymol. 2015, 557, 551–572. (14) Shukla, D.; Peck, A.; Pande, V. S. Conformational heterogeneity of the calmodulin binding interface. Nat. Commun. 2016, 7 . (15) Vanatta, D. K.; Shukla, D.; Lawrenz, M.; Pande, V. S. A network of molecular switches controls the activation of the two-component response regulator NtrC. Nat. Commun. 2015, 6, 7283. (16) Moffett, A. S.; Bender, K. W.; Huber, S. C.; Shukla, D. Molecular dynamics simulations reveal the conformational dynamics of Arabidopsis thaliana BRI1 and BAK1 receptorlike kinases. J. Biol. Chem. 2017, 292, 12643–12652. (17) Grubm¨ uller, H.; Heymann, B.; Tavan, P. Ligand binding: molecular mechanics calculation of the streptavidin-biotin rupture force. Science 1996, 271, 997–999. (18) Huber, T.; Torda, A. E.; van Gunsteren, W. F. Local elevation: A method for improving
23
the searching properties of molecular dynamics simulation. J. Comput.-Aided Mol. Des. 1994, 8, 695–708. (19) Abrams, C. F.; Vanden-Eijnden, E. Large-scale conformational sampling of proteins using temperature-accelerated molecular dynamics. Proc. Natl. Acad. Sci. USA 2010, 107, 4961–4966. (20) K¨astner, J. Umbrella sampling. Wiley Interdiscip. Rev.: Comput. Mol. Sci. 2011, 1, 932–942. (21) Weber, J.; Pande, V. Characterization and Rapid Sampling of Protein Folding Markov State Model Topologies. J. Chem. Theory Comput. 2011, 7, 3405–3411. (22) Bowman, G.; Ensign, D.; Pande, V. Enhanced modeling via network theory: Adaptive sampling of markov state models. J. Chem. Theory Comput. 2010, 6, 787–794. (23) Singhal, N.; Snow, C.; Pande, V. Using path sampling to build better Markovian state models: Predicting the folding rate and mechanism of a tryptophan zipper beta hairpin. J. Chem. Phys. 2004, 121, 415. (24) Hamelberg, D.; Mongan, J.; McCammon, J. A. Accelerated molecular dynamics: a promising and efficient simulation method for biomolecules. J. Chem. Phys. 2004, 120, 11919–11929. (25) Sugita, Y.; Okamoto, Y. Replica-exchange molecular dynamics method for protein folding. Chem. Phys. Lett. 1999, 314, 141–151. (26) Huber, G. A.; Kim, S. Weighted-ensemble Brownian dynamics simulations for protein association reactions. Biophys. J. 1996, 70, 97–110. (27) Shukla, D.; Meng, Y.; Roux, B.; Pande, V. S. Activation pathway of Src kinase reveals intermediate states as targets for drug design. Nat. Commun. 2014, 5 .
24
(28) Meng, Y.; Roux, B. Locking the Active Conformation of c-Src Kinase through the Phosphorylation of the Activation Loop. Journal of Molecular Biology 2014, 426, 423– 435. (29) Meng, Y.; Shukla, D.; Pande, V. S.; Roux, B. Transition path theory analysis of c-Src kinase activation. Proc. Natl. Acad. Sci. USA 2016, 201602790. (30) Chen, L.-Q.; Cheung, L. S.; Feng, L.; Tanner, W.; Frommer, W. B. Transport of Sugars. Annu. Rev. Biochem. 2015, 84, 865–894. (31) Wang, K. H.; Penmatsa, A.; Gouaux, E. Neurotransmitter and psychostimulant recognition by the dopamine transporter. Nature 2015, 521, 322. (32) Wulfmeier, M.; Rao, D.; Wang, D. Z.; Ondruska, P.; Posner, I. Large-scale cost function learning for path planning using deep inverse reinforcement learning. Int. J. Rob. Res. 2017, 027836491772239. (33) Shamsi, Z.; Shahrokhi, M. Controller Design for Processes with Unknown Dynamics and Input Nonlinearity with Applications to Bioreactors. Industrial & Engineering Chemistry Research 2016, 55, 2584–2593. (34) Szepesv´ari, C. Algorithms for reinforcement learning. Morgan & Claypool Publishers, 2010. (35) Gosavi, A. Reinforcement learning: A tutorial survey and recent advances. INFORMS J Comput 2009, 21, 178–192. (36) Zimmerman, M. I.; Bowman, G. R. FAST Conformational Searches by Balancing Exploration/Exploitation Trade-Offs. J. Chem. Theory Comput. 2015, 11, 5747–5757. (37) Perez, A.; Morrone, J. A.; Dill, K. A. Accelerating physical simulations of proteins by leveraging external knowledge. Wiley Interdiscip. Rev. Comput. Mol. Sci. 2017, e1309.
25
(38) Berry, D. A.; Chen, R. W.; Zame, A.; Heath, D. C.; Shepp, L. A. Bandit problems with infinitely many arms. Ann. Stat. 1997, 2103–2116. (39) Jones, T. P. P., E.; Oliphant SciPy: Open source scientific tools for Python. 2001– Present; http://www.scipy.org/. (40) Kraft, D. A software package for sequential quadratic programming. DFVLR, 1988. (41) Fogedby, H. C. Langevin equations for continuous time L´evy flights. Phys. Rev. E 1994, 50, 1657. (42) Weber, J. K.; Pande, V. S. Characterization and rapid sampling of protein folding Markov state model topologies. J. Chem. Theory Comput. 2011, 7, 3405–3411. (43) Harrigan, M. P.; Sultan, M. M.; Hern´andez, C. X.; Husic, B. E.; Eastman, P.; Schwantes, C. R.; Beauchamp, K. A.; McGibbon, R. T.; Pande, V. S. MSMBuilder: Statistical Models for Biomolecular Dynamics. Biophys. J. 2017, 112, 10–15. (44) Eastman, P.; Swails, J.; Chodera, J. D.; McGibbon, R. T.; Zhao, Y.; Beauchamp, K. A.; Wang, L.-P.; Simmonett, A. C.; Harrigan, M. P.; Stern, C. D. et al. OpenMM 7: rapid development of high performance algorithms for molecular dynamics. PLoS Comput. Biol. 2017, 13, e1005659. (45) Hornak, V.; Abel, R.; Okur, A.; Strockbine, B.; Roitberg, A.; Simmerling, C. Comparison of multiple Amber force fields and development of improved protein backbone parameters. Proteins Struct. Funct. Bioinf. 2006, 65, 712–725. (46) Mark, P.; Nilsson, L. Structure and dynamics of the TIP3P, SPC, and SPC/E water models at 298 K. J. Phys. Chem. A 2001, 105, 9954–9960. (47) Chow, K. H.; Ferguson, D. M. Isothermal-isobaric molecular dynamics simulations with Monte Carlo volume sampling. Comput. Phys. Commun. 1995, 91, 283–289.
26
(48) Darden, T.; York, D.; Pedersen, L. Particle mesh Ewald: An N??? log (N) method for Ewald sums in large systems. J. Chem. Phys. 1993, 98, 10089–10092. (49) Yang, Y. I.; Zhang, J.; Che, X.; Yang, L.; Gao, Y. Q. Efficient sampling over rough energy landscapes with high barriers: A combination of metadynamics with integrated tempering sampling. J. Chem. Phys. 2016, 144, 094105. (50) Shan, Y.; Gnanasambandan, K.; Ungureanu, D.; Kim, E. T.; Hammar´en, H.; Yamashita, K.; Silvennoinen, O.; Shaw, D. E.; Hubbard, S. R. Molecular basis for pseudokinase-dependent autoinhibition of JAK2 tyrosine kinase. Nat. Struct. Mol, Biol. 2014, 21, 579–584. (51) Lin, Y.; Meng, Y.; Jiang, W.; Roux, B. Explaining why Gleevec is a specific and potent inhibitor of Abl kinase. Proc. Natl. Acad. Sci. U.S.A. 2013, 110, 1664–1669. (52) Pande, V.; Beauchamp, K.; Bowman, G. Everything you wanted to know about Markov State Models but were afraid to ask. Methods 2010, 52, 99–105. (53) Watkins, C. J.; Dayan, P. Q-learning. Machine Learning 1992, 8, 279–292. (54) Littman, M. L. Markov games as a framework for multi-agent reinforcement learning. Proceedings of the Eleventh International Conference On Machine Learning. 1994; pp 157–163. (55) Hu, J.; Wellman, M. P. Multiagent reinforcement learning: theoretical framework and an algorithm. International Conference on Machine Learning. 1998; pp 242–250. (56) Li, J.; Wen, P.-C.; Moradi, M.; Tajkhorshid, E. Computational characterization of structural dynamics underlying function in active membrane transporters. Curr. Opin. Struct. Biol. 2015, 31, 96–105. (57) Hopf, T. A.; Sch¨arfe, C. P.; Rodrigues, J. P.; Green, A. G.; Kohlbacher, O.; Sander, C.;
27
Bonvin, A. M.; Marks, D. S. Sequence co-evolution gives 3D contacts and structures of protein complexes. Elife 2014, 3, e03430. (58) Shamsi, Z.; Moffett, A.; Shukla, D. Enhanced Unbiased Sampling of Protein Dynamics using Evolutionary Coupling Information. Sci. Rep. 2017, 5, doi: 10.1038/s41598-01712874-7.
28