Materials Science Forum Vols. 558-559 (2007) pp. 71-76 online at http://www.scientific.net © (2007) Trans Tech Publications, Switzerland
Relation between Ridging and Texture Components in Al-Mg-Si Alloy Ken-ichi Ikeda1, a, Takahiro Yoshihara2, Naoki Takata3, b and Hideharu Nakashima1, c 1
Faculty of Engineering Sciences, Kyushu University, Kasuga, Fukuoka, 816-8580, JAPAN 2
Interdisciplinary Graduate School of Engineering Sciences, Kyushu University, Kasuga, Fukuoka, 816-8580, JAPAN [Present Address: Toyota Motor Corporation]
3
Interdisciplinary Graduate School of Engineering Sciences, Kyushu University, Kasuga, Fukuoka, 816-8580, JAPAN [Present Address: Osaka University, Suita, Osaka, 567-0871, JAPAN]
a
[email protected],
[email protected],
[email protected]
Keywords: Al-Mg-Si alloy, ridging, texture, recrystallization, SEM/EBSD.
Abstract. Al-Mg-Si alloy is the suitable material for the automotive body application. However, it is found that a rope-like profile (ridging) develops when the Al-Mg-Si alloy sheet is stretched along the transverse direction. In this study, in order to clarify the formation process of ridging developed in Al-Mg-Si alloy, the relation between ridging and texture components of the sheet was investigated by 3D profile microscope and SEM/EBSD method. It was found that the ridging developed remarkably in the hot-rolled (at higher temperature) and annealed sheets. In ridging sample, there was the band of cube oriented grains (cube band). It was also found that the region of cube band corresponded to the ridges and valleys which caused a rope-like profile in the sheets. It could be thought that the difference of plastic deformability between cube-oriented grains and other oriented grains led to the development of ridging. This assumption is supported by the lower Taylor factor of cube oriented grains than other oriented grains. From these results, it was concluded that the development of ridging was strongly affected by the distribution of cube oriented grains. Introduction For environmental and energy saving problems, the automotive industry tends to use light materials to replace heavy materials. Al-Mg-Si alloy has a good formability, a good corrosion resistance and a satisfactory strengthening. Therefore, Al-Mg-Si alloy is the suitable material for the automotive body application. However, a rope-like profile (ridging) parallel to the rolling direction develops when the Al-Mg-Si alloy sheet is stretched to the transverse direction (TD). The ridging materials have the rough surfaces. Therefore, since ridging is unacceptable for the practical application of outer panel of a vehicle, it is important to investigate the formation process of ridging in Al-Mg-Si alloy. The ridging phAenomena in aluminum alloy have been studied by many researchers from the viewpoint of the texture components along the rolling direction (RD) [1-6]. In Al-Mg-Si alloy (AA6111), Jin and Lloyd investigated the influence of iron contents, cold rolling and solutionising on ridging. The investigation has revealed that ridging in AA6111 is insensitive to iron contents and dependent on the degree of cold rolling and solutionising [6]. Furthermore, it is reported that the {001} cube orientation and the {011} Goss orientation affect the development of ridging [3]. Therefore, to investigate the relation between the production process of aluminum alloy sheet and the texture component is very important. In commercial production process of aluminum alloy sheet, the material runs through various thermo-mechanical treatments such as casting, homogenization, hot rolling, cold rolling and solutionization. It can be thought that the fraction of texture components changes during the production process. In this study, in order to clarify the mechanism of ridging development in Al-Mg-Si alloy, the relation between ridging and texture components of the All rights reserved. No part of contents of this paper may be reproduced or transmitted in any form or by any means without the written permission of the publisher: Trans Tech Publications Ltd, Switzerland,www.ttp.net. (ID: 133.1.207.17-24/05/07,12:14:26)
72
Recrystallization and Grain Growth III
Al-Mg-Si alloy sheet was investigated by using three-dimensional (3D) profile microscope and SEM/EBSD technique. We used the Al-Mg-Si alloy sheets prepared by the various thermo-mechanical processes. From these results, we discussed the texture component which is related with a development of ridging using Taylor model. Experimental Procedure In this study, the samples were Al-Mg-Si alloy (6111 alloy) sheets. The chemical composition of this alloy is listed in Table 1. Their preparation processes were homogenized heating, hot rolling, annealing, cold rolling and solutionized heating. Table 2 shows the preparation processes with the sheets labels. For example, “272°C-PA” sheet is the material heated for homogenization at 550°C for 8h, hot rolled at 272°C, annealed at 410°C for 2.5h, cold rolled and solutionized heated at 535°C for 10min. It should be noted that “272°C” sheet was not annealed after a hot rolling. Six kinds of samples were cut to about 15mm (TD) in length and 5mm (RD) in width. And then they were punched out to the specimens for tensile test. After that the surfaces of specimens were mechanical-polished to be mirror surface. The tensile tests were performed on Shimadzu AUTOGRAPH AG-10TA with a tensile axis of TD at room temperature and at a strain rate of 8.3× 10⁻⁴/s. Furthermore, to analyse the 3D height profile of the surface of the specimens, the specimens were stretched to 1.5%. The 3D height profiles of the stretched specimens were measured using a KEYENCE VK-8500 laser microscope. In order to analyse the crystal orientation distribution, the surfaces of the specimens were electro-polished with a mixture of perchloric acid, ethylene glycol and ethyl alcohol of 1: 2: 7 in volume ratio at 275K. Crystal orientation was measured by Hitachi S-3000H equipped with TSL OIM system at 25kV.
Table 1 Chemical composition (wt%) of the material (Al-Mg-Si alloy)
Table 2 Preparation process of the specimens
Materials Science Forum Vols. 558-559
73
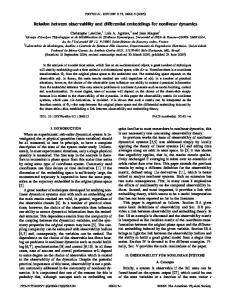
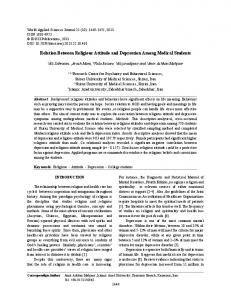
Results and Discussions Evaluation of ridging. Figure 1 shows typical results of stress-strain curves of the specimens. No significant differences in 0.2% proof stress, work hardening rate and fracture total elongation cannot be recognized for all the specimens. However, the difference in the surface roughness between the specimens after 1.5% stretching could be observed. Figure 2 shows the 3D height profiles of the TD-stretched specimens. It was found that the 354°C-PA specimen had a rough surface. The ridges and the valleys along RD could be observed on the rough surface. The other specimens show the flatter surfaces than the 354°C-PA specimen. In order to evaluate the degree of a developed ridging, the difference between the average line roughness of RD and TD was evaluated by the 3D profile data. The differences of all the specimens were shown in Fig. 3. The differences of the PA specimens (272°C-PA, 299°C-PA and 354°C-PA) are larger than the non-PA specimens (272°C, 299°C and 354°C). It was thought that the annealing after hot rolling significantly affects the development of ridging. Therefore, the crystal orientation distributions of all the Fig. 1 Nominal stress-strain curves of the specimens. specimens were analysed by SEM/EBSD technique.
Fig. 2 Three-dimensional height profiles of the specimens after 1.5% stretching.
Crystal orientation distribution of ridging and non-ridging specimens. After the stretch test, it was found that remarkable ridging marks existed on the surface of the 354°C-PA specimen. On the other hand, the 272°C specimen did not show the ridging marks. These materials were fabricated on the different process conditions such as the hot rolling temperature and the annealing process after hot rolling, which can lead to the evolution of different microstructures. In order to clarify the relation between grain size and texture components, SEM/EBSD observation was conducted for all specimens. Figure 3 shows an average grain size of all the 1.5% stretched specimens. The average grain size is around 35μm, which slightly changes depending on process condition. Consequently, grain size did not affect a development of ridging. In general, in aluminum alloy, significant
74
Recrystallization and Grain Growth III
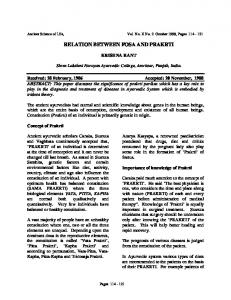
recrystallization and rolling texture components are {001} cube, {011} Goss, {112} copper, {110} brass and {123} S orientations. The fraction of these orientations in the 354°C-PA and the 272°C specimens is shown in Fig. 4. Significant differences in the fraction of cube, copper, brass and S orientations cannot be recognized. And the fraction of Goss orientation in the 272°C specimen (non-ridging specimen) is larger than that in the 354°C-PA specimen. According to some articles, not only cube orientation but also Goss orientation affected the development of ridging [3]. However, our present result clearly shows the development of ridging is little influenced by Goss orientation. Figure 5 shows the distribution of cube-oriented grains in the 354°C-PA and 272°C specimens. The fraction of cube-oriented grains in both specimens is almost the same (see Fig. 4), but the distribution of cube-oriented grains is different. In order to evaluate the distribution of cube grains, the aggregate cube-oriented grains can be observed in the 354°C-PA specimen. The distance between the nearest neighbors of cube-oriented grains were measured, as shown in Fig. 6. The fraction of the distance of below 100μm in the 354°C-PA specimen was higher than that of 272°C specimen. The results indicated that many cube-oriented regions aggregate in microstructure of the 354°C-PA specimen, which is a so-called cube band. 45
3.0
354℃-PA 272℃
35 30
2.0
25 1.5 20 1.0
Difference of roughness Average grain size
15
Fraction (%)
2.5 Average grain size (μm)
Difference between the roughness of RD and TD (μm)
15 40
10
5
10 0.5 5 0
0 272℃ 299℃ 354℃ 272℃ 299℃ 354℃ -PA -PA -PA
Fig. 3 The difference of the roughness of RD and TD and the average grain size of the specimens.
0 Cube
Goss
Copper
Brass
S
Fig. 4 The fraction of texture components in 354°C-PA and 272°C specimens.
(a) 354℃-PA
(b) 272℃
RD
Cube oriented grain
200μm
Fig. 5 The distribution of cube-oriented grains in (a) 354°C-PA and (b) 272°C specimens.
Materials Science Forum Vols. 558-559
75
25
Fraction (%)
(a) 354℃-PA 20 15 10 5 0 25
(b) 272℃
Fraction (%)
20 15 10 5 0 0
100
200
300
400
500
600
700
800
900
1000
The distance between the nearest neighbor cube-oriented grains (μm)
Fig. 6 The distance between the nearest neighbor cube-oriented grains in (a) 354°C -PA and (b) 272°C specimens.
Depth
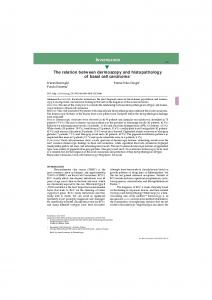
Relation between ridging and cube band. (a) Like the results mentioned above results, it was found that the development of ridging depends not on the fraction but on the distribution of cube-oriented grains. Figure 7(b) shows the depth profile of the line including cube bands in the 354°C-PA specimen (Fig. 7(a)). The deep valley in the line profile corresponds to the cube band. This clearly shows that cube bands roughen the surface in Al-Mg-Si alloys slightly (b) deformed. Figure 7 also shows the Taylor factor distribution (Fig. 7(c)). The Taylor 5μm factor was calculated based on the standard slip system for f.c.c. material, {111} , (c) and the uniaxial extension along TD. The Taylor factor distribution map indicated that the cube-oriented grain had the lower Taylor factor than the other oriented grains. Therefore, it could be considered that the RD difference of plastic deformability between cube-oriented grains and other oriented grains led to the development of ridging. From these results, it was concluded that the 2.26 3.67 200μm development of ridging was strongly affected by the distribution of cube oriented Fig. 7 (a) the distribution of cube-oriented grains, (b) grains. the depth profile of the line in Fig. 7(a) and (c) Taylor factor distribution map in the 354°C-PA specimens.
76
Recrystallization and Grain Growth III
Summary In this study, in order to clarify the formation process of ridging in Al-Mg-Si alloy, six kinds of samples were prepared and the relation between ridging and texture components of the Al-Mg-Si alloy sheet was investigated by three-dimensional (3D) profile microscope and SEM/EBSD technique. (1) No significant differences in 0.2% proof stress and fracture elongation were observed for all the specimens. (2) The TD-stretched 354°C-PA specimen had an uneven surface. The annealing after hot rolling affected the development of ridging. (3) The 354°C-PA specimen had cube bands with width of about 200mm along RD. The combined use of the 3D height profile with the SEM/EBSD revealed that the location of deep valley introduced by tensile deformation corresponds to that of cube bands. (4) The development of ridging was strongly affected by the distribution of cube oriented grains. Acknowledgements The authors would like to express thank to Dr. F. Yoshida (Kyushu University, present address: Nakayama Steel Works, ltd) for fruitful advice and discussion. This work was conducted as one of the joint research in the Branch Research Committee on Physical Metallurgy of Medium-Strength Aluminum Alloys, Japan Institute of Light Metals, and the authors wish to the committee members for supplying the samples. The part of this work was financially supported by Light Metal Educational Foundation Inc. They are very much appreciated. Reference [1] A. J. Beaudoin, J. D. Bryant and D. A. Korzekwa: Metall. Mater. Trans., Vol. 29A (1998), p. 2323. [2] N. J. Wittridge and R. D. Kuntsen: Mater. Sci. Eng., Vol. A269 (1999), p. 205. [3] G. J. Baczynski, R. Guzzo, M. D. Ball and D. J. Lloyd: Acta Mater., Vol. 48 (2000), p. 3361. [4] P. D. Wu, D. J. Lloyd, A. Bosland, H. Jin and S. R. MacEwen: Vol. 51 (2003), p. 1945. [5] Z. Zhao, R. Radovitzky and A. Cuitiño: Acta Mater., Vol. 52 (2004), p. 5791. [6] H. Jin and D. J. Lloyd: Mater. Sci. Eng., Vol. A403 (2005), p. 112.