characteristic responses for determining an appropriate endpoint. ... roughness, as well as the differences in the coefficients of friction between two dissimilar ... Figure 1 shows a block diagram of the set-up. ..... n itud e). Polish Time (minutes). Figure 4. EPD motor current of patterned wafer A. (a) measured signal with an ...
Relationship Between Patterned Wafer Topography Evolution and STI CMP Motor Current Endpoint Signals D. Boning a, X. Xie a, J. Sorooshian b, A. Philipossian b, D. Stein c and D. Hetherington c a
Microsystems Technology Laboratories, Massachusetts Institute of Technology, Cambridge, Massachusetts 02139, USA
b
Department of Chemical and Environmental Engineering, University of Arizona, Tucson, Arizona 85721, USA c
Sandia National Laboratories, Albuquerque, New Mexico 87114, USA
Abstract Chemical Mechanical Planarization (CMP) has become the enabling planarization method for Shallow Trench Isolation (STI) in sub-0.25 micrometer technologies. While CMP is able to reduce topography over longer lateral distances than earlier techniques, it continues to suffer from pattern dependencies that can result in dishing and erosion in STI structures. This shortcoming becomes dramatically worse with substantial over-polish times, thereby motivating the need for endpoint detection (EPD) to minimize over-polish. Frictional monitoring, or motor current EPD has recently emerged as a feasible candidate for monitoring the STI CMP process. Experimental data indicates that frictional effects generated by the pattern structures and various layered materials on the wafer will create distinct and characteristic responses for determining an appropriate endpoint. Our group has previously proposed pattern density and step height models to study STI CMP. Through prediction of the time evolution of the wafer surface, this study presents a model capable of explaining various attributes of the frictional force responses. Our endpoint model considers the frictional force introduced by short-term and long-term surface roughness, as well as the differences in the coefficients of friction between two dissimilar materials. With proper fitting parameters, the model agrees with experimental data for a variety of layouts as well as product wafers. In addition to comparing the simulation model to experimental results, a full characterization of the STI CMP motor current detection scheme is presented. We apply the simulation model to explore reliable endpoint detection techniques based on motor current signals, and study how the EPD method will be affected by different layout density distributions, pattern structures, and consumable sets. Introduction Frictional monitoring, or motor current EPD, has recently emerged as a feasible candidate for Shallow Trench Isolation (STI) Chemical Mechanical Planarization (CMP), and an effective EPD system has the potential of improving yield, increasing throughout, reducing wafer-to-wafer variability and improving planarity [1]. It is suspected that frictional effects generated by the pattern structures and various layered materials on the wafer will create distinct and characteristic responses for determining an appropriate endpoint. After noise filtration, the motor current signal shows distinctive characteristics. The purpose of this paper is to provide a friction model to understand the motor current characteristics based on our STI CMP step-height density model [2][3], and to provide insights for improving EPD.
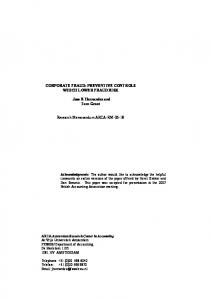
In the following sections, first we review the STI endpoint detection experiment setup and results; then we present the friction model of EPD motor current. After a brief review of our STI CMP step-height density model, we present the simulation results of EPD current, followed by a conclusion. STI Endpoint Detection Experiment Setup and Results The STI endpoint detection experiment involved endpoint characterization of reversed mask processed STI patterned wafers of four reticle sets (A through D). Wafers were 150 mm in diameter. All wafer sets began with 100 Å of a thermally grown pad oxide on a p-type silicon substrate. This was followed by a 2500 Å silicon nitride deposition for sets A and B, and a 1500 Å silicon nitride deposition for sets C and D. Sets A and B were then patterned and etched to obtain a trench depth of 5000 Å. Nominal trench depth for sets C and D was 3100 Å. All wafers were then subjected to a sidewall oxide layer growth of 250 Å via dry oxidation. This was followed by plasma-enhanced chemical vapor deposition of TEOS oxide for trench fill. Structural characteristics of the four sets are summarized in Table I. Reticles used for these sets provided an adequate range of mean oxide density (approximately 11.7 to 37.3 percent). This allowed for a thorough motor current endpoint investigation. Luxtron’s Optima 9300 CMP endpoint system was utilized for detecting motor current signals from the polishing tool. As motor current signals were detected during polish, the realtime controller (RTC) of the Optima 9300 allowed the system to record and recognize endpoint conditions as they occurred on the polishing tool. Once the system detected an endpoint, a relayed signal was sent to the polishing tool via a serial I/O interface [4]. The Optima 9300 was supplied with four current sensors, of which only two were used. One sensor was attached to the carrier-head and the other to the platen. Both sensors were capable of acquiring current signals at a frequency of 10 Hz, and could accommodate direct or alternating currents of up to 25 A. The sensors were also capable of detecting current changes of less than 2 mA. Figure 1 shows a block diagram of the set-up. Motor current signals were taken in three modes: platen signal alone (Channel A), platen and carrier-head signals (Channel A + Channel B), and the ratio of the platen to the carrier-head signal (Channel A / Channel B). Analysis of various signals indicated that Channel A (the platen motor current) provided the most distinctive signal change for endpoint detection. The other remaining signals (i.e. Channel A + Channel B and Channel A / Channel B) yielded unusable results due to the lack of distinguishable curves. The current signal from Channel A shows distinctive pattern as in the example of Figure 4a. STI Endpoint Model We develop our endpoint detection signal model in two steps: first we explore the relationship between EPD current with frictional force, and then we present a model for the frictional force during STI CMP. We can view the carrier-head and platen as a system. The power injected into the system is from Channel A and Channel B currents, and the input power will dissipate through friction. We separate the total dissipation as caused by the frictional force between carrier-head and platen from other energy sinks, which can be viewed as approximately constant during CMP.
r
We first concentrate on the friction between carrier-head and platen. Let f ( x, y ) denote r the friction force that the platen exerts on carrier-head at each location, r ( x, y ) denote the
r
displacement from the center of carrier-head to each position, and R ( x, y ) denote the displacement from the center of platen to each position, which are illustrated in Fig 2. The torque of frictions with respect to the center of carrier-head is
r
r
τ carrier = ∫ wafer r ( x, y ) × f ( x, y ) ⋅ ds ( x, y ) , and the torque with respect to the center of platen is
r
r
(1)
r
τ platen = − ∫ wafer R ( x, y ) × f ( x, y ) ⋅ ds ( x, y ) .
(2)
The friction f ( x, y ) between two materials depends on the materials, surface roughness, wetting, and relative velocity. In a steady state, we know that the relative speed of the head to the platen at any position on the wafer is of both the same magnitude and direction. The other factors at one point should only depend on its location in each die, i.e. we r can write friction as a function of die coordinates f (ξ ,η ) . We rewrite the expressions for the
r
r
carrier torque, with r (ξ ,η ) as the position of each point in its die coordinates and ri as the displacement from the center of carrier-head to the coordinate origin of ith die.
r
r
r
τ carrier = ∑cells ∫ ith _ cell (rcell (ξ ,η ) + ri ( x, y )) × f (ξ ,η ) ⋅ ds (ξ ,η )
(3)
r r r ( ξ , η ) × f (ξ ,η ) ⋅ ds (ξ ,η ) = 0 , by properly choosing the origin of die ∫ ith _ cell cell r r coordinates, and we have τ carrier = (∑cells ri ( x, y )) × ∫ f (ξ ,η ) ⋅ ds (ξ ,η ) . On a 150mm wafer, We can set
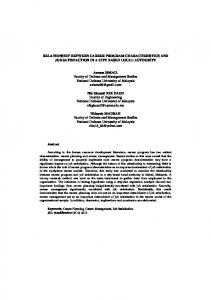
there are usually hundreds of small dies nearly symmetrically distributed on the wafer, thus r ∑cells ri ( x, y ) ≈ 0 and τ carrier contains little information of friction force. In contrast,
r
r
τ platen = ( −∑cells Ri ( x, y )) × ∫ f (ξ ,η ) ⋅ ds (ξ ,η ) has all the contributions added up as
illustrated in Figure 2. Hence, only motor current of Channel A contains information of the frictional forces and can serve as an EPD signal. During the CMP process, two factors cause the change of friction force: the exposure of nitride layer and CMP induced topography variations. To characterize the friction force between platen and carrier head, we assume the frictional force is linearly proportional to the product of the averaged material frictional coefficient µ avg and the long range standard deviation of raised area σ long −term , and we can write the frictional force as:
f ~ µ avg ⋅ (1 + β ⋅ σ long −term ) .
(4)
µ avg is calculated by averaging friction coefficient weighted by the material’s exposed area. When computing σ long −term , we first discretize the die into cells with size of planarization length, and calculate the standard deviation of average raised height of each cell. β is a
model parameter, and we take µ nit − µ ox also as a model parameter, as the friction coefficients of oxide and nitride are very sensitive to slurry used [5]. Review of STI CMP Modeling
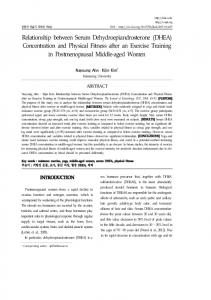
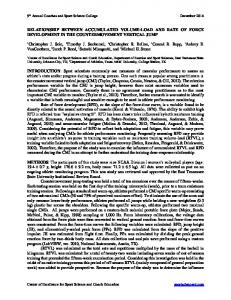
Before proceed to the simulation, we first briefly review the STI CMP models [2][3], which will help us to better understand the simulation result. The previous proposed stepheight density model assumes the overall material removal rate is inversely proportional to the effective pattern density, which is the local layout density averaged through a Gaussian or Elliptic filter with size of planarization length. With large step height, CMP only removes raised area, and when step height is reduced below a certain height, the removal rate of raised area decreases and the RR of trench area increases linearly as function of step height. Both removal rates approach the blanket oxide removal rate as step height reduces to zero (Figure 2a). After the nitride is exposed, the dual material polishing rates have a similar linear dependence on step height, while the removal rate of nitride is scaled down by the selectivity (Figure 2b). The STI CMP process can be separated into four steps in response to the evolvement of frictional force (Figure 4b). Before CMP, deposited oxide has uniform height across the wafer. As CMP starts to remove the raised oxide, a low density area is polished faster compared with the more dense area. In this first step, non-uniformity created by CMP increases wafer surface roughness. During the second step, as the step-height becomes smaller, the polish rate on the raised area begins to decrease, and the faster the area polishes, the earlier it starts to decrease its raised area removal rate. As a result, the non-uniformity declines as all the polish rates converge to the blanket polish rate. The third step starts when the fast-polishing area hits the nitride layer, and its removal rate is further decreased four- to five-fold due to slow nitride polishing. Thus, the surface roughness is expected to reduce several-fold in magnitude; however, as the nitride gets exposed, the average friction coefficient is changing too. As the experiment suggested, the net result is a slow decrease in friction force. In the last step when all oxide areas are cleared, the average friction coefficient becomes a constant again, while the nitride polishing starts to increase topography nonuniformity slowly again. Simulation and Discussion
The simulation is performed for the set of patterned wafers A to D, and we use the same initial structure parameters as in the experiment. For patterned wafers A and B, we assume an initial oxide layer of 9000 Å and a nitride layer of 2500 Å; while for patterned wafers C and D, we assume an initial oxide layer of 5900 Å and a nitride layer of 1500 Å. As for initial step height, we assume 7000 Å for wafers A and B, and 4500 Å for C and D. The oxide and nitride density distribution is an estimate based on the effective pattern density histogram distribution, as in Figure 8, and the effective density is calculated using an elliptical weighting function with a planarization length of 3.5mm [6]. For STI CMP step-height model, we use a blanket oxide removal rate of 3000 Å /min, and an oxide to nitride selectivity of 4. For the friction force model, we choose β = 0.001 (1/ Å) and
µ ox − µ nit = 12% , µ ox
(5)
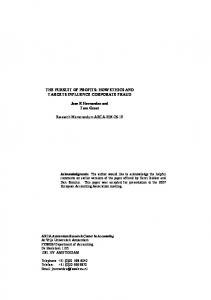
such that the simulated motor currents are close to measurement results. The simulated results for each patterned wafer are drawn in Figures 4-7, along with the measured signal to compare. The simulated plots agree reasonably well with the experiment signals, and show the distinctive curves of the four steps. The estimated oxide clearing time, which marks the beginning of step 3, i.e. when oxide starts to be cleared, to the end of step 3, i.e. when all oxide gets cleared, is also listed with each plot as a reference. For wafers A to C, the simulated friction forces continue to decrease until all oxide is cleared, which indicates an effective endpoint detection. For wafer D, however, the rising of the motor current occurs during step 3, which results in an early detection. The failure of endpoint detection of wafer D prompts us to study the limit of the EPD mechanism. Compare the pattern wafer C with D, as they have the same structure parameters. Their largest difference lies in their oxide density distributions, as shown in Figure 8. Wafer C has center-peaked oxide density range from 0.15 to 0.29, while the oxide density of wafer D is very similar to that of wafer C, except a fat tail from 0.29 to 0.38. As the larger density area polishes slower, the fat tail of wafer D results in a slow decreasing rate of roughness, when nitride layer starts to be exposed. It is the slow decreasing of roughness compared with rate of nitride exposure that leads to an early detection of endpoint. Late detection of endpoint is also possible when oxide density is inversely correlated with the nitride density, i.e. for each point, the higher the oxide density, the lower the nitride density. Right after all oxide gets cleared, the more dense the nitride density, the slower it polishes, but the same point has a low oxide density and it has been polished more before. Thus, the polish will carry a momentum to reduce roughness before finally increasing it, as shown in Figure 9. Conclusion and Future Study
In this paper, we present a simple friction model to explain the endpoint motor current based on STI CMP step-height density model. The model confirms several observations of the EPD experiment and the simulated signals of four patterned wafers agree reasonably well with the distinctive characteristic EPD motor currents measured. Based on our model, we further study the situation, in which the EPD mechanism may yield false endpoint of early detection or late detection. It needs to be emphasized that in the simulation we use approximate model parameters of the STI CMP process, as well as a rough estimation of oxide and nitride density distribution. Further fine tuning of our model is possible with more detailed information. For example, when computing the surface roughness contribution to friction, it is possible that the pad does not see surface height variation of below certain lateral distance or beyond certain distance, and we would be able to study the effect with a detailed density distribution. The friction model can also be further developed and calibrated through specific designed experiments, and help us to prevent early or late endpoint detection. Acknowledgements
This work has been supported in part by the NSF/ERC Engineering Research Center for Environmentally Benign Semiconductor Manufacturing.
References
[1] D. L. Hetherington and D. J. Stein, “Recent Advances in Endpoint and In-line Monitoring Techniques for Chemical-Mechanical Polishing Processes,” Proc. 6th Int. CMP-MIC Conf., p. 315, Mar. 7-9, 2001. [2] D. O. Ouma, D. S. Boning, J. E. Chung, W. G. Easter, V. Saxena, S. Misra, and A. Crevasse, “Characterization and Modeling of Oxide Chemical Mechanical Polishing Using Planarization Length and Pattern Density Concepts,” IEEE Trans. Semiconduct. Manufact., vol. 15, no. 2, pp. 232-244, May 2002. [3] Brian Lee, “Modeling of Chemical Mechanical Polishing for Shallow Trench Isolation,” Ph.D. Thesis, MIT Dept. of Electrical Engineering and Computer Science, May 2002. [4] Optima 9300 Series Chemical-Mechanical Polishing Endpoint Controller User Manual, Luxtron Corporation, Santa Clara, CA, 1999. [5] R. Brandes, T. Knothe, F. Klaessig, F. Menzel, W. Lortz, G. Varga, T. Shibasaki and Ara Philipossian , “Metal-Doped Silica Abrasive Slurries and their Effect on Friction and Removal Rate Characteristics of ILD and STI CMP,” Proc. 8th Int. CMP-MIC Conf., Feb. 1921, 2003, p. 64. [6] B. Lee, D. S. Boning, D. L. Hetherington and D. J. Stein, “Using Smart Dummy Fill and Selective Reverse Etchback for Pattern Density Equalization,” Proc. 5th Int. CMP-MIC Conf., Feb. 28-29, 2000, p. 255.
Table 1. STI patterned wafer information
Figure 1. Block diagram of the Avanti-472 polisher with the Optima-9300EPD system
(a)
(b)
Figure 2. STI CMP step-height density model: (a) removal rate dependence on step height during oxide polish; and (b) removal rate dependence on step height during dual materials polishing. [3]
Platen
f R A
r
Carrier-head
B
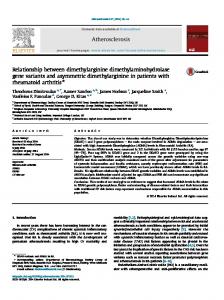
Figure 3. Illustration of friction force between platen and carrier-head. f denotes the friction force exerted on platen by carrier-head; R denotes the displacement from each point to the center of platen A; and r denotes the displacement from each point to the center of carrierhead B. As small dies are symmetrically distributed on the wafer, the net torque with respect to B is almost zero, while all small torques add up to contribute to the net torque with respect to A.
Signal Amplitude (in relative magnitude)
Signal Amplitude
Step 2
Step 3 Step 1 Step 4
0
20
40
60
80
100
0
20
40
60
80
100
Signal Amplitude
Signal Amplitude (in relative magnitude)
Polish Time (seconds) Polish Time (minutes) (b) (a) Figure 4. EPD motor current of patterned wafer A. (a) measured signal with an applied endpoint recipe; (b) predicted by friction model, estimated oxide clearing time from 49-80 seconds
Polish Time (minutes) (a)
Polish Time (seconds)
(b)
Figure 5. EPD motor current of patterned wafer B. (a) measured signal with an applied endpoint recipe; (b) predicted by friction model, estimated oxide clearing time from 50-86 seconds
Signal Amplitude (in relative magnitude)
Signal Amplitude
Signal Amplitude
0
10
Polish Time (seconds)
20
30
40
50
60
70
Polish Time (seconds)
Polish Time (minutes) (a)
(b)
Signal Amplitude
Signal Amplitude (in relative magnitude)
Figure 6. EPD motor current of patterned wafer C. (a) measured signal with an applied endpoint recipe; (b) predicted by friction model, estimated oxide clearing time from 50-65 seconds
0
Polish Time (minutes) (a)
10
20
30
40
50
60
70
Polish Time (seconds)
(b)
Figure 7. EPD motor current of patterned wafer D. (a) measured signal with an applied endpoint recipe; (b) predicted by friction model, estimated oxide clearing time from 48-75 seconds
25
30
25
20
Counts
Counts
20
15
10
15
10
5
5
0 0.1
0.15
0.2
0.25
0.3
0.35
0 0.1
0.2
0.3
0.4
Oxide Pattern Density
Oxide Pattern Density (a)
(b)
Signal Amplitude (in relative magnitude)
Signal Amplitude (in relative magnitude)
Figure 8. Oxide density distribution histogram of (a) wafer C and (b) wafer D.
~140 s
0
50
100
Polish Time (seconds)
150
~90 s
0
20
40
60
80
100
Polish Time (seconds)
(a) (b) Figure 9. Late detection of endpoint due to nitride density inversely correlated with oxide density (a), as compared with the case when positively correlated. Estimated oxide clearing time is 86 seconds.