PHYSICAL REVIEW SPECIAL TOPICS - PHYSICS EDUCATION RESEARCH 4, 010106 共2008兲
Reliability, compliance, and security in web-based course assessments Scott Bonham* Department of Physics and Astronomy, Western Kentucky University, Bowling Green, Kentucky 42101, USA 共Received 27 February 2007; published 15 April 2008兲 Pre- and postcourse assessment has become a very important tool for education research in physics and other areas. The web offers an attractive alternative to in-class paper administration, but concerns about web-based administration include reliability due to changes in medium, student compliance rates, and test security, both question leakage and utilization of web resources. An investigation was carried out in introductory astronomy courses comparing pre- and postcourse administration of assessments using the web and on paper. Overall no difference was seen in performance due to the medium. Compliance rates fluctuated greatly, and factors that seemed to produce higher rates are identified. Notably, email reminders increased compliance by 20%. Most of the 559 students complied with requests to not copy, print, or save questions nor use web resources; about 1% did copy some question text and around 2% frequently used other windows or applications while completing the assessment. DOI: 10.1103/PhysRevSTPER.4.010106
PACS number共s兲: 01.40.Fk, 01.40.gf, 01.50.Kw
I. INTRODUCTION
Pre- postcourse assessment has become a very important tool in physics education research 共PER兲. Normalized gains in the force concept inventory1,2 共FCI兲 have become a standard for evaluating curricula and for other purposes and have helped spur the development of similar instruments covering many different topics in introductory physics and astronomy. A significant barrier to using such assessments, however, is the time and resources required to administer pre- and postcourse assessments. In-class administration can occupy 2–5 % of the total instructional time in a typical semester course, and even when using scan forms there is additional work to be done outside of class. These issues are not present for web-based assessment outside the classroom.3 Only minimal class time is needed to announce the assessment and remind students to complete it outside of class. Web delivery eliminates the paper work, and scores can be obtained immediately, allowing instructors quicker feedback on the state of their students. However, administering pre- and postcourse assessments on the web outside of class instead of inside class raises three areas of concern: reliability, compliance, and security. Reliability is the issue of whether the mode of administration will affect student performance on the assessment. Differences in setting, mode of answering, and available resources could potentially affect how students respond on certain questions. Compliance is the question of whether sufficient students comply with the request to take the test on their own time, and what factors may influence the number who will do so. Security concerns two issues. First is the possibility of question leakage, or copies of test items being retained by users for other purposes. Second is the utilization of resources that would not be available in the classroom to answer questions. Research has been done on the equivalence of paper-andpencil assessments with computer assessments4–8 that concludes that they are generally but not always equivalent. Differences can arise due to computer skills9 and motivation to perform well.10 Most studies took place in a different setting 1554-9178/2008/4共1兲/010106共8兲
from the present, such as in required educational or workplace assessments5–7,10 where compliance rates are not an issue, and only one10 sought to assess security issues. The study most similar to this one is by MacIssac,8 in which half of an introductory level physics class took the FCI in class and the Maryland physics expectations survey11 共MPEX兲 on the web, with the mode reversed for the other half. No difference was found in the scores on the FCI for the two groups 共MPEX scores were not reported兲. Students did not have to log onto that system, which limited available information on compliance rates and also led to some security issues, such as a few individuals retaking the assessment. II. EXPERIMENT
Introductory astronomy students at the author’s institution were asked to complete two assessments at the beginning and the end of the semester. One was administered in class using scan forms and the second assessment was completed outside of the class on the web. Half of the classes took an epistemological beliefs assessment in class and an astronomy conceptual test on the web, and the other half took the same assessments with the modes reversed. Two assessments were used, the epistemological beliefs assessment for physical science 共EBAPS兲 version 5.0,12 and an astronomy conceptual survey. The EBAPS is a 30-item assessment developed and validated by Elby and colleagues that has five nonorthogonal scales: structure of scientific knowledge, nature of knowing and learning, real-life applicability, evolving knowledge, and source of ability to learn. The EBAPS uses three different question formats to measure how strongly students agree with given statements. The EBAPS uses a nonlinear scoring scheme; on question 5, A = 0, B = 1, C = 2, D = 3, and E = 4, while on question 18, A = 4, B = 3.5, C = 1.5, D = 0.5, and E = 0, and a few questions score two options the same. Question scores on each scale are averaged, yielding a score from 0 to 4 on each scale. Higher scores indicate higher levels of epistemological sophistication. The astronomy concept survey was a 24-item “mock-up” multiple-choice assessment developed in house.
010106-1
©2008 The American Physical Society
PHYS. REV. ST PHYS. EDUC. RES. 4, 010106 共2008兲
SCOTT BONHAM
The score is the total number of correct answers. No significant effort was made to check reliability and validity of the assessment other than face validity for astronomy instructors. This was used instead of one of the already developed astronomy assessments because of concerns over security of the instrument. The web-based assessment was administrated using a system developed by the author. Students logged onto a password-protected site, were given an information page and user agreement they were asked to consent to, and then took the assessment. The text of the information page and user agreement may be found in the Appendix. The database contained information on which students were in which class, so the correct assessment was automatically selected. Questions were delivered one at a time and students had the ability to skip forward, go back, and mark questions to return to later, as they would taking the assessment on paper. For security reasons, students who had started the assessment were not permitted to retake the assessment without requesting a login reset from the system administrator. The system could collect limited information about student activity through browser events that may indicate copying, saving, printing, and using other applications while taking the assessment on the web. The study was carried out over two semesters, with a pilot study involving four classes13 during the spring semester of 2006 and a full-scale study involving eleven classes in the fall semester of 2006. Most of the classes involved were “Astronomy of the Solar System” but three sections of “Astronomy of Stellar Systems” were also involved, two in the pilot study, and one in the full-scale study, which was restricted to students in the university honors program. The two astronomy courses are independent and most students take only one of them. There was variation between instructors as to what topics are actually covered in the class. Eleven classes were taught in a lecture hall with 60–80 students in the class, and four 共B1 and C1 on the pilot study, B1 and E1 on the full-scale study兲 were taught in a somewhat more interactive format in a 45-student classroom following the design used in the Student Centered Activities for Large Enrollment University Programs 共SCALE-UP兲 curriculum.14 In total, eight different instructors and 975 students were involved in this study. When an instructor taught more than one class, the assessment used in class and on the web alternated from class to class. Assignments for the remaining classes were made to distribute the assessments as evenly as possible by time of day and class size. The assessments were administered during the first and last weeks of the semester. The in-class assessments were administered during one class period of the instructor’s choosing in the first week, with over half on the first day, and similarly during one class period in the last week of the semester. Instructors requested students to take it seriously although it would not affect their course grade. Instructors informed students about the web-based assessment and requested that they complete it through in-class announcements and email messages. Students were given approximately one week to complete the assessment on the web at the beginning and end of the semesters. With one exception, students were offered course credit for completing the assessment on the web independent of performance. All in-
structors except instructor A chose to offer extra credit on exams or final grades. Instructor A elected to make the assessments count as one of the nearly weekly quizzes. Data were collected and analyzed as follows. Electronic files of paper scan forms were first imported into Microsoft EXCEL for preliminary data cleaning 共e.g., correcting misread ID numbers兲 and then imported into SPSS v14. Web assessment data were extracted from the MYSQL database into SPSS. Data on student enrollment were obtained directly from the university database. Most statistical analysis was carried out using SPSS, with Microsoft EXCEL used for a few topics, such as sorting through possible copying events. The subsets of the data used in the different analyses will be discussed explicitly in the respective sections. III. RELIABILITY A. Evaluation
The performance of those taking EBAPS in class and astronomy on the web was compared to those taking EBAPS on the web and astronomy in class. In order to ensure that the groups being compared were comparable, a subset of data was used for the comparison, with the following selection rules. First, only data from students who took both the paper and web assessments during the same period were used. Second, the students in the honors section of astronomy were excluded from the reliability analysis since they represent a different population from the remaining students. Third, the low numbers of students completing the paper postcourse assessment in the pilot study led to it being excluded completely. 共Two of the four classes did not administer the assessment, and there was poor attendance in the remaining ones.兲 Finally, scores were excluded for a number of students who appeared to not take the web assessment seriously, as evidenced by the student taking about a second or less to read and answer a question multiple times while completing the web assessment. B. Results
There were no significant differences between web and paper groups on any comparison at the ␣ = 0.05 level. Average scores for each group on the five scales of the EBAPS 共0 to 4兲 and the astronomy conceptual assessment 共0 to 24兲 are reported in Table I, along with p values obtained from a two-tailed t test, equal variances not assumed. Differences in performance on individual items due to the mode on the EBAPS were checked with t tests for each of the three data sets, resulting in 90 comparisons. As a p value of 0.05 means that there is a 5% chance of two quantities being different by random chance, it would be expected that around four or five of the comparisons would result in spurious significance at the ␣ = 0.05 level, and around one at the ␣ = 0.01 level. That is consistent with what was found; six of the 90 comparisons yielded p ⬍ 0.05 and one p ⬍ 0.01. This indicates that mode of administration does not affect performance on individual EBAPS items. A Pearson 2 test was used to look at individual astronomy items, as this would be sensitive to differences in
010106-2
PHYS. REV. ST PHYS. EDUC. RES. 4, 010106 共2008兲
RELIABILITY, COMPLIANCE, AND SECURITY IN WEB-…
TABLE I. t-test comparison of student performance on web and paper for both assessments on pilot and full-scale studies. N is the number of students taking the astronomy or EBAPS assessment in that mode, along with the average score and standard error of the mean for each scale. The last column provides the probability measure and shows that no significant differences are found due to the mode of administration.
Pilot study preinstruction
Full study preinstruction
Full study postinstruction
Study and scale
Web
Paper
p
NEBAPS / Nastronomy EBAPS: Structure sci. know. EBAPS: Nature know/learn EBAPS: Real-life applicability EBAPS: Evolving knowledge EBAPS: Source of ability Astronomy concept exam
76/ 52 2.12⫾ .06 2.59⫾ .07 2.10⫾ .07 2.46⫾ .09 3.04⫾ .08 9.2⫾ .6
52/ 76 2.06⫾ .07 2.53⫾ .07 2.23⫾ .08 2.40⫾ .11 2.90⫾ .10 9.0⫾ .4
0.50 0.25 0.22 0.70 0.28 0.78
NEBAPS / NAstronomy EBAPS: Structure sci. know. EBAPS: Nature know/learn EBAPS: Real-life applicability EBAPS: Evolving knowledge EBAPS: Source of ability Astronomy concept exam
154/ 204 2.15⫾ .04 2.51⫾ .04 2.62⫾ .06 2.39⫾ .06 3.00⫾ .05 8.2⫾ .2
204/ 154 2.09⫾ .03 2.54⫾ .04 2.56⫾ .05 2.52⫾ .06 2.96⫾ .04 7.8⫾ .3
0.24 0.60 0.43 0.14 0.52 0.30
NEBAPS / NAstronomy EBAPS: Structure sci. know. EBAPS: Nature know/learn EBAPS: Real-life applicability EBAPS: Evolving knowledge EBAPS: Source of ability Astronomy concept exam
90/ 130 2.07⫾ .05 2.61⫾ .06 2.69⫾ .06 2.39⫾ .08 2.98⫾ .07 9.8⫾ .4
130/ 90 2.05⫾ .04 2.57⫾ .05 2.58⫾ .06 2.50⫾ .06 2.89⫾ .06 11.0⫾ .4
0.78 0.57 0.20 0.31 0.32 0.053
which distractors were selected. Two items had p values less than 0.05 in two of the three data sets, and four items on one set. Eight different comparisons with p values less than 0.05 is double the three to four comparisons that would be expected from chance. Both items that showed differences on multiple data sets also had concentration factors of less than 0.2 on multiple data sets. The concentration factor15 is a metric of the extent to which certain options are selected compared to others, with a value of zero indicating completely even distribution of student choices and a value of one indicating all choosing the same answer. Values of less than 0.2 suggest that students are not strongly drawn to any options and may indicate significant amounts of guessing. In such a situation, small effects due to the mode of administration could become significant. C. Discussion and summary
Overall, there were no significant differences between web and paper administration of either assessment, in terms of total score on the astronomy assessment and each of the five scales on the EBAPS. An item-by-item-t-test analysis of EBAPS items yielded an expected number of p values less than 0.05 by chance, confirming that the mode of administration does not affect EBAPS performance. Two astronomy
assessment items showed significant differences on multiple occasions. Both were also marked by relatively low concentration values, suggesting high levels of guessing. Overall, this study supports the general trend that finds no difference between web and paper administration of assessments, but also shows that it is not automatically true.
IV. COMPLIANCE A. Evaluation
Compliance is the fraction of the students actually taking the assessment during a particular administration. On inclass assessment, this is essentially the fraction of students who attended class that particular day. For the web, this is the fraction of students who took the time outside of class to complete the assessment on line. There was also a small fraction of students who started the assessment on the web but did not complete it. Three studies relating to compliance were carried out. The first compared compliance rates between paper and web assessments. The second looked at differences between classes in web compliance rates to identify influencing factors. The third measured the effect of email reminders on compliance rates. Because students were given up to a week to complete
010106-3
PHYS. REV. ST PHYS. EDUC. RES. 4, 010106 共2008兲
SCOTT BONHAM
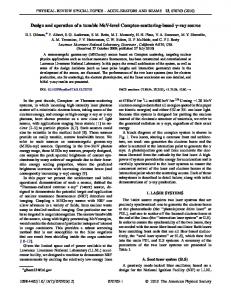
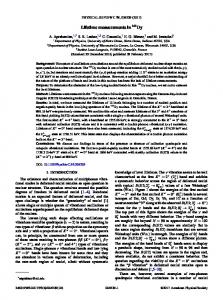
FIG. 1. 共Color online兲 Compliance rates in the pilot and full-scale study, broken down by individual classes and the average rate for each study. The four bars in each group are, left to right, the web-based precourse assessment, the paper-based precourse assessment, the web-based postcourse assessment, and the paper-based postcourse assessment. Shown are the compliance rates on each of the paper and web assessments, and the average for each of the studies. On the full-scale study, the small white bars on top of the web-based assessment represent the rates of students who attempted but did not complete the assessment.
the web-based assessment, one factor in compliance rates is students forgetting about it. The data used in the first two studies consisted of all students from both semesters who were still officially enrolled in the course at the end of the semester. On the email study, the data came from all students enrolled in the classes at the end of the semester during the full-scale study, excluding those of classes A1, A2, and E1. The instructors of those courses had sent email reminders at the same time. B. Results
Figure 1 shows the compliance rates for both of the studies. On the precourse assessments, the paper compliance rate was always higher than the web-based compliance rate, more so in some cases than others, since almost all students will be in class for the first few class meetings. The average compliance rate over all classes on the postcourse assessment was comparable between paper and web. Several factors influenced the variance between classes in compliance rates, among them amount of course credit offered, classroom management and logistics, and reminders to students. As mentioned above, instructor A gave greater course credit for participating in the web-based assessments, electing to make each count as a quiz score instead of offering extra credit points. As can be seen in Fig. 1, he consistently had among the highest compliance rates, 共78⫾ 2兲% to 共61⫾ 2兲% 共unweighted mean and standard error by class兲. A t test confirms that this is a significant difference, with a p value ⬍0.001. Instructor C on the pilot project resisted offering course credit for completing the precourse assessment but did offer it for the postcourse assessment, correlating with a higher web compliance rate on the postcourse assessment. Class management and logistics prevented data collection from the in-class assessments in five cases; in three cases because the instructor had fallen behind and would not give up class time the last week of the semester, and in two cases due to logistic failures in getting forms to the classroom or getting the scan forms processed. For practical purposes, the compliance rates in these classes were zero, through no fault of the students.
Instructor efforts to remind and motivate student play a role, too. Instructor B made a greater effort during the pilot study to remind students to complete the web precourse assessment than during the full study, and there is a drop in compliance rates. On the full-scale study, class F2 went from the lowest completion rate on the web precourse assessment to tied for highest on the postcourse. Class F1 had significantly outscored class F2 on the mid-term examinations, so the instructor had admonished F2 students more than F1. The importance of reminders is reinforced by the results of an experiment using email reminders during the postcourse assessment of the full-scale study. The web-based assessment had been made available Monday morning the week before finals, though most students were informed either Monday afternoon or Tuesday. Students were told they had until the following Monday at 7 p.m., although the assessment was actually available until 9 p.m. Students who had not completed the assignment by Friday morning were divided into three groups in an essentially random manner based on the final digit of the school-issued student ID number. Students from three classes 共A1, A2, and E1兲 were excluded, since the corresponding instructors had emailed their students that morning about the web-based assessment. The two experimental groups received email reminders while the control group did not. The first experimental group received a simple, generic email reminder Friday afternoon. The second group received an email that was personally addressed to the student and explicitly stated that a check revealed that they had not completed the assessment. Furthermore, those in the second experimental group who still had not completed the assessment by Monday morning received a follow-up reminder. Table II compares the completion rates of each of the three groups. It can be seen that the compliance rate before emails was essentially the same among the three groups, and email reminders produced a significant increase in compliance rates in the experimental groups compared to the control group. The personalized messages with follow-up had a higher rate than the generic email group, but the number of students involved was too small for the difference to be statistically significant.
010106-4
PHYS. REV. ST PHYS. EDUC. RES. 4, 010106 共2008兲
RELIABILITY, COMPLIANCE, AND SECURITY IN WEB-… TABLE II. Compliance rates with email reminders. Before the first email reminder, the compliance rates were essentially identical. A greater percentage of those receiving email reminders completed the assessment than those who did not.
N 共students兲 Before reminder After reminder Total 1 / 冑N
Control
Group 1
Group 2
352 43% 11% 54% 5%
118 46% 24% 69% 9%
123 47% 28% 76% 9%
C. Discussion and summary
Several reasonable conclusions can be drawn about compliance rates. First, compliance rates tend to be somewhat lower on the web but not greatly so. Second, course credit matters in obtaining good compliance rates. The instructor with the highest average compliance rates gave the most significant credit, making it part of the regular grade instead of extra credit. Third, reminding students can significantly increase compliance rates, both encouragement in class and reminders sent by email.
V. SECURITY A. Evaluation
There are two components to security that were investigated. One is the possible leakage of questions to the student population though copying, printing, and saving the text of items. The second is the possible use of web resources, such as search engines, to complete assessments. Information was collected by tracking browser events that could indicate such behavior. Printing was looked for on the postcourse assessments by collecting information on onBeforePrint events in Microsoft Internet Explorer 共MSIE兲.16 On non-MSIE browsers, a small and virtually invisible Java applet was embedded in the question page and identified printing when the Java Print共 兲 method17 was invoked. Testing showed this to be reliable except on the minor browser Opera. Saving of questions was looked for though the proxy of detecting reloading of pages from some source other than the original web page. It should be noted that the system would not detect loading pages on a computer not connected to the internet or in a program such as Microsoft Word that is not a JavaScript-enabled browser. Copying of text was looked for by using OnCopy events in MSIE16 and text selection in other browsers.18 The latter tends to produce a number of false signals, most of which appear to be students intentionally or accidentally selecting text as they read it. The criteria used to identify highly likely copying events were 共1兲 significant portions of text and/or options were copied or selected and 共2兲 the browser window lost focus. In this context, focus refers to the window or application on the computer that is the active one, i.g., that will receive keyboard input. Focus-gained events occur when the browser window becomes the active one and focus-lost
events occur when it ceases to be the active one. The inappropriate use of other resources for answering questions is somewhat more challenging to detect. There is obviously no way for a web-based application to detect the use of nonweb resources like a textbook, notes, or a classmate, other than perhaps through inexplicably long times to answer questions. The use of web resources 共e.g., GOOGLE or a course website兲 cannot be directly detected, either; web browsers employ security measures that prevent scripts in a particular window from obtaining information about other open windows and activity in them. However, going to another window does trigger focus-lost events, which gives the information that the student has moved to some other window on the computer. The complication is that many things other than use of web resources could also trigger focus-lost events. Examples include the student receiving an instant message, quickly checking email, accidentally clicking outside the browser, adware infecting a computer popping up windows, the student clicking on the start menu or anywhere else on the tool bar, and any other interactions with another application. Most of these other types of events, however, can in a certain sense be considered random events, in that there will be little correlation with a particular question, and little correlation with a particular student. In contrast, use of web resources will tend to correlate with particular questions 共more students search on certain questions compared to others兲 and students 共a student who has already used a web resource is more likely to use it again兲. Thus the deviation of the distribution of events from purely random will give a measure of the extent to which web resources may be being used. It is expected that deviation from random on the astronomy assessment would be greater than for EBAPS, and that the total number of focus-lost events would be higher. The questions on the astronomy assessment are more of a factual nature, and students would be expecting similar questions on the course final they would be taking less than a week and a half later. B. Results
Printing, saving, and copying events were listened for as described above on the postcourse test of both the pilot and full-scale studies. No print events were detected during either study, nor was any reloading of pages, the proxy for students saving text. On the full-scale postcourse test, four cases were found with high probability that students copied text of questions to another application, and two with a medium probability, out of 559 students who completed the postcourse assessment on the web. All of the high-probability cases involved the astronomy concept assessment, and the two mediumprobability cases involved the EBAPS. Three of the four high-probability cases use the MSIE browser, so it is certain that the student actually copied text to the system clipboard and then went to another application. None of the cases proved to be systematic copying of questions to other applications; of the six cases of medium or high probability, four involved only one question where there was text copied, and two cases involved three questions. It appears that, at least in
010106-5
PHYS. REV. ST PHYS. EDUC. RES. 4, 010106 共2008兲
SCOTT BONHAM
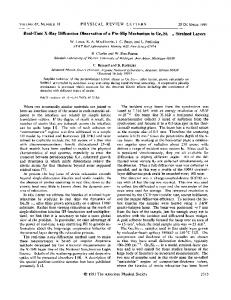
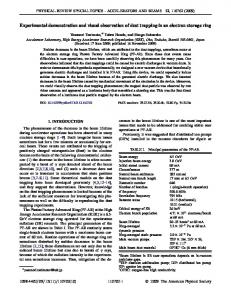
FIG. 2. 共Color online兲 Frequencies of focus-lost events on both assessments compared to distribution for completely random events. Significant deviations from a random 共binomial兲 distribution are probable indications of students using other applications while taking the assessment.
some of the cases, the students were more likely copying text to a search engine rather than saving text for future reference. Figure 2 compares the actual distribution of focus-lost events by question and student compared to that predicted by a purely random distribution. As expected, the histogram deviates from random more on the astronomy assessment than on EBAPS, suggesting more frequent use of web resources while completing the astronomy assessment. Figures 2共a兲 and 2共c兲 were produced by first counting the number of students who left the browser window and returned on each question, and then producing a histogram of number of questions 共vertical axis兲 by number of students leaving on a question 共horizontal axis兲. Figures 2共b兲 and 2共d兲 similarly were produced by summing the number of questions on which a particular student left the browser window and then producing a histogram of number of students by the number of questions a student left the browser window. The comparison distribution by questions 共students兲 was calculated as a binomial distribution where the number of trials was the number of students 共questions兲, the probability of success was the total number of questions with focus lost divided by the total number of responses on questions on each assessment, and the distribution was normalized to the number of questions 共students兲 involved. The histograms by question show that the actual distribution tends to follow the general shape of the random distribution, though it appears to be somewhat better for the EBAPS than the astronomy assessment, where the actual distribution is more bimodal. On the histogram by students, again it follows the general shape but the actual distribution is smaller for small numbers of questions and has a longer tail. The simplest explanation for the longer tail is that a fraction of students are regularly and intentionally going to other applications as they work though the assessment. It is notable that there are more students in the tail on the astronomy assessment compared to the EBAPS.
The indication that students were more likely to utilize web resources while completing the astronomy assessment is also borne out by the frequencies of focus-lost events. Table III displays the number of students, responses, and responses on which focus was lost. Notably, although there were more EBAPS responses 共more students, more questions兲 there were more focus-lost events on the astronomy assessment. Much of the difference is due to the frequent leavers, those who had six or more responses with focus-lost events. A purely random distribution would predict that between one and two students on the astronomy assessment would have six or more questions with focus-lost events, and less than one on the EBAPS. Removing the eight students on the astronomy assessment and two on EBAPS that had six or more questions on which they lost focus, the frequency of lost focus becomes nearly the same. C. Discussion and summary
The data show that the vast majority of students fully complied with the request to not print, save, and/or copy items nor to use other resources. Out of 559 students, only four highly probable cases of copying were found, and no cases of printing or saving pages. The distribution of focuslost events bears a significant resemblance to the binomial distribution obtained for purely random events. This suggests that most of the lost-focus events are in effect random events and only a small number of individuals 共less than a dozen兲 systematically used other applications, possibly utilizing web-based resources. This behavior was much more likely to occur on the astronomy assessment, as indicated by all four high-probability copy events, the majority of students with six or more focus-lost events, as well as the rate of focus-lost events. This would be expected in that the astronomy assessment was a more factual assessment and more similar to the final exam they would soon take, so students would more
010106-6
PHYS. REV. ST PHYS. EDUC. RES. 4, 010106 共2008兲
RELIABILITY, COMPLIANCE, AND SECURITY IN WEB-…
TABLE III. Summary of lost focus events on full-scale postcourse assessment. Most of the difference between the two assessments in how frequently a student leaves the browser window can be attributed to a small number of students who appear to have interacted with other applications regularly. Group All students
Frequent leaversb
Remaining students
Category
Astronomy
EBAPS
Av. number of studentsa Responses lost focus Total responses Fraction lost focus
231.75 149 5562 2.7%
257.3 129 7718 1.7%
Number of students Responses lost focus Total responses Fraction lost focus
8 58 192 30%
2 14 61 23%
Av. number of students Responses lost focus Total responses Fraction lost focus
223.75 91 5370 1.7%
255.3 115 7657 1.5%
aAverage
over all questions. Not all students answered all questions. Defined as having a focus-lost event on six or more questions.
b
likely feel the need to engage in inappropriate behavior in order to try to perform better. This result is both encouraging and underlines the need for continual vigilance. It is encouraging because the rates were quite low and would not have a significant effect on the overall results. However, it is significant that some of this behavior was in fact seen in what would be expected to be a situation providing relatively low motivation and some barriers to widespread cheating. These classes involved are freshman-level introductory astronomy course populated primarily by nonscience and nonengineering students satisfying a general education science requirement at a university that is not highly selective. It seems reasonable that the average level of student motivation in this course is lower than in some of the courses where pre- and postcourse assessments are administered, for example, introductory physics courses taken by preprofessional students. Students were explicitly asked not to engage in these particular behaviors, and the delivery of questions individually significantly increases the level of effort required to obtain copies of the questions in the assessment. It is possible that the rates of unauthorized activity could be higher under other conditions.
VI. CONCLUSION AND RECOMMENDATIONS
There are obvious benefits from using web-based administration of pre- and postcourse assessments in introductory physics and other science classes, as well three areas of legitimate concerns: reliability, compliance, and security. This work describes a set of investigations carried out in introductory astronomy courses addressing those issues. Comparison of student performance on paper and web versions of the assessments is consistent with previous research that, for many assessments, there is little or no effect on performance
due to the means of administration. Compliance rates tended to be higher on precourse assessments and on paper versions, but sufficient course rewards and/or email reminders can bring compliance rates up to be comparable with, and even surpass, in-class compliance rates. The measures taken in this study to reduce question leakage and inappropriate use of web resources were largely successful, with fewer than 2% of the students engaged in copying text or systematically using other applications on the computer. This study supports the view that these legitimate areas of concern are not serious enough to impede the use of webbased administration of pre- and postcourse assessments. However, it also shows that these concerns are not baseless, and need to be addressed in the design and administration of web-based assessments. Some recommendations follow. 共1兲 Each assessment instrument should be evaluated at some point as to the effects of mode of administration. There is no general trend of the medium making a difference, but that is not automatically true for all assessments. 共2兲 In order to ensure sufficiently high compliance rates, appropriate amounts of class credit need to be provided and students reminded, particularly through electronic means so they can immediately complete the assessment. 共3兲 Measures should be taken to minimize the motivation and ease for students to engage in “cheating” behavior. This includes not basing course grades on performance on on-line assessments, limiting student access to the assessments, clearly communicating expectations to students about how the assessment is to be used and not used, and limiting the number of items present in any one web page. 共4兲 Periodic or continual checking ought to be carried out to alert instructors and/or administers if rates of cheating behavior become significant. Means could include collecting information on browser events as utilized here and anonymous surveys on the behavior of self and others.
010106-7
PHYS. REV. ST PHYS. EDUC. RES. 4, 010106 共2008兲
SCOTT BONHAM
You are about to take a survey of your understanding in your Astronomy or Physics course. Your performance on this survey will have no adverse effect on your grade, though you may receive some course credit for simply completing the survey. The purpose of this is to assess student understanding in the course and assess different components of the course, both in and out of class. Because this is part of the Astronomy and Physics Department’s ongoing effort to improve instruction in general education courses, we do ask that you take this survey seriously, answering each question with what you believe the best answer is. Because of the nature of this survey, we also ask you to
共1兲 Complete the survey at this time. Once you start taking this survey, you will not be allowed to quit and retake it at a later time. Make sure you have 20– 25 minutes to complete this set of questions. 共You very well may take less.兲 If not, cancel out and return at another time when you have time. 共2兲 Do not use any other resources. Please do not ask or receive help from any persons, books, notes, websites, etc. We want to know what you personally know and believe, and none of your responses will be marked wrong. 共3兲 Maintain integrity of the survey. Please do not discuss this survey with anyone who has not yet taken it or keep copies of any of the questions in electronic or paper form. The copyright holders have given permission for it to be used only for assessment and no other purpose. Which means none of these questions will be on your tests in class, anyway. For your convenience, multiple-choice questions will automatically advance when you make your selection. If you do not like this feature, there will be a checkbox you can turn it off. You can also skip ahead and go back over questions. If for some reason you do not wish to complete this survey in this mode, you may make arrangements to complete the survey on paper for the same credit by contacting Dr. Scott Bonham at
[email protected]
*
[email protected]
10 D.
ACKNOWLEDGMENTS
The author would like to thank Richard Gelderman and Micheal Carini for creating the astronomy assessment as well as being cooperating instructors. The other cooperating instructors were Thomas Bohuski, Brett Bolen, Sergey Marchenko, Charles McGruder, Roger Scott, and Louis-Gregory Strolger. He would also like to thank Andrew Elby for assistance with and permission to use EBAPS in this study.
APPENDIX: USER AGREEMENT
1 D.
Hestenes, M. Wells, and G. Swackhamer, Force Concept Inventory, Phys. Teach. 30, 141 共1992兲. 2 R. Hake, Interactive-Engagement vs. Traditional Methods: A SixThousand-Student Survey of Mechanics Test Data for Introductory Physics Courses, Am. J. Phys. 66, 64 共1998兲. 3 A. Titus, L. Martin, and R. Beichner, Web-based Testing in Physics Education: Methods and Opportunities, Comput. Phys. 12, 117 共1998兲. 4 A. C. Bugbee, The Equivalence of Paper-and-Pencil and Computer-Based Testing, J. Res. Comput. in Educ. 28, 282 共1996兲. 5 D. Bartram and A. Brown, Online Testing: Mode of Administration and the Stability of OPQ 32i Scores, Int. J. Selection Assessment 12, 278 共2004兲. 6 D. Zandvliet and P. Farragher, A Comparison of ComputerAdministered and Written Tests, J. Res. Comput. Educ. 29, 423 共1997兲. 7 S. Bonham, D. Deardorff, and R. Beichner, A Comparison of Student Performance Using Web and Paper-Based Homework in College-Level Physics, 40, 1050 共2003兲. 8 D. MacIsaac, R. P. Cole, D. M. Cole, and L. McCullough, Standardized Testing in Physics via the World Wide Web, Electron. J. Sci. Education 6, 共2001兲. 9 L. Olson, Impact of Paper-and-Pencil, Online Testing Is Compared, Educ. Week 25 71 共2005兲.
M. Zimmaro, Systematic Validity of Unproctored Online Testing: Comparison of Proctored Paper-and-Pencil and Unproctored web-based Mathematics Placement Testing, Ph.D. thesis Pennsylvania State University, 2003. 11 E. F. Redish, J. M. Saul, and R. N. Steinberg, Student Expectations in Introductory Physics, Am. J. Phys. 66, 212 共1998兲. 12 A. Elby, Helping Physics Students Learn about Learning, Am. J. Phys. 69, S54 共2001兲. 13 S. Bonham, Reliability, Compliance and Security of Web-based Pre/Post-testing, in Proceedings of Physics Education Research Conference, edited by L. McCullough, L. Hsu, and P. Heron, AIP Conf. Proc. No. 883, 共AIP, Melville, NY兲, p. 133. 14 R. Beichner, J. Saul, D. Abbott, J. Morse, D. Deardorff, R. Allain, S. Bonham, M. Dancy, and J. Risley, Student Centered Activities for Large Enrollment Undergraduate Programs 共SCALEUP兲 Program, in PER-Based Reform in University Physics, edited by E. Redish and P. Cooney 共American Association of Physics Teachers, College Park, MD, 2007兲. 15 L. Bao and E. F. Redish, Concentration Analysis: A Quantitative Assessment of Student States, Am. J. Phys. 69, S45 共2001兲. 16 Microsoft, Html and Dhtml Reference, http:// msdn.microsoft.com/library/default.asp?url⫽/workshoo/author/ dhtml/dhtml_node_entry.asp 17 Sun Microsystems, Java 2 Platform Standard Edition 5.0 Api Specification, http://java.sun.com/j2se/1.5.0/docs/api 18 T. Shiran and U. Shiran, Javascript Selections, http:// www.rebreference.com/js/column12/
010106-8