REVIEW ARTICLE
Sports Medicine 2001; 31 (3): 211-234 0112-1642/01/0003-0211/$22.00/0 © Adis International Limited. All rights reserved.
Reliability of Power in Physical Performance Tests Will G. Hopkins,1 Elske J. Schabort2 and John A. Hawley3 1 Department of Physiology, School of Medical Sciences, University of Otago, Dunedin, New Zealand 2 Sports Science Institute of South Africa, Cape Town, South Africa 3 Exercise Metabolism Group, School of Medical Sciences, RMIT University, Melbourne, Australia
Contents Abstract . . . . . . . . . . . . . . . . . . . . . . . . . . . . . . . . . . . . 1. Methods . . . . . . . . . . . . . . . . . . . . . . . . . . . . . . . . . . . . 1.1 Measures of Reliability . . . . . . . . . . . . . . . . . . . . . . . . . . 1.1.1 Standard Deviation of Individual’s Difference Score (SD diff) 1.1.2 Analysis of Variance (ANOVA) . . . . . . . . . . . . . . . . . . 1.1.3 Retest Correlation Coefficient & SD (r & SD) . . . . . . . . . . 1.1.4 Mean of the Intraindividual SD (Mean SD) . . . . . . . . . . . 1.2 Measures of Performance . . . . . . . . . . . . . . . . . . . . . . . . 1.3 Types of Performance Test . . . . . . . . . . . . . . . . . . . . . . . . 1.4 Statistical Analyses . . . . . . . . . . . . . . . . . . . . . . . . . . . . 2. Factors Affecting Reliability . . . . . . . . . . . . . . . . . . . . . . . . . . 2.1 Type of Test . . . . . . . . . . . . . . . . . . . . . . . . . . . . . . . . 2.2 Athletic Status . . . . . . . . . . . . . . . . . . . . . . . . . . . . . . . 2.3 Gender . . . . . . . . . . . . . . . . . . . . . . . . . . . . . . . . . . . 2.4 Mode . . . . . . . . . . . . . . . . . . . . . . . . . . . . . . . . . . . . 2.5 Test Duration . . . . . . . . . . . . . . . . . . . . . . . . . . . . . . . . 2.6 Inter-Trial Time . . . . . . . . . . . . . . . . . . . . . . . . . . . . . . . 2.7 Test-Specific Factors . . . . . . . . . . . . . . . . . . . . . . . . . . . 2.7.1 Constant-Duration Tests . . . . . . . . . . . . . . . . . . . . . 2.7.2 Isokinetic Tests . . . . . . . . . . . . . . . . . . . . . . . . . . . 2.7.3 Critical-Power Tests . . . . . . . . . . . . . . . . . . . . . . . . 2.7.4 Anaerobic-Threshold Tests . . . . . . . . . . . . . . . . . . . . 2.7.5 Incremental Tests to Peak . . . . . . . . . . . . . . . . . . . . 2.8 Other Factors . . . . . . . . . . . . . . . . . . . . . . . . . . . . . . . 2.8.1 Quality of Ergometer . . . . . . . . . . . . . . . . . . . . . . . 2.8.2 Experimental Technique . . . . . . . . . . . . . . . . . . . . . 2.8.3 Subject-Specific Factors . . . . . . . . . . . . . . . . . . . . . 2.9 Practice Effects . . . . . . . . . . . . . . . . . . . . . . . . . . . . . . 3. Conclusion . . . . . . . . . . . . . . . . . . . . . . . . . . . . . . . . . . .
Abstract
. . . . . . . . . . . . . . . . . . . . . . . . . . . . .
. . . . . . . . . . . . . . . . . . . . . . . . . . . . .
. . . . . . . . . . . . . . . . . . . . . . . . . . . . .
. . . . . . . . . . . . . . . . . . . . . . . . . . . . .
. . . . . . . . . . . . . . . . . . . . . . . . . . . . .
. . . . . . . . . . . . . . . . . . . . . . . . . . . . .
. . . . . . . . . . . . . . . . . . . . . . . . . . . . .
. . . . . . . . . . . . . . . . . . . . . . . . . . . . .
. . . . . . . . . . . . . . . . . . . . . . . . . . . . .
. . . . . . . . . . . . . . . . . . . . . . . . . . . . .
. . . . . . . . . . . . . . . . . . . . . . . . . . . . .
. . . . . . . . . . . . . . . . . . . . . . . . . . . . .
. . . . . . . . . . . . . . . . . . . . . . . . . . . . .
. . . . . . . . . . . . . . . . . . . . . . . . . . . . .
. . . . . . . . . . . . . . . . . . . . . . . . . . . . .
211 212 212 213 213 213 213 214 214 218 221 221 225 225 225 227 227 228 228 228 228 228 229 229 229 230 230 230 231
The reliability of power in tests of physical performance affects the precision of assessment of athletes, patients, clients and study participants. In this meta-analytic review we identify the most reliable measures of power and the factors affecting reliability. Our measures of reliability were the typical (standard) error of meas-
212
Hopkins et al.
urement expressed as a coefficient of variation (CV) and the percent change in the mean between trials. We meta-analysed these measures for power or work from 101 studies of healthy adults. Measures and tests with the smallest CV in exercise of a given duration include field tests of sprint running (~0.9%), peak power in an incremental test on a treadmill or cycle ergometer (~0.9%), equivalent mean power in a constant-power test lasting 1 minute to 3 hours on a treadmill or cycle ergometer (0.9 to 2.0%), lactate-threshold power (~1.5%), and jump height or distance (~2.0%). The CV for mean power on isokinetic ergometers was relatively large (>4%). CV were larger for nonathletes versus athletes (1.3 ×), female versus male nonathletes (1.4 ×), shorter (~1-second) and longer (~1-hour) versus 1-minute tests (≤1.6 ×), and respiratory- versus ergometer-based measures of power (1.4 to 1.6 ×). There was no clear-cut effect of time between trials. The importance of a practice trial was evident in studies with >2 trials: the CV between the first 2 trials was 1.3 times the CV between subsequent trials; performance also improved by 1.2% between the first 2 trials but by only 0.2% between subsequent trials. These findings should help exercise practitioners and researchers select or design good measures and protocols for tests of physical performance.
The reliability of performance of a test refers to the consistency or reproducibility of performance when someone performs the test repeatedly. A test with poor reliability is unsuitable for tracking changes in performance between trials, and it lacks precision for the assessment of performance in a single trial.[1] Researchers and practitioners who assess performance of study participants, patients, athletes or other clients should therefore use tests with high reliability. To help these professionals in their quest for accurate measurement, we have reviewed the reliability of tests of physical power performed in the laboratory and in the field. Our main interest is reliability of performance with athletes, but we have included all studies of reliability of power or related measures of physical performance with healthy adults. Bringing reliability studies together in a metaanalysis was challenging, because different authors have used or misused different measures of reliability for different measures of performance We therefore begin this review by explaining how we converted the various measures of reliability to what we consider to be the 2 best measures: the typical or standard error of measurement, and the change in mean performance between trials. We then explain how we converted reliability of the various measures of performance to a common Adis International Limited. All rights reserved.
measure: reliability of mean or peak power output by an individual during the test. An important issue in the evaluation of the utility of a test is validity, which refers to the extent to which an individual’s test performance reflects true or criterion performance. We have not attempted to deal with validity in this review, because there is a need for more theoretical work on the best measures of validity for a meta-analytic synthesis. It is already apparent that the reliability of the test and criterion measures need to be included in the analysis, especially to address the important question of how well changes in a test measure track changes in a criterion measure.[2] None of the published studies of the validity of measures of physical performance has included reliability of the criterion measure, so a meta-analysis is some way off. In the meantime, researchers and practitioners should use tests with high reliability, because these are the only tests that can have high validity. 1. Methods 1.1 Measures of Reliability
The methods we have used to assess reliability are described in recent reviews.[1-3] Briefly, our main measure of reliability is the typical percent error: the standard error of measurement expressed Sports Medicine 2001; 31 (3)
Reliability of Power in Physical Performance Tests
as a coefficient of variation (CV). This measure is equivalent to the standard deviation (SD) of an individual’s repeated measurements, expressed as a percent of the individual’s mean test score. The CV is appropriate for comparison of reliability between studies with participants of different mean power (e.g. males versus females). As a dimensionless measure, the CV also allows direct comparison of reliability of performance measures that are proportional to power (e.g. running speed on a treadmill) irrespective of calibration or scaling of the measures: the smaller the CV, the better the reliability. Our other measure of reliability is the percent change in mean performance between trials. A substantial change in the mean indicates a practice effect: a change in skill, fitness, motivation, fatigue or anxiety brought about by the previous trial. It could also indicate failure to prevent a consistent shift between trials in factors that affect performance of a particular test, such as environmental conditions. The measure of reliability cited in most publications is the retest correlation coefficient (r). Although this measure is dimensionless, it is sensitive to the heterogeneity (interindividual SD) of the sample. The magnitude of the correlation is also difficult for nonstatisticians to interpret. Thus, r is unsuitable for comparing reliability of measures between studies, so we have not reported it here. We conducted several searches of the Medline and SportDiscus databases using combinations of the keywords reliability, reproducibility, endurance, aerobic, anaerobic, sprint, isokinetic, jump and lactate. We pursued all references to other reliability studies in published work. We also found some reliability data by chance in experimental studies that did not appear in our database searches; doubtless there are others. Altogether we found 101 studies in which the authors provided a CV or enough data to calculate a CV for physical power or a closely related measure. We (or the authors) used 4 methods for the calculation, described below.[1] Estimates of the bias with some of these methods are based on our unpublished simulations. Adis International Limited. All rights reserved.
213
1.1.1 Standard Deviation of Individual’s Difference Score (SD diff)
When divided by √ 2 , this SD yields the typical error in absolute units. If the authors provided the raw data for each individual, we obtained the CV by performing the calculation on the natural logarithm of the performance measure. If the authors provided the typical error without the raw data, we derived the CV by expressing the typical error as a percent of the mean of the sample – a procedure that results in substantial bias in the CV (by a factor of 1.04 or more) only in the apparently rare instances of an interindividual SD >35% of the mean. 1.1.2 Analysis of Variance (ANOVA)
This method, or an equivalent repeated-measures analysis, is appropriate and exact for calculation of the CV averaged over 3 or more trials. We have shown the authors’ estimate of CV by this method only if the authors provided insufficient data for us to use the SD diff method. 1.1.3 Retest Correlation Coefficient & SD (r & SD)
This is a combination of the r between 2 trials and the interindividual SD averaged over the 2 tri 1−r , which is als. The typical error is given by SD√ converted to a CV by expressing it as a percent of the mean. This method is exact when r is the appropriate intraclass correlation coefficient; for a Pearson correlation it underestimates the CV at most by a factor of 0.95 for >9 individuals, and at most 0.90 for 7 individuals. There were only 3 studies with 7 to 9 participants analysed by this method, and we considered the likely bias to be too small to warrant exclusion of these studies from the meta-analyses. 1.1.4 Mean of the Intraindividual SD (Mean SD)
Authors using this method derived a SD for each participant from the 2 or more trials, then averaged them. Averaging SD rather than variances underestimates the CV typically by a factor of 0.82 for 2 trials; the bias is almost negligible (≥0.90) for ≥3 trials. However, a true change in the mean between trials results in an overestimate of the CV by this method; and, for a change in the mean equal to one CV in one trial, the overestimate cancels out the underestimate. All CV derived by this method (from one study of 2 trials and 5 studies of ≥3 trials) Sports Medicine 2001; 31 (3)
214
have therefore been included in our meta-analyses without adjustment. 1.2 Measures of Performance
Ergometers measure work or power, but some ergometer-based tests and all field tests provide measures of performance in units of distance, time or speed. For comparison of reliability between measures, we have converted the reported CV for the measure of performance into a CV for power by differentiating the relationship between power and performance.[2] Thus, if power P is some function f(X) of the performance variable X, then P = f(X), and for small changes δP and δX representing typical errors or changes in the mean: δP = f′(X)δX
where f′(X) is the first derivative of f(X). Therefore: 100δP/P = (CV for P) = [Xf′(X)/f(X)]100δX/X = (Xf′(X)/f(X)][CV for X]
This seemingly complex equation usually takes a simple form; for example, in fluid-braked ergometry or exercise, P = kV3, where V is the velocity and k is a constant, so CV for P = 3(CV for V). The equation applies accurately to peak power and to mean power in a test performed at constant pace. If power varies substantially during a self-paced test, the equation is less accurate for mean power, but most athletes appear to perform self-paced tests at near constant pace. 1.3 Types of Performance Test
We have identified 9 types of performance test where the outcome is a measure of power or work: constant-work, constant-duration, pre-load, isoinertial, isokinetic, constant-power, critical-power, incremental for anaerobic threshold and incremental for peak power. Tables I to VIII contain summaries of studies that included data on reliability of performance in these tests. In constant-work tests (table I), also known as time trials, an individual completes a set amount of work or a set distance (real or simulated) as quickly as possible. These tests represent good simulations Adis International Limited. All rights reserved.
Hopkins et al.
of the bioenergetics of most competitive events lasting several minutes or more. Included in table I are several tests that combine sprints or a time trial with one or more pre-loads (or intervening loads) of exercise at a lower workload. To some extent these tests simulate the sustained bursts of high-intensity exercise that occur during or at the end of some endurance events (e.g. road cycling). Constant-duration tests (table II) are similar to constant-work tests, but an individual completes as much work or covers as much distance as possible in a set time. In the shorter tests, for example the 30-second Wingate test, power rises to a peak in the first few seconds and provides a measure of performance additional to mean power. Table II includes one constant-duration test with a pre-load. Iso-inertial tests (table III) are the shortest form of the previous 2 tests: a single movement (jump, press or throw) performed explosively against the inertia of body or limb mass, sometimes with additional external mass. A few authors used ergometers to measure peak or mean power, but most used the more practical measure of vertical or horizontal distance of a jump or a throw. The CV for distance is equivalent to the CV for work rather than peak or mean power. Performance is usually determined from the mean or best of several repetitions of the movement. Isokinetic tests (table IV) require ergometers that limit the speed of limb movement to a chosen value. As with iso-inertial tests, individuals perform several repetitions explosively, and performance is peak power, mean power or total work. For a fixed number of complete repetitions the CV for mean power and total work should be the same: isokinetic exercise implies constant velocity and therefore constant duration, but mean power = work/duration, so CV for mean power = CV for work. Included in table IV are data from a study with an isotonic ergometer, which limits the force rather than the speed of a movement. In constant-power or constant-load tests (table V) an individual maintains a constant power output to the point of exhaustion, defined by inability to maintain power, speed, or cadence. The tests are Sports Medicine 2001; 31 (3)
Reliability of Power in Physical Performance Tests
215
Table I. Constant-work tests, sorted by test durationa Reference
Participants; Inter-trial Mode; ergometer or timer; number of trials time distance or work
Sawka et al.[4]
13 F, 31 M; 2
≥1d
Jackson & Baumgartner[5]b Risberg et al.[6]
76 M; 2
3 min
12 F, 9 M elite athletes; 2
48h
Zhou & Weston[75]
Weltman et al.[76]
Nummela et al.[77]
10 M cyclists; 2
15 M runners; 2
13 M athletes; 2
4wk
7d
≥48h
Run; Pacer
Cycle, Repco
Run; ?
Run; ?
Mean SD
r & SDd
r & SD
r & SD
CV (%)
Change in mean (%)
Speedb at 4 mmol/L lactate
1.4
0.8, –0.3
Speed at other lactates . VO2 at 4 mmol/L lactate . VO2 at other lactates
1.3-3.0
0.6, 0.4
2.9
2.3, 1.3
2.1-4.4
1.3, 1.1
Powerc at Dmax lactate . VO2 at Dmax lactate . Power at VE threshold . . VO2 at VE threshold
1.6
–0.3
1.9
0.5
2.2
1.3
1.6
2.0
Power at 4 mmol/L lactate . VO2 at 4 mmol/L lactate
2.1
–0.2
3.3
0.7
Speedb at 4 mmol/L lactate
1.7
2.1
Speed at other lactates . VO2 at 4 mmol/L lactate . VO2 at other lactates
1.8-3.0
0.5
3.7
1.0
3.2-4.3
–1.0
Powere in MART at 10 mmol/L lactate
2.4
3.9
Power in MART at 5 mmol/L lactate
5.9
4.7
McLellan & Jacobs[78]
11 M; 2
5d
Cycle; Ergomed
r & SD
Power at IAT lactate
2.5
–1.5
Dickhuth et al.[79]
11 volunteers; 2
7d
Run; Jaeger Laufergotest
r & SD
Speedb at ∆1.5 mmol/L lactate
2.8
2.3
Cheng et al.[80]
8 M cyclists; 2
7d
Cycle; Lode
r & SD
Jensen & Johansen[8]
7 M cyclists; 2
7d
Cycle; Politecnica
SD diff
Meyer et al.[81]
5-7 participants; 2 1d
Cycle; ?
SD diffc
Caiozzo et al.[82]
2 F, 14 M; 2
?
Cycle; Monark
r & SD
Davis et al.[83]
30 M; 2
1-5d
Run; Young
r & SD
Cycle; Quinton
r & SD
Speed at ET-CO2 threshold
3.6
1.6
Speed at lactate turn point . Speed at VCO2 threshold . VO2 at Dmax lactate
5.4
3.0
5.8
2.8
4.0
–2.0
Power at 2 mmol/L lactate
4.3
–0.3
Power at 4 mmol/L lactate . . . VO2 at VE/VO2 threshold . VO2 at lactate threshold . . . VO2 at VE/VO2 threshold . . VO2 at VE threshold
4.2
1.2
a
Two CV or changes in the mean in a study of 3 trials are for consecutive pairs of trials (1 + 2, 2 + 3).
b
CV for running speed = CV for mean power.
c
Power estimated from time to reach threshold.
d
We used changes in the mean to adjusted the authors’ estimates.
e
Power estimated from treadmill speed and inclination. CV shown in publication is incorrect.
4.6
–0.5
5.6
–6.1
6.3
?
6.3
–3.9
6.4
–1.2
Dmax = maximum deflection; ET-CO2 = end-tidal CO2; F = female; IAT = individual anaerobic threshold; M = male; MART = maximum anaerobic running test; r & SD = a combination of the retest correlation and the interindividual SD; SD = standard deviation; SD diff = the SD of the . . . 2 ; VCO2 = CO2 production; VE = ventilation; VO2 = oxygen consumption; ∆1.5 mmol/L = 1.5 mmol/L above difference scores divided by √ lactate baseline; ? indicates uncertain.
variation, the true effects of the covariates are likely to be more complex than simple polynomials, and the model we have used does not include interactions. Some differences in CV between types of test may also be caused by factors that we Adis International Limited. All rights reserved.
have been unable to control for, such as ergometer quality and operator skill; for example, isokinetic movement may not be inherently less reliable than other movements, but isokinetic ergometers may introduce more error than other kinds of ergometer. Sports Medicine 2001; 31 (3)
Reliability of Power in Physical Performance Tests
In view of these uncertainties with the statistical modelling, a ranking of measures on the basis of the smallest CV in each table is also justified. We kept in mind that, for a typical sample size (~15) and 2 trials, the likely range for the true value of a CV is 0.7 to 1.5 times the observed value;[1] the measure with the lowest observed CV is therefore not necessarily the best. We also took into account factors in table X and other factors that might affect the CV. The lowest CV with athletes appear to be: (i) equivalent mean power in a constant-power test lasting 1 to 60 minutes on a treadmill or a Lode cycle ergometer (~0.7 to 2.0%); (ii) peak power in an incremental test, performed with SRM cycle cranks or on a Lode cycle ergometer (~0.9%); (iii) peak or mean power, measured over 5 to 15 seconds on a modified Monark cycle ergometer (~0.9%); and (iv) field tests of sprint running (~0.9%). We have little doubt that longer (up to 15 minutes) field tests of running and possibly of other modalities will turn out to be equally reliable, because the CV for time of top track runners in international events over distances of 100 to 5000m is 0.8 to 1.1%.[109] All these tests are suitable for studies of performance with elite athletes, because the similarity of CV in tests and competitions means that researchers can use realistic sample sizes to delimit the small changes in performance that affect an athlete’s chances of placing in a competitive event.[2] For exercise lasting several hours, self-selection of pace probably becomes the main factor limiting reliability of constant-work or constant-distance tests, so equivalent mean power in a laboratory- or field-based constant-power test will probably turn out to have the lowest CV. The remarkably low CV (0.7%) for equivalent mean power in a ~3-hour constant-power test[65] needs to be replicated with a larger sample. Currently the best measure for such long exercise in a constant-work test is mean power on a Kingcycle ergometer (CV ~3.5%).[16] The best measure of performance of explosive iso-inertial exercise is probably distance or height in some simple test of jumping (although there is an unexplained wide variation in reliability between Adis International Limited. All rights reserved.
225
studies in table III). In spite of their larger CV, jump measures are probably on an equal footing with measures of mean power in longer tests, because brief tests are inherently less reliable (see section 2.5). The best CV in these tests (~2.0%) are similar to the 1.7 to 2.3% of top competitors in international jumping events.[109] 2.2 Athletic Status
It is clear from table X that athletes are more reliable than nonathletes. There are several possible explanations. First, athletes’ frequent exposure to high-intensity exercise during training and in competition may somehow reduce variability of performance. Secondly, fitness may not change to the same extent in athletes as in nonathletes between trials. Thirdly, studies of athletes may be performed generally with better equipment, or researchers may take extra care when the participants are athletes. Finally, if any random error contributed by the equipment or the researchers has a constant absolute value (e.g. ±3W) rather than a constant percent value (e.g. ±1%), this error will have less impact when expressed as a percent of the athletes’ higher power output. 2.3 Gender
Nonathletic females appear to be somewhat less reliable than nonathletic males, possibly for some of the same reasons that nonathletes are less reliable than athletes: the nonathletic females may be less physically active than the nonathletic males, and the power output of females is less than that of males. The menstrual cycle may also reduce reliability, but apparently not when the participants are athletes (possibly because hard training reduces or eliminates the cyclical hormonal fluctuations). 2.4 Mode
Field tests based on running promise to be substantially more reliable than tests based on treadmill running, but more research is needed to reduce the uncertainty in the comparison. There was little or no observed difference between reliability of Sports Medicine 2001; 31 (3)
226
Hopkins et al.
Table VIII. Incremental tests for peak power, sorted approximately by coefficient of variation (CV)a Reference
Participants; number of trials
Balmer et al.[84]
9 M cyclists; 3
≥1wk
Lindsay et al.[13]
8 M cyclists; ≥3
4-5wk
Nummela et al.[77]
13 M athletes; 2
Jensen & Johansen[8] Weltman et al.[76] [85]
Kohrt et al.
Inter-trial Mode; ergometer time
Method of analysis
Performance measure
CV (%)
Change in mean (%)
Cycle; SRM-20
SD diff
Peak power
1.5, 0.8
0.5, –0.7
Cycle; Lode
Mean SD
Peak power
1.1
≥48h
Run; ?
r & SD
7 M cyclists; 2
7d
Cycle; Politecnica
SD diff
Peak powerb,c in MART 1.3 . VO2peak 1.3
15 M runners; 2
7d
Run; ?
r & SD
11-13 M triathletes; 2
48h
Run; Marquette 1800
r & SD
Peak power . VO2peak
2.0
1.9
Ekblom[88]
7 M athletes, 12 M; 2
≤7d
Cycle; Krogh
?
. VO2peak
2.1
?
Wisløff[89]
11 skiers; 1 practice + 2
~7d
Ski; custom ergometer
r & SD
Peak power
2.2
–0.5
2.5
?
McArdle et al.
15 M; 2
≥1d
Cycle; Monark
r & SD
. VO2peak . VO2peak
2.3
–0.3
Le Chevalier et al.[91]
8 M; 2
1wk
[90]
Run; Young Knee extension 90-sec stages; modified Monark
r & SD
Knee extension 60-sec stages; modified Monark Leger & Boucher[92] 11 F, 49 M; 2 [93]
≤10d
Track run; -
SD diff
Magel & Faulkner
17 M swimmers; 2
?d
Swim, tethered; -
r & SD
Leger & Lambert[94]
23 F, 27 M; 2
7d
Shuttle run; -
r & SD
Kimura et al.[95]
10 M swimmers; 2
7d
Swim; arms on Monark plus legs on cords
r & SD
McArdle et al.[96]
35 F, 6 F athletes; 2 3-5d
Walk; ?
r & SD
Run; Quinton 18-60
r & SD
[97]
Sproule et al.
4 F, 16 M; 2
≥3d
Shuttle run; Swaine & Zanker[98] 4 F, 5 M swimmers; ≤7d ≥1 practice + 2
Swim; swim bench SD diff
3.1
0.3
Peak power . VO2peak
2.3
–2.1
7.3
–1.9
Peak power . VO2peak
3.3
3.0
3.7
–1.7
2.5
0.2
2.6
0.0
. Predicted VO2peak d . VO2peak . Predicted VO2peak d . VO2peak
2.8
1.5
2.8
?
. VO2peak . VO2peak
3.3
1.4
3.7
?
. Predicted VO2peak d . VO2peak
4.0 4.1
–2.7
Skinner et al.[99]
4 F, 4 M; 4
≥3d
Cycle; SensorMedics 800S
ANOVA
. VO2peak
4.1e
Skinner et al.[99]
25 F, 30 M; 4
4d
Cycle; SensorMedics 800S
ANOVA
. VO2peak
4.7
Weltman et al.[76]
15 M runners; 2
7d
Run; ?
r & SD
~4.8
0.9
Kyle et al.[100]
12 M runners, 5 M; 3
6d
Run; Quinton
SD diff
. VO2peak . VO2peak
4.8
–1.3, 2.8
Skinner et al.[99]
192 F, 198 M; 2
2d
Cycle; SensorMedics 800S
ANOVA
. VO2peak
5.1
–0.7f
Adis International Limited. All rights reserved.
–0.5, –0.7f
Sports Medicine 2001; 31 (3)
Reliability of Power in Physical Performance Tests
227
Table VIII. Contd Reference
Participants; number of trials
Inter-trial Mode; ergometer time
Method of analysis
1 F, 4 M; 8-20
≥2d
Run; ?
Mean SD
Kuipers et al.
10 M; 20-25
≥7d
Cycle; Lode
Mean SD
Andersen[103]
35 F + M; 2
6wk
Cycle; Monark
SD diff
Katch et al.[101] [102]
Obert et al.[104]
11 F + M swimmers; 2
15d
Swim; swimming pool
r & SD
Performance measure
CV (%)
Change in mean (%)
. VO2peak
5.6
?
5.0
?
Peak power . VO2peak . VO2peak
7.9 5.7
–3.3
Peak power
7.1
?
Peak speedg
6.9
–5.7
a
Two CV or changes in the mean in a study of 3 trials are for consecutive pairs of trials (1 + 2, 2 + 3).
b
CV for running speed = CV for mean power.
c
Power estimated from treadmill speed and inclination. CV shown in publication is incorrect.
d
Predicted linearly from peak running speed.
e
Retests at different sites.
f
Changes in mean not included in our analyses, because the modified protocol for retests may have been more fatiguing.
g
CV shown is for P = 3(CV for V), via P = kV3, where k is a constant; P = power; V = speed.
ANOVA = analysis of variance; F = female; M = male; MART = maximum anaerobic running test; r & SD = a combination of the retest . 2 ; VO2peak = peak (or correlation and the interindividual SD; SD = standard deviation; SD diff = the SD of the difference scores divided by √ maximum) oxygen consumption. ? indicates uncertain.
treadmill running and that of the other modes of exercise (rowing, cycling and swimming), but only the comparison with cycling was clear cut. Until more studies are performed, it seems reasonable to assume that reliability of performance is inherently the same in these modes of exercise. 2.5 Test Duration
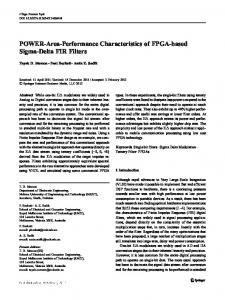
Figure 1 (left-hand panel) shows the CV of performance measures plotted against test duration. A quadratic polynomial gave the best fit, with a minimum at 1 minute. Reliability in 1-second and 1-hour tests was substantially worse than that in tests lasting half a minute at either end of the likely range for the comparisons (table X). The increase in reliability with an increase in test duration up to 1 minute is probably due to the increase in the number of repetitions of limb movements, because independent random errors in each repetition tend to cancel out as more repetitions are added. With enough repetitions the error due to single repetitions becomes negligible, but by this stage reliability of mean power is determined by the reliability of glycolytic and aerobic systems rather than the reliability of the phosphagen-generated power of single repetitions. Adis International Limited. All rights reserved.
The lower reliability of endurance tests lasting more than a few minutes may be due in part to variation in pace in those tests that are performed at self-selected pace. Changes in training or nutrition in the lead-up to each trial may also have a greater effect on these longer tests, and motivation to maintain power output in the face of the fatigue of longer endurance exercise could also be more variable than in shorter tests. Reliability studies of constant-power tests lasting longer than 60 minutes are needed to help resolve these issues. 2.6 Inter-Trial Time
Figure 1 shows a weak quadratic polynomial fit to the plot of CV versus inter-trial time. (Polynomials of higher order did not fit the data well.) The minimum CV occurred at 2.5 days, but only for the shortest times between tests was there any indication of a substantial increase in the CV. If real, this increase may be caused by individual differences in the effects of fatigue from the preceding trial. We expected to find a reduction in reliability with increasing time between trials, because longer periods allow for more chance of interindividual changes in tiredness, fitness or other factors to affect performance. For example, in a recent study on Sports Medicine 2001; 31 (3)
228
Hopkins et al.
Table IX. Mean coefficient of variation (CV) of performance for various tests and measures as a ratio (fraction or multiple) of the mean CV of mean power for constant-work tests, after controlling for athletic status, gender, duration and inter-trial time Test type
Performance measure
Ratio of CV
95% likely range
Constant power
Equivalent mean power
0.6
0.4-0.9
Anaerobic threshold Lactate-threshold 0.9 power
0.6-1.2
Iso-inertial
0.9
0.7-1.4
Incremental to peak Peak power
Work
0.9
0.6-1.4
Constant work
Mean power
1.0
Constant duration
Mean power
1.2
0.8-1.7
Critical power
Maximum aerobic power
1.3
0.7-2.5
Isokinetic
Mean power
1.7
1.3-2.4
Pre-load
Mean power
1.9
1.4-2.6
the reliability of performance of basketball players in field tests, the CV between trials conducted on consecutive days was greater than the CV between trials on the same day (W.A. Fausett and W.G. Hopkins, unpublished data). This effect of inter-trial time is either not present in the majority of performance tests in this review or is obscured by other effects in our modelling. More studies with different times between trials on the same participants will delimit this apparently small effect. 2.7 Test-Specific Factors 2.7.1 Constant-Duration Tests
On the basis of its likely range shown in table X, the lower reliability of peak power relative to mean power in this test is probably real. The shorter duration of exercise represented by peak power relative to mean power may be partly responsible, although this effect of duration would have to be additional to the global effect of duration already accounted for in our statistical model. It is also possible that the software or hardware of the ergometers used in these tests is less reliable for registering peaks of power than for averaging power or summing work over the duration of the test. Adis International Limited. All rights reserved.
2.7.2 Isokinetic Tests
The nature of the exercise or of the ergometers in these tests appears to be such that there is little likelihood of a substantial difference in the CV of peak power relative to mean power (table X). The same cannot be said for the CV of work, which is substantially greater than that of mean power over its likely range for the comparison. This unexpected finding indicates that, for the average ergometer, there must have been substantial variation in movement speed or substantial variation in the way the ergometer delimited a complete repetition. It is also clear that extension is a more reliable mode of isokinetic movement than flexion, but we do not know why. The effect of angular speed of movement on log(CV) was best described by a straight line, such that the CV increased by a factor of 1.5 (likely range 1.2 to 1.8) for a 240°/s increase in speed (e.g. 300 vs 60°/s). This effect is probably caused by lower reliability with briefer movements, as already discussed. The ergometers may also be less reliable at increasing speed. 2.7.3 Critical-Power Tests
We doubt whether anaerobic capacity is inherently a less reliable physiological parameter than maximum aerobic power (table X). We suspect instead that the difference is a statistical artefact arising from the curve-fitting procedures in critical-power modelling. Simulation might resolve this issue and guide researchers to the best way to fit the critical-power model. Researchers should also investigate the reliability of predicted performance within the range of durations used in the test. Such interpolated performances should have more validity for athletes (i.e. have higher correlations with corresponding constant-work competitive performance) than the extreme extrapolated performances represented by anaerobic capacity and maximum aerobic power; in principle they should also be even more reliable than measures from a single constant-power test. 2.7.4 Anaerobic-Threshold Tests
On the basis of the likely ranges shown in table . X, it is clear that VO2 is a substantially less reliable Sports Medicine 2001; 31 (3)
Reliability of Power in Physical Performance Tests
measure of anaerobic threshold than ergometer power. This difference in reliability must be due either to problems with calibration of respiratory apparatus or greater biological variability associated with respiratory variables. Lactate measures of anaerobic threshold are a little better than ventilatory measures, but the difference is less clear cut. There is no clear contender for the single best measure of lactate anaerobic threshold in table VII, although the traditional 4 mmol/L measure is amongst the most reliable (CV ~1.5% at best). 2.7.5 Incremental Tests to Peak
. Relative to ergometer power, VO2 in these tests shows a loss of reliability similar to that in tests of anaerobic threshold, presumably for similar reasons.
229
Table X. Effect of global and test-specific factors on the typical error of performance, expressed as ratio of coefficients of variation (CV) for the comparisons shown Factors
Ratio of CV
95% likely range
1.3
1.1-1.6
Global factors Athletic status nonathlete/athlete Gender nonathletes: female/male
1.4
1.1-1.7
athletes: female/male
1.1
0.7-1.7
Mode field run/treadmill run
0.7
0.4-1.2
row/treadmill run
0.9
0.4-2.2
cycle/treadmill run
1.0
0.9-1.2
swim/treadmill run
1.0
0.6-1.8
1 sec/1 min
1.6
1.1-2.2
60 min/1 min
1.5
1.1-2.0
1 min/3d
1.1
0.9-1.4
50d/3d
1.0
0.9-1.2
1.3
0.8-2.1
Duration
Inter-trial time
2.8 Other Factors 2.8.1 Quality of Ergometer
We could not analyse quantitatively for the effect of make and model of ergometer on the reliability of performance, owing to the large range of ergometers and the frequent omission of information about the model in publications. However, some apparent trends are worthy of comment. Cycle ergometers that allow athletes to use their own racing bikes (SRM-20 cranks, Kingcycle, Politecnica) have produced some of the smallest CV (tables I, VIII), probably because they give athletes the feel of pace and effort of real competitions. The Concept 2 rowing ergometer produces high reliability (table II), probably because it gives athletes the feel of on-water rowing, and also because most competitive rowers appear to use it frequently. The latest model of the Concept 2 may be even more reliable, because it incorporates a calibration adjustment for previously uncontrolled changes in resistance caused by changes in ambient temperature and barometric pressure between trials.[110] Modified Monark ergometers, or models with weight baskets, seem to be more reliable than the models that apply load via a pendulum (table II). Different makes of isokinetic ergometer appear to differ in reliability (table IV, and discussed above). Finally, the load provided by some electromagnetically Adis International Limited. All rights reserved.
Test-specific factors Constant duration peak/mean power Isokinetic peak/mean power
1.0
0.8-1.3
work/mean power
1.4
1.1-1.9
flexion/extension
1.3
1.1-1.6
anaerobic capacity/aerobic power
2.8
1.6-5.1
Anaerobic threshold . lactate: VO2/ergometer power . ventilatory: VO2/ergometer power
1.4
1.1-1.9
1.6
0.9-2.9
ventilatory/lactate (ergometer power) 1.1 . ventilatory/lactate (VO2 power) 1.3
0.7-1.8
Critical power
Incremental to peak power . VO2/ergometer power . VO2 = oxygen consumption.
1.5
0.8-2.0 1.1-2.0
braked cycle ergometers varies with pedalling speed or with duration of the test;[111-113] researchers should therefore investigate the stability of the load of a particular ergometer with a dynamic calibration rig, or perform a reliability study, before using the ergometer to assess individuals. Studies aimed at comparing the reliability of performance on different ergometers, preferably with the same participants,[1] would be valuable. Sports Medicine 2001; 31 (3)
230
Hopkins et al.
10
1
1
0.5
0.5
CV (%)
10
0.01
0.1
1
10
100
Duration of test (min)
0.0001 0.001
0.01
0.1
1
10
100
Time between trials (d)
Fig. 1. Log-log plots of the typical error of performance expressed as a coefficient of variation (CV) against duration of tests (left) and time between trials of tests (right). Points are for all performance measures and tests in tables I to VIII, except duration of constant-work and constant-power tests. Continuous curves are best-fit quadratics; dashed curves enclose the 95% likely range of the true value.
2.8.2 Experimental Technique
Researchers use different criteria for defining measures; for example, peak power may be the instantaneous highest value or an average over a certain period. The extent to which these different definitions impact reliability is unknown. Inconsistent application of a warm-up protocol may also reduce reliability of some measures of performance. Researchers also have different methods of motivating participants to make peak efforts, ranging from financial incentives to doing nothing at all. Differences in these methods, and differences in the degree or trust or respect between participants and researchers, may account for some of the differences in reliability between measures in otherwise similar studies. 2.8.3 Subject-Specific Factors
By calculating CV of performance for individual participants in multiple trials, several groups of researchers have found differences in reliability between individuals.[63,101,102] There were insufficient data for more than tentative identification of the factors responsible for the differences. In a study of 15 males in 5 trials over 12 or more days, large interindividual differences in the CV for duration of a constant-power test[63] were probably a consequence of individual differences in the powerduration relationship.[2] Differences in the reliabil. ity of VO2max of 5 participants who performed 8 to 20 trials over 2 to 4 weeks[101] appear (to us) to have Adis International Limited. All rights reserved.
been due partly to greater variability in the less fit or athletic participants and partly to lack of correction for a training effect in some participants. Fi. nally, a group who tracked peak power and VO2max of 10 males in 20 to 25 trials over 9 to 12 months wondered whether differences in CV between participants were due to different changes in exercise efficiency;[102] it is also likely that different systematic changes in fitness between individuals were partly responsible. Personality or other psychological traits might have made some participants more variable in their motivation to perform to peak effort in these studies. Participants with greater variation in physical activity, training, or diet before each trial might also show greater variation in performance. For example, tests of anaerobic threshold based on submaximal incremental protocols are unaffected by motivational factors, but they may be more sensitive to diet and exercise in the preceding 1 to 2 days than other tests. As yet there has been no systematic study of these possible effects. 2.9 Practice Effects
For the 17 tests with CV between pairs of 3 or more trials, the CV between the first 2 trials was 1.3 times the CV between subsequent trials (likely range 1.1 to 1.6). The difference between athletes and nonathletes was negligible. For the 30 tests with changes in mean performance between pairs Sports Medicine 2001; 31 (3)
Reliability of Power in Physical Performance Tests
of 3 or more trials, performance increased between the first 2 trials by 1.2% (likely range 0.5 to 1.9%), whereas the increase between subsequent trials was only 0.2% (likely range –0.3 to 0.7%). Again, athletes and nonathletes showed similar changes in the mean. In the 81 tests for which means of only 2 trials were reported, the mean increase in performance between trials was 0.7% (likely range 0.4 to 1.0%). This increase is somewhat less than the 1.2% for the first 2 trials of tests with 3 or more trials, presumably because some of the tests with 2 trials included a familiarisation trial that was not reported. These changes in the CV and mean performance between the first 2 trials are important in the assessment of elite athletes[2] but may be negligible in population studies of nonathletes or for assessment of musculoskeletal function in a therapeutic setting. The decrease in variability and the increase in mean performance with repeated testing are consistent with fitness, skill, or motivation effects arising from the first trial. In general, the effect did not extend beyond the second trial to any substantial extent. Some studies showed small reductions in performance between the first 2 trials, but in general these were of a magnitude that would occur by chance in the presence of a true increase in performance of ~1%. However, one study[43] of an isokinetic test had very short inter-trial intervals (40 and 160 seconds), so the large reductions in performance in this test were probably a fatigue effect. We excluded this study from our analysis of changes in the mean. More research will reveal which types of measure and test are more sensitive to practice effects. The fact that practice effects are similar for athletes and nonathletes is a little surprising, inasmuch as athletes are obviously more accustomed to the demands of exercise tests or competitions. It is also at odds with a recent study, in which nonathletes showed substantially greater change (~5%) than cyclists in peak power on an iso-inertial cycle ergometer between repeated trials on the same day and on consecutive days.[114] On the other hand, elite rowers who had performed a test many times pre Adis International Limited. All rights reserved.
231
viously as part of their training programme showed a reduction in CV and an increase in performance between the first 2 trials in a series of 3.[9] These athletes had either lost the feel of the test to some extent before the start of the study, or some responded differently in the first trial because of the unfamiliar milieu of a laboratory study. 3. Conclusion The typical error of performance in tests of physical power is affected by several factors: the type of test, the type of measure, athletic status, gender (for nonathletes) and the duration of the test. Factors likely to have small or negligible effects include gender (for athletes) and time between trials. Mode of exercise also has little effect, although field tests of running may be more reliable than ergometer-based tests. Quality of ergometer appears to affect reliability, but our analysis of this effect was only qualitative. Measures and tests that give the smallest typical error for a given duration of exercise with athletes include peak power in an incremental test, field tests of running, and equivalent mean power in a constant-power test. These tests have sufficiently high reliability for use in studies of factors that produce small but important changes in performance in elite athletes. However, anyone testing athletes should be aware that the most reliable test is not necessarily the best test for tracking changes in competitive performance: the motivation, training or nutrition of athletes in competitions may differ from those in laboratory or field studies, and these differences may have different effects on changes in performance in tests and competitions. Longitudinal studies are needed to address this issue. There is clear evidence of practice effects between the first 2 trials of a test. The magnitudes of the effects are substantial in relation to athletic performance, but may be less important in population studies or for assessment of patients. We conclude that at least one practice trial should precede formal testing, especially with athletes. Sports Medicine 2001; 31 (3)
232
Hopkins et al.
Useful topics for future studies of reliability include: comparison of the reliability of specific measures and ergometers; the reliability of performance predicted from critical-power models; verification of the apparent high reliability of constantpower tests, especially for tests lasting several hours; the effect of psychological states and traits on reliability; and identification of the most reliable measures under field rather than controlled laboratory conditions. Analysis of reliability in terms of typical percent error and percent changes in the mean will make the results from these studies more accessible. Acknowledgements The authors thank Russell Wolfinger at the SAS Institute for statistical advice and Michael McMahon for valuable suggestions on a draft version. The following people also provided useful feedback on a draft version: David Bishop, Richard Davison, Lorne Goldenberg, Kathleen Kranenburg, Jay Morgan, Carl Paton and Mark Smith.
References 1. Hopkins WG. Measures of reliability in sports medicine and science. Sports Med 2000; 30: 1-15 2. Hopkins WG, Hawley JA, Burke LM. Design and analysis of research on sport performance enhancement. Med Sci Sports Exerc 1999; 31: 472-85 3. Hopkins WG. A new view of statistics. Sportscience [online]. Available from: URL: http: //sportsci.org/resource/stats [Accessed 2001 Jan 4] 4. Sawka MN, Tahamont MV, Fitzgerald PI, et al. Alactic capacity and power: reliability and interpretation. Eur J Appl Physiol 1980; 45: 109-16 5. Jackson AA, Baumgartner TA. Measurement schedules of sprint running. Res Q 1969; 40: 708-11 6. Risberg MA, Holm I, Ekeland A. Reliability of functional knee tests in normal athletes. Scand J Med Sci Sports 1995; 5: 24-8 7. Fitzsimons M, Dawson B, Ward D, et al. Cycling and running tests of repeated sprint ability. Aust J Sci Med Sport 1993; 25: 82-7 8. Jensen K, Johansen L. Reproducibility and validity of physiological parameters measured in cyclists riding on racing bikes placed on a stationary magnetic brake. Scand J Med Sci Sports 1998; 8: 1-6 9. Schabort EJ, Hopkins WG, Hawley JA, et al. High reliability of performance of well-trained rowers on a rowing ergometer. J Sports Sci 1999; 17: 627-32 10. Buono MJ, Borin TL, Sjoholm NT, et al. Validity and reliability of a timed 5 km cycle ergometer ride to predict maximum oxygen uptake. Physiol Meas 1996; 17: 313-7 11. Palmer GS, Dennis SC, Noakes TD, et al. Assessment of the reproducibility of performance testing on an air-braked cycle ergometer. Int J Sports Med 1996; 17: 293-8 12. Smith MF, Davison RCR, Balmer J, et al. Reliability of mean power recorded during indoor and outdoor self-paced 40-km cycling time trials. Int J Sports Med. In press
Adis International Limited. All rights reserved.
13. Lindsay FH, Hawley JA, Myburgh KH, et al. Improved athletic performance in highly trained cyclists after interval training. Med Sci Sports Exerc 1996; 28: 1427-34 14. Jeukendrup A, Saris WHM, Brouns F, et al. A new validated endurance performance test. Med Sci Sports Exerc 1996; 28: 266-70 15. Hickey MS, Costill DL, McConell GK, et al. Day to day variation in time trial cycling performance. Int J Sports Med 1992; 13: 467-70 16. Schabort EJ, Hawley JA, Noakes TD, et al. A new reliable laboratory test of endurance performance for road cyclists. Med Sci Sports Exerc 1998; 30: 1744-50 17. Madsen K, Maclean DA, Kiens B, et al. Effects of glucose, glucose plus branched-chain amino-acids, or placebo on bike performance over 100 km. J Appl Physiol 1996; 81: 2644-50 18. Nicholas CW, Nuttall FE, Williams C. The Loughborough Intermittent Shuttle Test: a field test that simulates the activity pattern of soccer. J Sports Sci 2000; 18: 97-104 19. Doyle JA, Martinez AL. Reliability of a protocol for testing endurance performance in runners and cyclists. Res Q Exerc Sport 1998; 69: 304-7 20. Widrick JJ, Costill DL, Fink WJ, et al. Carbohydrate feedings and exercise performance: effect of initial muscle glycogen concentration. J Appl Physiol 1993; 74: 2998-3005 21. Williams JH, Barnes WS, Signorile JF. A constant-load ergometer for measuring peak power output and fatigue. J Appl Physiol 1988; 65: 2343-8 22. Cheetham ME, Williams C, Lakomy HKA. A laboratory running test: metabolic responses of sprint and endurance trained athletes. Br J Sports Med 1985; 19: 81-4 23. Withers RT, Van Der Ploeg G, Finn JP. Oxygen deficits incurred during 45, 60, 75 and 90-s maximal cycling on an air-braked ergometer. Eur J Appl Physiol 1993; 67: 185-91 24. Patton JF, Murphy MM, Frederick FA. Maximal power outputs during the Wingate anaerobic test. Int J Sports Med 1985; 6: 82-5 25. Nicklin RC, O’Bryant HS, Zehnbauer TM, et al. A computerized method for assessing anaerobic power and work capacity using maximal cycle ergometry. J Appl Sports Sci Res 1990; 4: 135-40 26. Coggan AR, Costill DL. Biological and technological variability of three anaerobic ergometer tests. Int J Sports Med 1984; 5: 142-5 27. Simoneau JA, Lortie G, Boulay MR, et al. Tests of anaerobic alactacid and lactacid capacities: description and reliability. Can J Appl Sports Sci 1983; 8: 266-70 28. Weinstein Y, Bediz C, Dotan R, et al. Reliability of peak-lactate, heart rate, and plasma volume following the Wingate test. Med Sci Sports Exerc 1998; 30: 1456-60 29. Evans JA, Quinney HA. Determination of resistance settings for anaerobic power testing. Can J Appl Sports Sci 1981; 6: 53-6 30. Bosco C, Luhtanen P, Komi PV. A simple method for measurement of mechanical power in jumping. Eur J Appl Physiol 1983; 50: 273-82 31. Macfarlane DJ, Edmond IM, Walmsley A. Instrumentation of an ergometer to monitor the reliability of rowing performance. J Sports Sci 1997; 15: 167-73 32. Bishop D. Reliability of a 1-h endurance performance test in trained female cyclists. Med Sci Sports Exerc 1997; 29: 554-9 33. Schabort EJ, Hopkins WG, Hawley JA. Reproducibility of selfpaced treadmill performance of trained endurance runners. Int J Sports Med 1998; 19: 48-51 34. Wiklander J, Lysholm J. Simple tests for surveying muscle strength and muscle stiffness in sportsmen. Int J Sports Med 1987; 8: 50-4
Sports Medicine 2001; 31 (3)
Reliability of Power in Physical Performance Tests
35. Viitasalo JT. Evaluation of explosive strength for young and adult athletes. Res Q Exerc Sport 1988; 59: 9-13 36. Ashley CD, Weiss LW. Vertical jump performance and selected physiological characteristics of women. J Strength Cond Res 1994; 8: 5-11 37. Harman EA, Rosenstein MT, Frykman PN, et al. The effects of arms and countermovement on vertical jumping. Med Sci Sports Exerc 1990; 22: 825-33 38. Young W, Macdonald C, Heggen T, et al. An evaluation of the specificity, validity and reliability of jumping tests. J Sports Med Phys Fitness 1997; 37: 240-5 39. Bosco C, Belli A, Astrua M, et al. A dynamometer for evaluation of dynamic muscle work. Eur J Appl Physiol 1995; 70: 379-86 40. Avis FJ, Hoving A, Toussaint HM. A dynamometer for the measurement of force, velocity, work and power during an explosive leg extension. Eur J Appl Physiol 1985; 54: 210-5 41. Bosco C, Cardinale M, Tsarpela O. Influence of vibration on mechanical power and electromyogram activity in human arm flexors muscles. Eur J Appl Physiol 1999; 79: 306-11 42. Bassey EJ, Short AH. A new method for measuring power output in a single leg extension: feasibility, reliability and validity. Eur J Appl Physiol 1990; 60: 385-90 43. Pincivero DM, Lephart SM, Karunakara RG. Effects of intrasession rest interval on strength recovery and reliability during high intensity exercise. J Strength Cond Res 1998; 12: 152-6 44. Montgomery LC, Douglass LW, Deuster PA. Reliability of an isokinetic test of muscle strength and endurance. J Orthop Sports Phys Ther 1989; 10: 315-22 45. Gleeson NP, Mercer TH. Reproducibility of isokinetic leg strength and endurance characteristics of adult men and women. Eur J Appl Physiol 1992; 65: 221-8 46. Kannus P. Normality, variability and predictability of work, power and torque acceleration energy with respect to peak torque in isokinetic muscle testing. Int J Sports Med 1992; 13: 249-56 47. Bandy WD, McLaughlin S. Intramachine and intermachine reliability for selected dynamic muscle performance tests. J Orthop Sports Phys Ther 1993; 18: 609-13 48. Brown LE, Whitehurst M, Bryant JR. Reliability of the LIDO active isokinetic dynamometer concentric mode. Isokinet Exerc Sci 1992; 2: 191-4 49. Brown LE, Whitehurst M, Bryant JR, et al. Reliability of the Biodex system 2 isokinetic dynamometer concentric mode. Isokinet Exerc Sci 1993; 3: 160-3 50. Molczyk L, Thigpen LK, Eickhoff J, et al. Reliability of testing the knee extensors and flexors in healthy adult women using a Cybex II isokinetic dynamometer. J Orthop Sports Phys Ther 1991; 14: 37-41 51. Pincivero DM, Lephart SM, Karunakara RA. Reliability and precision of isokinetic strength and muscular endurance for the quadriceps and hamstrings. Int J Sports Med 1997; 18 (2): 113-7 52. Madsen OR. Torque, total work, power, torque acceleration energy and acceleration time assessed on a dynamometer: reliability of knee and elbow extensor and flexor strength measurements. Eur J Appl Physiol 1996; 74: 206-10 53. Li RCT, Wu Y, Maffulli N, et al. Eccentric and concentric isokinetic knee flexion and extension: a reliability study using the Cybex 6000 dynamometer. Br J Sports Med 1996; 30: 156-60 54. Tredinnick TJ, Duncan PW. Reliability of measurements of concentric and eccentric isokinetic loading. Phys Ther 1988; 68: 656-9
Adis International Limited. All rights reserved.
233
55. Weiss LW, Relyea GE, Ashley CD, et al. Reliability of selected measures of musculoskeletal function obtained during closed kinetic chain exercises at multiple velocities. J Strength Cond Res 1996; 10: 45-50 56. Weiss LW, Fry AC, Gossick EL, et al. Reliability of bench press velocity-spectrum testing. Meas Phys Educ Exerc Sci 1998; 2: 243-52 57. Kovaleski JE, Heitman RJ, Gurchiek LR, et al. Reliability and effects of leg dominance on lower extremity isokinetic force and work using the Closed Chain Rider System. J Sport Rehabil 1997; 6: 319-26 58. Davies GJ, Heiderscheit BC. Reliability of the lido linea closed kinetic chain isokinetic dynamometer. J Orthop Sports Phys Ther 1997; 25: 133-6 59. Kovaleski JE, Ingersoll CD, Knight KL, et al. Reliability of the BTE Dynatrac isotonic dynamometer. Isokinet Exerc Sci 1996; 6: 41-3 60. Emery CA, Maitland ME, Meeuwisse WH. Test-retest reliability of isokinetic hip adductor and flexor muscle strength. Clin J Sports Med 1999; 9: 79-85 61. Graham KS, McLellan TM. Variability of time to exhaustion and oxygen deficit in supramaximal exercise. Aust J Sci Med Sport 1989; 24 (4): 11-4 62. Billat V, Renoux JC, Pinoteau. J, et al. Reproducibility of running time to exhaustion at V O2max in subelite runners. Med Sci Sports Exerc 1994; 26: 254-7 63. McLellan TM, Cheung SS, Jacobs I. Variability of time to exhaustion during submaximal exercise. Can J Appl Physiol 1995; 20: 39-51 64. Caine MP, McConnell AK. The reproducibility of cycling to volitional fatigue in non-cyclists [abstract]. J Physiol 1995; 489: 36 65. Coyle EF, Coggan AR, Hemmert MK, et al. Muscle glycogen utilization during prolonged strenuous exercise when fed carbohydrate. J Appl Physiol 1986; 61: 162-72 66. Hill DW. The critical power concept: a review. Sports Med 1993; 16: 237-54 67. Green S, Dawson BT, Goodman C, et al. Y-intercept of the maximal work-duration relationship and anaerobic capacity in cyclists. Eur J Appl Physiol 1994; 69: 550-6 68. Gaesser GA, Wilson LA. Effects of continuous and interval training on the parameters of the power-endurance time relationship for high-intensity exercise. Int J Sports Med 1988; 9: 417-21 69. Kolbe T, Dennis SC, Selley E, et al. The relationship between critical power and running performance. J Sports Sci 1995; 13: 265-9 70. Bishop D, Jenkins DG. The influence of recovery duration between periods of exercise on the critical power function. Eur J Appl Physiol 1995; 72: 115-20 71. Nebelsick-Gullett LJ, Housh TJ, Johnson GO, et al. A comparison between methods of measuring anaerobic work capacity. Ergonomics 1988; 31: 1413-9 72. Smith JC, Hill DW. Stability of parameter estimates derived from the power/time relationship. Can J Appl Physiol 1993; 18: 43-7 73. Bulbulian R, Jeong JW, Murphy M. Comparison of anaerobic components of the Wingate and critical power tests in males and females. Med Sci Sports Exerc 1996; 28: 1336-41 74. Pfitzinger P, Freedson PS. The reliability of lactate measurements during exercise. Int J Sports Med 1998; 19: 349-57 75. Zhou S, Weston SB. Reliability of using the D-max method to define physiological responses to incremental exercise testing. Physiol Meas 1997; 18: 145-54
Sports Medicine 2001; 31 (3)
234
76. Weltman A, Snead D, Stein P, et al. Reliability and validity of a continuous incremental treadmill protocol for the determination of lactate threshold, fixed blood lactate concentration, . and V O2max. Int J Sports Med 1990; 11: 26-32 77. Nummela A, Alberts M, Rijntjes RP, et al. Reliability and validity of the maximal anaerobic running test. Int J Sports Med 1996; 17 Suppl. 2: S97-S102 78. McLellan TM, Jacobs I. Reliability, reproducibility and validity of the individual anaerobic threshold. Eur J Appl Physiol 1993; 67: 125-31 79. Dickhuth HH, Yin L, Niess A, et al. Ventilatory, lactate-derived and catecholamine thresholds during incremental treadmill running: relationship and reproducibility. Int J Sports Med 1999; 20: 122-7 80. Cheng B, Kuipers H, Snyder AC, et al. A new approach for the determination of ventilatory and lactate thresholds. Int J Sports Med 1992; 13: 518-22 81. Meyer K, Hajric R, Westbrook S, et al. Ventilatory and lactate threshold determinations in healthy normals and cardiac patients: methodological problems. Eur J Appl Physiol 1996; 72: 387-93 82. Caiozzo VJ, Davis JA, Ellis JF, et al. A comparison of gas exchange indices used to detect the anaerobic threshold. J Appl Physiol 1982; 53: 1184-9 83. Davis JA, Vodak P, Wilmore JH, et al. Anaerobic threshold and maximal aerobic power for three modes of exercise. J Appl Physiol 1976; 41: 544-50 84. Balmer J, Davison RCR, Bird SR. Peak power predicts performance power during an outdoor 16.1-km cycling time trial. Med Sci Sports Exerc 2000; 32: 1485-90 85. Kohrt WM, Morgan DW, Bates B, et al. Physiological responses of triathletes to maximal swimming, cycling, and running. Med Sci Sports Exerc 1987; 19: 51-5 86. Balmer J, Davison RCR, Bird SR. The reliability of an airbraked cycle ergometer to record peak power output during a maximal cycling performance test. Med Sci Sports Exerc 2000; 32: 1790-3 87. Rivera-Brown AM, Rivera MA, Frontera WR. Reliability of . V O2max in adolescent runners: a comparison between plateau achievers and nonachievers. Pediatr Exerc Sci 1995; 7: 203-10 88. Ekblom B. Effect of physical training on oxygen transport system in man. Acta Physiol Scand 1969; S328: 1-45 89. Wisløff U, Helgerud J. Evaluation of a new upper body ergometer for cross-country skiers. Med Sci Sports Exerc 1998; 30: 1314-20 90. McArdle WD, Katch FI, Pechar GS. Comparison of continuous . and discontinuous treadmill and bicycle tests for max V O2. Med Sci Sports Exerc 1973; 5: 156-60 91. Le Chevalier JM, Vandewalle H, Vallier JM, et al. Peak power and pulmonary oxygen uptake during knee extension exercise: comparisons among different incremental protocols. Eur J Appl Physiol 1998; 78: 441-7 92. Leger L, Boucher R. An indirect continuous running multistage field test: the Université de Montréal track test. Can J Appl Sports Sci 1980; 5: 77-84 93. Magel JR, Faulkner JA. Maximum oxygen uptakes of college swimmers. J Appl Physiol 1967; 22: 929-38 94. Leger LA, Lambert J. A maximal multistage 20-m shuttle run . test to predict V O2max. Eur J Appl Physiol 1982; 49: 1-12 95. Kimura Y, Yeater RA, Martin. RB. Simulated swimming: a useful tool for evaluating the V O2peak of swimmers in the laboratory. Br J Sports Med 1990; 24: 201-6
Adis International Limited. All rights reserved.
Hopkins et al.
96. McArdle WD, Katch FI, Pechar GS, et al. Reliability and interrelationships between maximal oxygen intake, physical work capacity and step-test scores in college women. Med Sci Sports Exerc 1972; 4: 182-6 97. Sproule J, Kunalan C, McNeill M, et al. Validity of 20-MST for . predicting V O2max of adult Singaporean athletes. Br J Sports Med 1993; 27: 202-4 98. Swaine IL, Zanker CL. The reproducibility of cardiopulmonary responses to exercise using a swim bench. Int J Sports Med 1996; 17: 140-4 99. Skinner JS, Wilmore KM, Jaskolska A, et al. Reproducibility of maximal exercise test data in the HERITAGE Family study. Med Sci Sports Exerc 1999; 31: 1623-8 100. Kyle SB, Smoak BL, Douglass LW, et al. Variability of responses across training levels to maximal treadmill exercise. J Appl Physiol 1989; 67: 160-5 101. Katch VL, Sady SS, Freedson P. Biological variability in maximum aerobic power. Med Sci Sports Exerc 1982; 14: 21-5 102. Kuipers H, Verstappen FTJ, Keizer HA, et al. Variability of aerobic performance in the laboratory and its physiologic correlates. Int J Sports Med 1985; 6: 197-201 103. Andersen LB. A maximal cycle exercise protocol to predict maximal oxygen uptake. Scand J Med Sci Sports 1995; 5: 143-6 104. Obert P, Falgairette G, Bedu M, et al. Bioenergetic characteristics of swimmers determined during an arm-ergometer test and during swimming. Int J Sports Med 1992; 13: 298-303 105. Peronnet F, Thibault G, Rhodes ED, et al. Correlation between ventilatory threshold and endurance capability in marathon runners. Med Sci Sports Exerc 1987; 19: 610-5 106. Jones AM, Doust JH. Lack of reliability in Conconi’s heart-rate deflection point. Int J Sports Med 1995; 16: 541-4 107. Hawley JA, Noakes TD. Peak power output predicts maximal oxygen uptake and performance time in trained cyclists. Eur J Appl Physiol 1992; 65: 79-83 108. Thomas JR, French KE. The use of meta-analysis in exercise and sport: a tutorial. Res Q Exerc Sport 1986; 57: 196-204 109. Hopkins WG. Reliability of competitive performance of elite track and field athletes [abstract]. J Sci Med Sport 1999; 4: 442 110. Concept 2 Inc. Nitty gritty technicals. Concept 2 [online]. Available from: URL: http://www.concept2.com/indrower/nitgrit.html [Accessed 2001 Jan 4] 111. Cumming GR, Alexander WD. The calibration of bicycle ergometers. Can J Appl Physiol Pharmacol 1968; 46: 917-9 112. Clark JH, Greenleaf JE. Electronic bicycle ergometer: a simple calibration procedure. J Appl Physiol 1971; 30: 440-2 113. Wilmore JH, Constable SH, Stanforth PR, et al. Mechanical and physiological calibration of four cycle ergometers. Med Sci Sports Exerc 1982; 14: 322-5 114. Martin JC, Diedrich D, Coyle EF. Time course of learning to produce maximum cycling power. Int J Sports Med 2000; 21: 485-7
Correspondence and offprints: Will G. Hopkins, Department of Physiology, School of Medical Science, University of Otago, Box 913, Dunedin, New Zealand. E-mail:
[email protected]
Sports Medicine 2001; 31 (3)