CLARA SOPER and PATRIA A. HUME. ABSTRACT. Coaches, sport scientists and researchers assess rowing performance on-water and on a variety of ...
Reliability of Power Output During Rowing Changes with Ergometer Type and Race Distance CLARA SOPER and PATRIA A. HUME
ABSTRACT Coaches, sport scientists and researchers assess rowing performance on-water and on a variety of ergometers. Ergometers are frequently used because of the easier assessment environment. However, there is limited information on the ability of rowers to reproduce mean power or time-trial time when using different rowing ergometers (Concept II and RowPerfect) or completing tests over different distances (500m versus 2000m races). To test the efficacy of an interx'ention on a rower's ability to produce power, or to monitor that ability, it is essential to determine a reliable rowing performance test. The per cent standard error of measurement in performance (assessed by mean power and time-trial time) of fifteen national standard rowers was determined for five repeated 500 m and two repeated 2000 ni races on a Concept II and RowPerfect ergometer. The per cent standard error of measurement (% SEM) in mean power between 5x500m races, regardless of gender, was 2.8% (95% confidence limits (CL)=2.3 to 3.4%) for the Concept II ergometer and 3.3% (95% CL=2.5 to 3.9%) for the RowPerfect ergometer (n - 15). Over 2000 m the per cent standard error of measurement in mean power was 1.3% (95% CL 0.9 to 2.9%) for the Concept II ergometer and 3.3% (95% CL 2.2 to 7.0%) for the RowPerfect ergometer. The results highlight an increase in per cent standard error of the mean during performance races of less than 2000 m on the Concept II ergometer, and performance races on the RowPerfect ergometer compared with the Concept II ergometer over 500 m and 2000 m. The most appropriate protocol for testing the influence of an intervention on the ability of a rower to produce power would be 2000 ni races on a Concept II ergometer. Keywords: Concept II, performance, reliability, rowing, RowPerfect. INTRODUCTION At international standard, sculling (two oars) and rowing (one oar) races are competed on-water over 2000 m. Race time is the critical measure of performance and is determined from mean boat speed during a race. Although a high New Zealand Institute of Sporl and Recreation Research, Auckland University of Technology, New Zealand Sports Biomechanics Vol.3 (2) 237-247
238
CLARA SOPER and PATRIA A. HUME
B
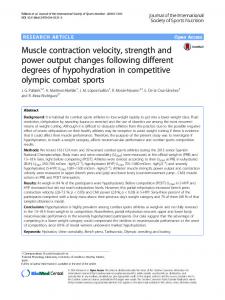
Foot-plate & seat move forward and backwards
The rower slides backward on the seat during the drive phase 1
The rowers' feet slide forward and the seat slides backward aiong the support bar during the drive phase
Figure 1 Schematic diagram illustrating the stationary foot-plate on the Concept II ergometer (A) and moving foot-plate on the RowPerfect ergometer (B) between the catch and finish phases of the stroke cycle.
proportion of race training is completed on-water. rowing ergometers are commonly used for performance testing, technique coaching, crew selection, or for training during poor weather. The Concept II ergometer (Figure la) is arguably the most frequently used air-braked ergometer. The widespread use is evident by the inception of the Concept II Indoor Rowing Olympics in 1980 (CRASH-B. Sprints World Indoor Rowing Championships, 2004). Rowing performance on a Concept II ergometer has been reported as being repeatable when testing trained rowers over 2000 m (Schabort ef al.. 1999). The per cent standard error of the mean (%SEM) for mean power was reported as being 2.0% (95% confidence limits (CL) = 1.3 to 3.1%) when eight trained rowers completed three 2000 m time trials separated by 3 days each. The retest correlation coefficient was 0.96 (95% CL = 0.87 to 0.99). A 2.0% change in mean power equates to a 0.7% change in speed using the formulae provided by Hopkins and colleagues (2001). Therefore, a change in mean power of 2.0% for a world class male single sculler with a mean speed of 5 Om.s ' will result in an equivalent change in performance time of 2.7 s over 2000 m. For a lower mean speed of 3.5 m.s' and a change in mean power of 2.0%, a 4.0 s change in total time will he seen. The high reliability is probably due to the Concept II ergometer being inherently stable and to rowers being accustomed to completing 2000 m time trials on this ergometer (Schabort et al., 1999). A moderate positive correlation in performance time (r = 0.74) between 2000 m races on a Concept 11 ergometer and standing-start on-water (Ryan-Tanner et al., 1999) has been reported. However, Martindale and Robertson (1984) revealed significant
RELIABILITY OF ROWING PERFORMANCE
239
differences in segment energies between on-water and Concept II ergometer rowing. A good comparison of the kinematics and kinetics of Concept II ergometer and on-water rowing has not been completed to the authors' knowledge. Although distinctly different from the Concept II ergometer, the RowPerfect ergometer (Figure lb) is also used by many rowers during land training sessions. The foot-stretcher and flywheel of the RowPertect ergometer freely moves along a rail to match more closely the inertial forces exerted on a rower while on-water (Rekers, 1993). Elliot et al. (2002) reported a similar profile of force output and joint kinematics during on-water rowing and rowing on a RowPerfect ergometer. With the exception of knee angle at the catch, no significant differences between rowing on-water and on a RowPerfect ergometer were reported. An earlier study by Buck et al. (20(X)) reported that peak horizontal handle force, time to peak handle force, and time to peak horizontal foot-stretcher force were not significantly different between the RowPerfect and Concept II ergometers. However, peak horizontal foot-stretcher force was significantly greater on the RowPerfect ergometer. Although the RowPerfect ergometer is purported to be a more valid ergometer for rowing {Rekers, 1993), no published research has reported the %SEM in performance, kinetic or kinematics variables during repeated trials. Quantifying normal variation, signified by the %SEM, between repeated sculling or rowing trials is essential for monitoring performance and understanding the effect of an intervention. To conclude that an intervention has had a real effect on performance, the change due to the intervention must be greater than the change that would normally be expected with repeated trials under the same conditions. Examination of repeated trials under the same condition provides the reliability or the reproducibility of the performance tests. A reliable test is one that has small changes in the mean, a low %SEM and a high test-retest correlation between repeated trials (Schabort el at., 1999; Hopkins et ai, 2001). High reliability is commonly reported when the %SEM is less than 2% (Schabort et aL 1999; Hopkins etal.. 2001). The evaluation of rowing performance during a field test is usually quantified from time, distance or speed measures because data are most conveniently collected using these measures. Power output is usually the key performance measure for ergometer tests. To test the efficacy of an intervention on a rower's ability to produce power, or to monitor that ability, it is essential to determine a reliable rowing performance test. A meta-analysis of studies measuring power in physical performance tests such as cycling, revealed that the coefficient of variation between the first two trials was 1.3 times (95% CL = 1.1 to 1.6) larger than between any subsequent trials (Hopkin.s et al.. 2001). Repeated 2000 m rowing tests within one training session may not be appropriate because the cumulative fatigue can affect performance (Peltonen and Rusko, 1993; Smith and Milbum, 1996). To our knowledge, the reliability of ergometer rowing trials of repeated short duration and maximal effort has not yet been addressed. The reproducibility of short duration (0.55 ± 0.11 min) laboratory cycling trials was reported as being significantly less reliable than trials tasting 12.0 ± 0.2 min and 105.1 ±0.4 min (Hickey et al., 1992). The %SEM for cycling performance time was 2.4% for
240
CLARA SOPER and PATRIA A, HUME
the short duration trials compared with 1.0% for medium and long duration trials. It is currently unclear why shorter time or distance performance trials are less reliable than relatively longer ones. Participant familiarity with the testing distance may be one reason for increased reliability. Alternatively, shorter tests may not need a pacing strategy to be used, which could lead to increased reliability owing to the 'all-out' nature of the tests. Further research is required to determine why reliability changes with test duration. On the basis of research by Hickey et al. (1992), it is reasonable that the %SFM of ergometer rowing performance trials of short duration (500 m) may be greater than standard 2000 m (-7.0 min) races. To improve rowing performance through effective intervention, it is first essential to quantify the reliability of ergometer measures. The present study determined the expected normal variation in mean power and time-trial time when national calibre rowers repeated five 500 m and two 2000 m trials on a Concept II ergometer and RowPerfect ergometer. METHODS Ergometer testing was completed 6 weeks before the rowers competing internationally. All rowers were informed of testing requirements and each gave their written informed consent as required by the Auckland University of Technology Ethics Committee. Participants Eight male and seven female Rowing New Zealand (RNZ) national rowers {n= 15) participated in the study; the characteristics of the rowers are outlined in Table 1. Each rower had been identified as a potential elite rower by the RNZ national development coach. In addition to land-based conditioning, all rowers regularly trained on the Concept 11 and RowPerfect ergometers; however, inhouse monitoring tests were performed solely on the Concept II ergometer. Table 1 Rowers' characteristics mean ± standard deviation. Sex
Standard of Age rower (years)
Males: n = 8 National Females: n - 7 All: n=15
Body mass (kg)
Height (m)
19.1±0. 6 85,0±8.4 1.88 + 0..07 18.6+1. 0 73,4±12.7 1.74 + 0.07 18.9±0, 9 79.3±12.1 1 .82 ±0..10
Competitive Weekly rowing training experience (hr/week) (years) 5,3 + 2.0 4,4 + 0.7 4.8+1.5
24.5 + 0.9 20.5±3,5 22.5±3.2
Procedures All 15 rowers completed two 500 m races on the Concept II ergometer and two 500 m races and RowPerfect ergometer the day before data collection to ensure they were familiar with the shorter distance race. On day one of data collection.
RELIABILITY OF ROWING PERFORMANCE
241
each rower completed five 500 m races on either the Concept H or the RowPertect ergometer. On day two the rower used the other ergometer. Ergometer order was randomly allocated across days and balanced between gender groups. After a rest day, each rower completed a 2000 m race on three consecutive days using either the Concept II ergometer (4 males, 3 females) or the RowPerfect ergometer (4 males, 4 females). Although administered as a true race, the first 2000m race was considered to be test familiarisation. Data from the 2000 m familiarisation race were not included in the data analyses. All 500 m and 2000 m races were completed at the same time of day and with a minimum of 20min rest between each 500 m trial. The Concept HI and RowPerfect ergometers were positioned next to each other, far enough apail to prohibit interference between their air braking mechanisms (Schabort et al., 1999: RowPerfect, 2004). Individual rowers were paired to match performance ability by their coach. Using the Concept II and RowPerfect ergometers. the rowers in each pair raced against one another during the five 500 m and two 2000 m races. The authors believed maxima! effort by the rowers was most likely to be achieved in the competitive race environment. One female rower did not complete trials under 'race' conditions owing to an odd number of female rowers volunteering to participate in the study. Her data were included in the analysis as maxima! effort trials were completed and her 500 m and 2000 m race times were on average within 1% of the mean female rowers race times. The rowers were instructed to travel 500 m and 2000 m in the shortest possible time. The display panel on the Concept 11 ergometer and the computer attached to the RowPerfect ergometer were positioned so that the rowers could not view elapsed time. The rowers were not informed of their overall times for each 500 m and 2000 m race until completion of their final race on day seven. Stroke rate and remaining distance were continually fed back verbally to the rowers by the crews' coxswain during all races. Additionally, the coxswain, fellow crew members and the coach provided the same strong verbal motivation to the rowers during each race. Stroke-by-stroke power output was recorded by video from the display panel on the Concept 11 ergometer and saved to file on the computer connected to the RowPerfect ergometer. The time-trial time and mean power output for each ergometer race was calculated. Statistical analysis Descriptive statistics for all variables (Tables 1—4) are represented as mean and standard deviations (spread of results among participants). There were lost data due to malfunction of the RowPerfect ergometer during the repeated 500 m races. Seventeen of a possible seventy-five (23%) race outputs from the RowPerfect ergometer were not recorded correctly. Of a possible 15 rowers, data were recorded from a maximum of five 500 m races for six rowers, four races for five rowers, three races for one rower and two races for three rowers. There were no missing data for repeated 500 m races on the Concept II ergometer or any 2000 m races. Measures of reliability (change in mean, %SEM and intraclass correlation coefficients) were determined using a repeated-measures
242
CLARA SOPER and PATRIA A. HUME
analysis of variance in Statistical Analysis Systems. The recorded values for 500 m time-trial time for two races were considered to be outliers as they were greater than four standard deviations from the mean. Visual inspection of the plot of residuals against the predicted values for 'total race time' supported this criterion. Data were log-trans formed for mean power output to provide measures of reliability as %SEM and intraclass correlation coefficients (ICC) were calculated. The likely ranges of the true values are provided by 95% confidence limits (CL). RESULTS There were small changes in the mean overall time and mean power output on the Concept II and RowPerfect ergometers over 500 m and 2000 m distances (see Table 2). The %SEM for mean power on the Concept II ergometer was less than that for the RowPerfect ergometer regardless of race length. On the Concept II ergometer the %SEM for mean power and time-trial time were smaller between repeated 2000 m than during repeated 500 m trials. The smallest %SEM on the RowPerfect ergometer was recorded during the 500 m trials for mean power and the 2000 m trials for time-trial time (see Figure 2). The test-retest intraclass correlation coefficients were all greater than 0.88 (95% CL = 0.53 to 0.96%). Table 2 Mean power and mean overall time (± one standard deviation) during 500 m and 2000 m ergometer races with the corresponding expected change in mean between repeated trials, per cent standard errors of the mean (%SEMs) and intraclass correlation coefficients (ICCs). Ranges shown in parentheses. Concept II
500 m Mean Change in mean %SEM ICC
2000 m Mean Changes in mean %SEM ICC
RowPerfect
Overall Time (min.s)
Power Output (W)
Overall Time Power (min.s) Output (W)
1:34±0:01
418.1 ±7,4
1:43 ±0:01
474.0 ± 11,4
-0.2% (-2.0-1.6) 1.0% (0.8-1.1) 0.93 (0.80-0.98)
0.8% (-1,0-2.7) 2.8% (2.3-3.4) 0.99 (0.99-1.0)
-0.8% (-4,0-2,5) 1,6% (1,3-2.0) 0.88 (0.53-0,96)
-0,5% (-3.4-2,5) 3,0% (2,5-3.9) 0,98 (0,96-1,0)
6:58 ±0:05
312.4±0.5
7:38 ±0:07
360,4 ±7.4
0.03% (-0.6-1.2) 0.7% (0.4-1.5) 0.99 (0.95-1.0)
0,02% (-1.9-1.5) 1.3% (0.8-2.9) 0.99 (0.98-1.0)
0,3% (-0,3-0.9) 0,5% (0.3-1.1) 0,99 (0.97-1,0)
-1,9% (-5,6-2.0) 3,3% (2,2-7.0) 0,98 (0.91-0.10)
RELIABILITY OF ROWING PERFORMANCE
o
243
A
7-
i ^^ a. 5 c
1 4LU CO ,o d^
T i
3
i
o CL -
10 500 m
2000 m
500 m
Concept 1
3.0-
2000 m
^owPertect
B
% SEN1 total time 1
2.5^ 2.01.51.0-
t
0.50.0 500 m
2000 m Concept II
500 m
2000 m
RowPerfect
Figure 2 Percent SEM for A) mean power output (± 95% CL) and B) time-trial time (±95%CL) for 500 m { n - 1 5 ) and 2000 m (n = 7) races on the Concept II ergometer and 500 m (n = 15) 2000 m (n = 8} races on the RowPerfect ergometer.
The female rowers produced smaller %SEMs for mean power output and time-trial time between repeated 500 m races than the male rowers (see Table 3). Figure 3 shows the mean power output for each 500 m quarter of the 2000 m races on the Concept II and RowPerfect ergometers. Corresponding %SEM data for each quarter are provided in Table 4. As expected the mean power output was highest during the initial 500 m of the 2000 m ergometer races. Mean power output was more consistent during the middle 1000 m before the rowers increased mean power in the final 500 m. Corresponding to this familiar race strategy, the %SEM was greatest during the first and last 500 m intervals and smallest during the middle 1000m.
CLARA SOPER and PATRIA A. HUME
244
Table 3 Per cent standard error of the mean (SEM) for mean power and mean overall 500 m time for males and females on the Concept II and RowPerfect ergometers. Ranges shown in parentheses.
Per cent Sf M for: Power Output (W)
Overall Time (min:s)
Males (n=8)
Females
(n = 7)
(n-7)
Males (n = 8)
0.7% (0.6-1.0) 1.4% (1.1-2.1)
1.0% (0.8-1.4) 1.7% (1.3-2.8)
2.4% (1.8-3,4) 2.9% (2.2-4.2)
3,1% ( 2 , 5 - 4 . 2) 3.3% ( 2 . 4 - 4 . 9)
Females
Concept II RowPerfect
Per cent standard error of measurement (95% confidence limits)
Table 4 Per cent standard error of the mean (SEM) of successive 500 m intervals during the 2000 m ergometer trial on a Concept II ergometer. Per cent for: 2nd Ouarter 500-woo m
3rd Ouarter
4thOuarter
0-500m
-1500 m
1500-2000m
8,6 ( 6 . 9 - 1 .5)
20 (1.5-3.3)
1,9 (1,4-3,5)
Isf Quarter
Power Output (W) Concept II
6,2 (4,6-8,6)
Per cent standard error of measurement (95% confidence limits (CL), For any trial using the RowPerfect ergometer the %SEM increases compared with the Concept II ergometer by 2.0% (95% CL = 1.1 to 7,5).
450 1
viean power (Vu
400 350
—-m^
^
^
300 250 200()
500 m
1000 m
1500 m
2000 m
Distance (m)
Figure 3 Mean power output for 500 m intervals of the 2000 m races on the Concept II (- - A - -) (n = 7) and RowPerfect ( — • — ) (n - 8) ergometers.
RELIABILITY OF ROWING PERFORMANCE
245
When the rowers were ranked from best to worst pertbrmance based on mean power output and overall time during the 500 m and 2000 m races, the order was the same regardless of trial length. This was indicated by the high intraclass correlation coefficients between 500 m and 2000 m races on the Concept II (power = 0.99, 95% CL = 0.9 to 1.0%; time = 0.98, 95% CL = 0.89 to 1.0%) and RowPerfect (power = 0.98. 95% CL = 0.87 to 1.0%'; time = 0.93, 95% CL = 0.63 to 0.99%) ergometers. DISCUSSION AND IMPLICATIONS Knowing the reliability of a test is essential for the investigation of rowing performance, irrespective of whether an on-water or ergometer-based research project is intended. A performance test is valuable when reliability is high enough to allow researchers to use realistic sample sizes but still detect small differences in performances that are beneficial to elite athletes (Schabort et al., 1999). This research primarily focused on the effect of ergometer and trial duration on test reliability, however consideration was given to the influences of the sex of the rowers, race stage and race number. Petformance reliability on different ergometers The reliability of power output is dependent on the relationship between the ergometer and athlete relationship and not solely on one or the other. Rowers were able to reproduce mean power output during the 500 m and 2000 m maximal effort performance trials with a smaller %SEM on the Concept II ergometer than on the RowPertect ergometer. The high test-retest reliability of the Concept II ergometer is most probably due to its inherent stability and participant test familiarity as suggested by Schabort et al. (1999). The larger %SEMs recorded on the RowPerfect ergometer compared to the Concept II ergometer during the 500 m and 2000 m races may be due to the lower mean speed during the races or the increased dynamical movement pattern required. The greater dynamics of the RowPerfect ergometer come from the absence of a fixed base at the foot-stretcher that transfers an equal and opposite force back to the rower during the drive phase of the stroke cycle - as found on the Concept II ergometer. This primary difference between the two ergometers leads to greater coordination and technical proficiency requirements during RowPeifect ergometer use. An ergometer that requires higher skill may result in greater changes in performance repeatability and, as such, the higher %SEM (lower reliability) reported in this research. Alternatively, experienced competitive rowers, as used in this research, should be more familiar with the movement patterns on the RowPertect ergometer than on any other ergometer owing to the reported similarities in inertial properties (Rekers, 1993) and force-time development (Elliott et al., 2002) between the RowPerfect ergometer and on-water rowing, A three-way comparison of technical proficiency requirements and repeatability of rowers" power output perfonnance on the Concept II ergometer. the RowPertect ergometer and on-water rowing is required before the most reliable and valid ergometer test can be recommended.
246
CLARA SOPER and PATRIA A. HUME
Performance reliability over 500 m and 2000 m distances No clear conclusions about the effect of trial length on mean power reliability could be drawn for the RowPerfect ergometer, given the similar %SEM for mean power and the overlap of the confidence limits. The opposite was evident on the Concept H ergometer, with the 2000 m races being clearly more reliable than the 500 m races for mean power output. The rowers results on the Concept II ergometer support earlier research by Hickey (1992). who found cycling trials lasting approximately one minute to be significantly less reliable than 12minand 105 min trials. However, Schabort er a/. (1999) suggested that power output during a 2000 m (~7min) rowing ergometer test was more reliable than a 60 min cycling test owing to its shorter duration. There may be an optimal trial duration for test-retest reliability with reduced reliability during very short or very long tests. It seems likely that optimal performance reliability would be achieved using a protocol that matches the duration of normal competitive races in a particular sports event. Mean power output and time-trial time in the 5(M)m races tracked mean power output and time-trial time in the 2000 m races closely, as illustrated by the high test-retest intraclass correlation coefficients (0.88-0.99; 95*}^CL = 0.53 to 1.0). The lower (0.88; 95% CL = O,53 to 0.96) intraclass correlation coefficients for 500 m races on the RowPerfect ergometer may be directly attributable to the ergometer's higher test-retest variation. Additionally, the loss of data through the malfunction of the RowPerfect ergometer might also have been a contributing factor in the higher test-retest variation. Kramer et at. (1994) reported a within-day correlation coefficient of-0.55 when the relationship between time taken to row 2500m and the distance rowed in 90s was assessed for 20 rowers with an average of two years experience. The smaller correlation reported by Kramer may be attributable to the rowers used being less experienced or to the trials not being completed under maximal effort conditions. Performance reliability of male and female rowers When comparing the reliability of the male and female rowers independently, no clear conclusions can be made about performance repeatability because of the overlap of the %SEM's 95% confidence limits. The small sample of eight males and seven females may have attributed to the large confidence limits and inability to identify clear differences (Morrow and Jackson, 1993). The greater competitive rowing experience and greater weekly training loads of the male rowers did not appear to influence the performance reliability compared to the female rowers. The limited number of male and female rowers tested on the Concept II (three females, four males) and RowPerfect (four females, four males) ergometers over 2000 m prohibited the analysis of between-sex effects for this race distance. Performance reliability at stages during a 2000 m race During technique analysis of 2000 m rowing performance, a sample of strokes
RELIABILITY OF ROWING PERFORMANCE
247
{~5 to 20) (Lamb. 1989; Dawson et al., 1998: Halliday et al., 2001) are commonly analysed as opposed to all strokes (-220). Knowing which quarter has the least variability will allow coaches and researchers to choose consistent strokes that have limited influence from chosen race strategies. Reproducibility of power output during the 2000 m trials was highest between 1000 m and 1500 m. When a sample of consecutive strokes is required for analysis of a rower's technique at a consistent power output the strokes should be recorded from the third quarter of a 2000 m trial. Performance reliability of trial number Previous research has shown that, for optimal reliability, participants should complete a familiarisation protocol before testing begins (Hopkins et al., 2001). In this study the %SEM on the Concept II ergometer decreased (i.e. reliability improved) by 0.9% when measured between races two and three compared to between races one and two. However, when comparing the same races on the RowPerfect ergometer. the %SEM increased from 2.8% to 3.3%. Similarly, when comparing paired 500 m races on either the Concept II or RowPerfect ergometers. the %SEM did not improve. A possible explanation is that the rowers were less familiar with racing on the RowPerfect ergometer than the Concept II ergometer or with 500 m races than with 2000 m races. CONCLUSION The most appropriate protocol for testing the influence of an intervention on the ability of a rower to improve mean power output would be 2000 m races on a Concept II ergometer (%SEM range = 0.8 to 2.9%), after a familiarisation trial. Whether this protocol is optimal for technique assessment is yet to be determined. When using the RowPerfect ergometer, researchers, coaches and trainers need to be aware that between 2.2 and 7.0% of any changes in mean power output might be normal rower variability, not associated with any training gain or loss or any intervention. Researchers need to be aware that greater measurement errors were found during power output performance trials less than 2000 m and on the RowPerfect ergometer. ACKNOWLEDGEMENTS The authors would like to acknowledge the assistance of the research students who helped with data collection and Professor Will Hopkins for data analysis counsel. REFERENCES Buck. D. P, Smith, R. M.. and Sinclair. P J. (2000). Peak ergometer handle and foot stretcher force on Concept II and RowPerfect rowing ergometers. Communication to 18th International Symposium on Biomechanics in Sport, Hong Kong, China, 25-30 June.
248
CLARA SOPER and PATRIA A, HUME
CRASH-B. Sprints World Indoor Rowing Championships (2004). Retrieved March 22, 2004, from http://www.crash-b.org/history.htm Dawson, R. G., Lockwook. R. J.. Wilson. J. D.. and Freeman. G. (1998). The rowing cycle: Sources of variance and invariance in ergometer and on-thewater performance. Journal of Motor Behaviour, 33. 3 3 ^ 3 . Elliott. B. C . Lyttle. A. D., and Birkett, O. (2002). The RowPerfect ergometer: A training aid for on-water single scull rowing. Journal of Sport Biomechanics, 1. 123-134. Halliday. S. E.. Zavatsky. A. B.. Andrews. B. J.. and Hase, K. (2001). Kinematics of the upper and lower extremities in three-dimensions during ergometer rowing. Communication to Congress of the International Society of Biomechanics. Zurich, Switzerland, 8-13th July. Hickey, M. S., Costili, D. L.. McConell, G. K.. Widrick. J. J., and Tanaka. H. (1992). Day to day variation in time trial cycling performance, hiternational Journal of Sports Medicine. 13. 467-470. Hopkins. W.. Schabort. E. J., and Hawley. J. A. (2001). Reliability of power in physical perfbrniance tests. Sports Medicine, 31, 211-234. Kramer, J. R, Leger. A.. Paterson, D. H., and Morrow. A. (1994). Rowing performance and selected descriptive, field, and laboratory variables. Canadian Journal of Applied Physiology, 19. 174-184. Lamb. D. H. (1989). A kinematic comparison of ergometer and on-water rowing. American Joumal of Sports Medicine, 17, 367-373. Martindale, W. O.. and Robertson. D. G. E. (1984). Mechanical energy in sculling and in rowing an ergometer. Canadian Joumal of Applied Sport Sciences,9, 153-163. Morrow. J. R.. and Jackson, A. W. (1993). How "significant' is your reliability? Research Quarter/y for Exercise and Sport, 64, 352-355. Peltonen, J.. and Rusko. H. (1993). Interrelations between power, force production and energy metabolism in maximal leg work using a modified rowing ergometer. Joumal of Sports Sciences, 11, 233-240. Rekers. C. J. N. (1993). Verification of the ROWPERFECT ergometer. Communication to Amateur Rowing Association Senior Rowing Conference, London, 2 October. RowPerfect. C. (2004). The CARE ROWPERFECT rowing simulator. Retrieved 20/01/04. 2004. from http://www.rowperfect.com/itel800.htm Ryan-Tanner, R.. Hahn. A.. Lawton, E.. Bellenger, S., and Keams. A. (1999). A comparison of 'performance" during on-v^atcr racing and ergometer rowing - abstract. Communication to 5th IOC World Congress on Sport Sciences, Sydney, Australia. 31-5 November. Schabort. E. J., Hawley. J. A.. Hopkins. W., and Blum. H. (1999). High reliability of performance of well-trained rowers on a rowing ergometer. Joumal of Sports Sciences, 17. 627-632. Smith, R.. and Milburn. P. (1996). Fatigue effects in maximal ergometer rowing. Communication to Australasian Biomechanics Conference, Sydney, Australia, 1-2 February.