9.4
REMOTE DETECTION AND REAL-TIME ALERTING FOR IN-CLOUD TURBULENCE Jason A. Craig*, John K. Williams, Gary Blackburn, and Seth Linden National Center for Atmospheric Research, Boulder, Colorado Rocky Stone United Airlines, Denver, Colorado
1.
INTRODUCTION
Under direction and funding from the Federal Aviation Administration (FAA), the National Center for Atmospheric Research (NCAR) has developed the NEXRAD (Next Generation Radar) Turbulence Detection Algorithm (NTDA) to remotely detect in-cloud turbulence using ground-based Doppler radar data. The NTDA is a fuzzy-logic algorithm that uses radar reflectivity, radial velocity, and spectrum width data to perform data quality control and compute eddy dissipation rate (EDR), an atmospheric turbulence metric, along with an associated confidence (EDC). A real-time demonstration of the NTDA capabilities using level II data from 83 NEXRADs was run at NCAR for the summer and fall of 2007. The NTDA output was mosaicked every 5 minutes into a high-resolution 3D Cartesian grid covering most of the CONUS east of the Rocky Mountains. This mosaic was made available to airline dispatch and Central Weather Service Unit users via a Java web display. Customized ASCII messages depicting character graphic plan views and vertical cross sections of the NTDA mosaic product were created for all United aircraft flying within the grid. Additionally, United Airlines Line Check Airmen (LCAs) could receive their ASCII messages via the onboard Aircraft Communication Addressing and Reporting System (ACARS) printer by registering their flight through an NCAR website. A second website was used to submit feedback on the uplink messages’ accuracy and utility. This paper presents an overview of the NTDA and the operational demonstration; presents sample web display and uplink message images; establishes the NTDA’s utility based on pilot feedback; and describes the planned integration of NTDA data into a new comprehensive, rapid-update version of the nationwide Graphical Turbulence Guidance product in support of the Joint Planning and Development Office’s NextGen aviation weather vision. 2. NEXRAD TURBULENCE DETECTION ALGORITHM (NTDA) The NTDA has been developed at NCAR during the past several years under direction and funding by the FAA’s Aviation Weather Research Program with the * Corresponding author address: Jason A. Craig, National Center for Atmospheric Research, P.O. Box 3000, Boulder, CO 80307; email:
[email protected].
goal of providing a new capability for directly detecting turbulence that may be hazardous to aviation in clouds and thunderstorms. In February 2007, the NTDA software was delivered to the National Weather Service Radar Operations Center for inclusion in the NEXRAD Open Radar Product Generator (ORPG) and should become operational with the ORPG Build 10 deployment scheduled to begin in the spring of 2008. The initial version of the NTDA is based primarily on spectrum width measurements, which are carefully quality controlled using information from all three radar moments. For locations where there is a sufficiently strong radar return (e.g., in clouds and precipitation) and the spectrum width contamination is not too large, the NTDA produces estimates of eddy dissipation rate (EDR), an aircraft-independent atmospheric turbulence metric. These values are produced for each elevation tilt on a polar grid with 1 degree azimuth and 2 km range spacing. Once NTDA data transmission and distribution is established, the NTDA data should be made available to all interested users. In particular, it is anticipated that will be collected and used to create an operational 3-D national mosaic of turbulence for use in aviation weather products (Fang et al. 2008). 2.1 NTDA Algorithm The NTDA algorithm was systematically described in Williams et al. (2006); the major elements are as follows: (1) The radar data are censored to remove measurements that appear so contaminated that they have no use to the algorithm. These include typical “ring“ artifacts of spurious values and “sun spikes“ generated when the radar points near the sun. (2) A set of “interest maps“ are used to assess the quality of each spectrum width measurement based on its estimated signal-to-noise ratio (SNR), overlaid power ratio (PR), the local variance of the spectrum width field, the deviation of the spectrum width measurement from a local linear fit of its neighbors, the associated reflectivity and height above ground, the likelihood that the measurement is contaminated by Anomalous Propagation (AP) clutter returns (see Kessinger et al. 2005) and the range of the measurement from the radar. These are combined to produce a “confidence” value for each spectrum width measurement. Different interest map definitions are used for each Volume Coverage Pattern (VCP), since each VCP uses a different operational mode and hence has different error statistics for spectrum width. These interest
maps have been determined based on both simulation results and empirical data. (3) The spectrum width measurements are squared 2/3 (the 2/3 power of eddy and scaled into ε dissipation rate) by multiplying by a rangedependent factor with a form determined by turbulence theory (e.g., Cornman and Goodrich 2006) and modified based on empirical data. A local confidence-weighted average is taken around each grid point, followed by a square root, to generate the field EDR field (really the cubed root 1/3 of eddy dissipation rate, ε , which appears to be approximately proportional to human assessments of aircraft turbulence encounter severity). The associated confidence field, EDC, is computed via a local average of the spectrum width confidences. 2.2 NTDA-2 enhancements While the previous section describes the initial version that will become operational in ORPG Build 10, several enhancements to NTDA are already underway to create the next version, NTDA-2. Most significant so far has been the incorporation of interest maps designed to reduce spectrum width confidence for pixels at which which clutter filtering was applied, either from the automated bypass map or operator-defined censor zones, and for pixels contaminated by overlaid clutter. In addition, a new interest map was added to modify the quality control of measurements based on their relative location to the Doppler unambiguous range. Case studies suggest that these additional quality control procedures should reduce instances of spurious elevated turbulence regions that frequently appear near the beginning of the second-trip echo region. A number of additional enhancements will be required to keep the NTDA functioning well in the future given the many planned changes to the NEXRAD’s Open Radar Data Acquisition (ORDA) system, which will include the addition of dual-polarization capability and new operational modes. This work is ongoing.
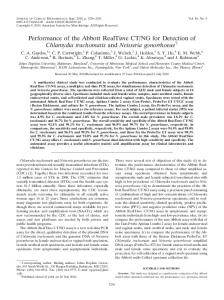
Figure 1: Map showing the NTDA demonstration mosaic domain (magenta rectangle), cockpit uplink domain (green polygon), and the 83 NEXRADs used (blue diamonds).
3. THE NTDA DEMONSTRATION SYSTEM The NTDA demonstration system used Level II data from 83 WSR-88D (NEXRAD) radars spanning the region from the Atlantic coast to the Rocky Mountains and from northern Florida to the Canadian border. Figure 1 shows the locations of the NEXRADs used and the domain of the system. The level II data was obtained in real-time from the Integrated Radar Data Services (IRaDS) and ingested using Unidata’s Local Data Manager (LDM) software. 3.1 Nexrad2Netcdf To mimic the functionality of the NEXRAD ORPG system, some preprocessing was performed in an application called Nexrad2Netcdf. When it is transmitted via IRADs, the Level II data is packaged into files containing at most 100 beams. Nexrad2Netcdf first verifies the correct file ordering and then buffers the data until a full elevation tilt is read. Split cut tilts (lower elevation angles where reflectivity and Doppler sweeps are separate) are merged together by aligning the beams between the two. Then the Radar Echo Classifier (REC; Kessinger et al. 2003) algorithm is run on the sweep to produce an assessment of AP clutter likelihood. Finally the reflectivity, radial velocity, spectrum width, REC, and current clutter map are written out to a NetCDF file. One instance of this process is created to handle data from each of the 83 NEXRADs. Once written out to a NetCDF file, the NTDA process immediately picks up the data and runs the NTDA described above on the sweep, producing another NetCDF output file containing EDR and EDC. 3.2 Mosaicking technique Every five minutes a mosaic algorithm is run to create a 3D Cartesian grid of the NTDA turbulence data. The mosaic software reads the last ten minutes worth of NTDA output and uses the most recent elevation tilts from each radar. The mosaic grid had 15 vertical levels at intervals of 3000 ft starting at 3000 ft. The horizontal resolution of the grid is 0.02° latitude and 0.02° longitude, or approximately 2km × 2km with a coverage of -106.2° to -72.2° longitude and 29.2° to 49.0° latitude. To reduce overall execution time, it is necessary to run two instances of the mosaic algorithm on separate servers. One instance covers the region north of Tennessee and one covers from Tennessee south. While the coverage of these sub mosaics had no overlap, they share some radars to produce complete coverage along the border. The two sub mosaics are immediately stitched back together once both have finished running. The mosaicking algorithm works by computing the latitude, longitude and Mean Sea-Level (MSL) altitude of each spherical-coordinate radar data point, then incorporates it into a distance- and confidence-weighted average for each Cartesian grid point nearby. EDR values with an associated confidence less than 0.01 are ignored. The distance weighting function used is determined by the VCP being employed, and is designed to interpolate vertically and use a rangedependent Gaussian-shaped smoothing kernel in the horizontal. Additionally the height of the maximum radar
measurement for each column in the grid is computed. This height field is then smoothed and used as an estimate to the cloud top height. Data above the estimated cloud top height are assigned a confidence of zero and removed. This last step is useful in mitigating the radar “ring” artifacts that otherwise often appear in the mosaic, particularly at upper altitudes. 3.3 Aircraft data feed The Aircraft Situation Display to Industry (ASDI) data feed is a subsystem of the Enhanced Traffic Management System (ETMS) of the FAA. This data feed provides near real-time location of all aircraft, including United Airlines flights, in the National Airspace System (NAS). The data feed is ingested at NCAR through a satellite link provided by WSI. It provides flight take-off, landing and position reports along with registered and updated flight plans. Take-off, landing and position reports are parsed and saved into a database. Flight plans are decoded using a list of FIXs, Jetways, intersections, arrival routes, and take off routes to produce a sequence of latitudes and longitudes that depict the anticipated flight route. A second database is kept up to date with data from the FAA’s National Flight Data Center containing all potential FIXs, Waypoints, and Nav Aids. Once a route is decoded it is placed into a third database. 3.4 ASCII message generation Directly following creation a merged turbulence mosaic, custom ASCII messages are generated for every United Airlines aircraft within the uplink domain depicted in Figure 1. An example message is shown in Figure 5. The last five minutes of position reports are read in from the ASDI database and the latest point for each aircraft within the grid is saved. The latest flight plan registered for each flight is loaded and the most recent altitude and position are projected forward approximately three minutes to account for the delay in the message reaching the pilot. Next the direction of flight is calculated using the latest position reports and the registered flight plan. If the aircraft is ever more than 20nm off the registered flight plan, the projected position is based solely on extrapolation from previous position reports. Uplink maps are not generated for flights below 10000 ft, flights within 40nm of the departure airport or within 60nm of the destination airport, since in those regions pilots are usually occupied with takeoff or landing duties and do not have time to make use of a turbulence message. A custom grid based on the aircraft’s position, altitude, and heading is then calculated. The grid is 100 nm long in the direction the aircraft was heading, and 80 nm wide. The mosaic data values at the nearest altitude are then projected onto the new custom grid using the max value if more than one mosaic point lies within a custom grid point. Additionally, the three mosaic levels above and three below the custom grid altitude are calculated. These are then used to provide a vertical cross-section of in-cloud turbulence within 9,000 feet above and below the anticipated aircraft route. The custom grid must then be converted into an ASCII message capable of being sent to the aircraft’s
cockpit using currently available technology. This was done by thresholding the EDR values and mapping them to a set list of ASCII characters. The thresholds were chosen to represent light, moderate and severe turbulence as experienced by a medium-sized (e.g., Boing 757) aircraft flying at cruise speeds; in a future system, thresholds could be customized for the aircraft’s type, weight and airspeed. The values for the vertical cross-section are computed by taking the maximum data value for the nine grid points on either side of the center line, calculated for the three mosaic vertical levels above and below the plan view level. These maximum EDR values are converted to ASCII using the same set of character thresholds used for the plan view and are placed in vertical columns along the left side of the message to give a glimpse of turbulence above and below the aircraft along its likely flight path. Once the custom ASCII map is generated, additional flight information is added to the message. Along the top is a message title “Experimental Turbulence”, the flight number, aircraft tail number, projected aircraft altitude (in flight levels, i.e., 100s of ft), the projected time of the message, and the compass orientation of the map’s center line. Then a legend of character representations and the projected aircraft position is provided. Below the ASCII grid the valid time of the radar mosaic generation, the distance from the last waypoint on the registered flight route is displayed, and the pilot feedback web page is placed (not shown in Figure 5). Two vertical hash marks along the bottom are placed to show the limits of the domain used to generate the vertical cross-section view along the left. The registered flight route is marked with asterisks and any known waypoints or FIXs along that route are marked with pluses and labeled on the left. Each message generated by the system is checked against the database of registered flights to determine if it is a candidate for being uplinked to the cockpit. To limit uplinks to only those messages with useful turbulence information, a set of uplink criteria are used. Counts of the different turbulence ASCII characters are made in both the center of the message, similar to the area used to generate the vertical cross-section information, and also the entire message. The message is uplinked if any one of the thresholds, shown in Figure 2, is met. Whether or not the message is uplinked, it is stored in a database that may be reviewed by pilots via an NCAR website.
Smooth Light Moderate Severe
EDR
Rep
# for Uplink
0.0 .15 .30 .50
o l M S
2500 300 35 5
# in center for Uplink 500 50 5 2
Figure 2: Table showing the EDR turbulence severity thresholds for the character graphics ASCII representations, and also the minimum number of characters needed within either the entire message or the center region (within 9 characters of the center) to make the message eligible for uplink
3.5 ASCII message usage United Airlines participated in over a year of testing uplinked messages produced by the NTDA. To facilitate uplinks to only select United pilots, a website registration process was used. During the pre-flight briefing at United flight operations a pilot could register the flight they were about to fly with the NCAR demonstration system by logging on to a secure NCAR web page and entering their flight number, aircraft tail number, date, and destination airport. That flight would then receive all ASCII messages that passed the defined uplink thresholds mentioned above. The uplinked messages are then received by the Aircraft Communications, Addressing, and Reporting System (ACARS) printer onboard the aircraft. A web page was setup to allow feedback from pilots who received uplink messages. The pilot enters the date and flight flown and can then review all the messages for the flight, including messages that did not pass the criteria to be uplinked. Since the web page showed all messages it was a way for pilots to review the entire flight and give feedback on messages that were uplinked along with messages that they believed should have been.
deviating to the south of a large convective cell. The flight with moderate turbulence took off from Chicago and is headed to Atlanta. The overlaid turbulence reports correlate well with the NTDA turbulence measurements, even in areas where the reflectivity is 20 dBZ is below and aircraft commonly fly.
Figure 3: A NTDA in-cloud turbulence (EDR) mosaic with United Airlines in situ turbulence reports overlaid.
3.6 Web-based mosaic display In addition to the cockpit uplink messages, NTDA mosaic data was made available to dispatchers, Central Weather Service Unit, and other interested users via a web-accessible Java display similar to the visualization tool in Experimental ADDS (http://www.weather.aero). This tool overlays the NTDA EDR mosaic, confidence, or reflectivity grids over a U.S. map, and also provides access to several Experimental ADDS products including GTG turbulence forecasts, temperature, humidity, and wind speed. Wind barbs and PIREPs may optionally be overlaid, as can real-time in situ turbulence data obtained via the FAA’s automated EDR reporting system (Cornman et al. 2004). For purposes of display, the EDR is scaled into turbulence severity categories of Smooth, Light, Moderate, Severe, and Extreme. Since the NTDA is only able to detect turbulence within “in-cloud” regions where radar reflectivity is sufficiently strong and where spectrum width contamination is minimal, it is typical for much of the display to be shaded grey, representing “No Data,” as in the example displayed in Figure 3. It should be emphasized that “No Data” does not mean “no turbulence”; rather, no information at all is provided by the NTDA in these regions. 4. SAMPLE CASES th
A sample EDR mosaic from July 26 , 2007 is shown in Figure 3 and a corresponding reflectivity mosaic in Figure 4. In this example, widespread convection is evident from Indiana up through Wisconsin. Automatic in-situ turbulence reports from United Boeing 757’s are shown as dots, most of which are blue, representing smooth air. Green squares are in-situ reports of light turbulence and the single orange square is a report of moderate turbulence. A flight coming in from the east to Chicago’s O’Hare airport is
Figure 4: A reflectivity mosaic for the same case shown in Figure 3, again with United Airlines in situ reports overlaid.
Figure 5 shows an example of a “character graphics” ASCII uplink of an NTDA turbulence plot along a route of flight. In the example, United flight 476 is flying from Denver to Philadelphia. The left 7 columns of the printout depict a vertical profile of turbulence, from 9,000 feet below to 9,000 feet above the displayed altitude of FL330. To the right of the vertical profile is a “plan view” of the flight. The plan view shows NTDA turbulence at FL330, 40 miles left and right of the planned course, from the current aircraft position out to 100 nautical miles. The asterisks in the middle of the printout are the planned route of flight. Blank areas of the display are areas of “no detection“ due to insufficient radar return. Areas marked “o“ are smooth, “l“ is light turbulence, “M“ is medium turbulence, and “S“ is severe and greater turbulence. In the example shown, there is only smooth air and light turbulence.
/EXPERIMENTAL TURBULENCE FI UAL476/AN N385UA -- 27 May 2∅∅7 ∅∅:33:13Z FL 33∅ orient. 83 deg '+'=waypoint, '*'=route, 'X'=aircraft at 37.1N, 93.8W ' '=no_data, 'o'=smooth, 'l'=light, 'M'=mod, 'S'=severe ------------------------------(253 to BWG)---------------| * | * | * | * | * | * | * | * lll | l * lll |∅8∅ lllllll*l lll | lllllllllll*lll lll | lllllllllll*lllll lll | lllllllllll*lllll lll | lllllllllll*loolll lll | llllllllllll*lolll lll l | lllllllllll*l lll lll l | lllllllllllll*l llll lll l | llllllllllllll*ll llll lll l | lllllllllllllllll*llllllll lll l | llllllllllllllooll*llllllll lll o | lllllllllllllllooll*l lllll lll l | lllllllllllllllloool*llllllll lll l | llllllllllllllloooooo*oo lllll lll l | llllllllloloollllllllo*oo lll lll l | lllllllllolloolllllllol*oll lll l lll l |llllllllllloollllllllooo*ool lll lll l |llllllllllllolllollllooo*ollollll lll l |lllllllllllooolllllllooo*oll l lll lo |lllllllllllooollloooooo*olllll l lll l |∅4∅ llllllllooooooooooo*ooolloo l lll l |lllllllllollloooooooooo*ooolllo lll l |lollllllllllllooooooooo*oollllo ooo l |lollllllllllllooolloooo*oolllol ooo l |llllllllllllllllooooooo*ooollol ooo l |ollllllllllllllllloooo*oooooooo lll l |oollllllll llllllloo o*oooooo lll | ollllll ll * l llo | oo * ll | * ll | * ll | * o | * | * | * | * | * | * | * | * -------|---------valid-|----*---X--------|----------------9∅ +9∅|Left 4∅ ∅∅3∅Z (64 from TUL∅27∅69) Right 4∅
Figure 5: An NTDA demonstration uplink character graphics message received by one of the authors while piloting a United Airlines B737 flight over Springfield, MO. The depictions of smooth and light turbulence correlated very accurately with what was actually experienced by the aircraft.
United’s experience with the NTDA uplinks is that they very accurately depict the in-cloud turbulence the aircraft is flying through. Because the uplinks were tested on revenue passenger flights, it was not possible to fly into areas not allowed by standard operating procedures. Therefore, it wasn’t possible to fly into areas depicted as having severe turbulence. United pilots did fly into areas depicted as smooth, light turbulence, and occasionally moderate turbulence. The areas of no turbulence, light turbulence, and moderate turbulence closely correlated to what was depicted on the uplink printout. The cockpit uplink demonstration indicates that the NTDA shows promise as providing a tool that closely correlates with in-cloud turbulence. Initial indications are that the NTDA output correlates more closely with
actual in-cloud turbulence than the conventional parameter of precipitation intensity or reflectivity, the data available in the cockpit via the airborne radar. To maximize the use of capacity constrained airspace near convective weather, it will be necessary to have high confidence in the accuracy of NTDA delineating the boundaries between light, moderate and severe turbulence. A thorough validation that includes flights into moderate and severe turbulence is required to gain this confidence. Unfortunately, such data from commercial flights become available only when aircraft equipped with the automated in situ reporting system inadvertently fly into regions of severe turbulence, which is relatively rare. However, as the automated in situ turbulence reporting program continues to collect data and expand to additional airlines, a dataset is being assembled that can statistically demonstrate the NTDA’s accuracy and reliability with increasing confidence. 6.
CONCLUSION
This paper has presented an overview of the NTDA algorithm and an operational demonstration performed in the summer and fall of 2007. The NTDA has been shown to have good performance when compared to automated in situ reports of turbulence, and pilot feedback has shown that the uplink messages of turbulence are accurate and provide valuable information not available from any other source. The NTDA is scheduled to be deployed with the NEXRAD Build 10 upgrade in the spring and summer of 2008, and it is anticipated that the NTDA level III turbulence products from US NEXRADs should soon be transmitted and available to interested users. In particular, these data will be used to produce a nationwide 3-D mosaic of in-cloud turbulence. NSSL is currently developing software for this purpose patterned after their 3-D reflectivity mosaic software that is already being used at NCEP. The turbulence grids will help aviation users identify in-cloud turbulence, including turbulence associated with thunderstorms. In particular, it is anticipated that this turbulence detection data will be incorporated into a new rapid-update “nowcast“ version of the Graphical Turbulence Guidance (GTG) product, called GTG-N, which will directly address convective turbulence for the first time along with clear-air and mountain-wave sources. The NTDA represents an important new observation capability that will support aviation safety and efficiency by helping dispatchers, pilots, and otherusers identify hazardous airspace. The NTDA data and GTGN are both expected to become part of the NextGen data cube envisioned by the Joint Planning and Development Office (JPDO). While it is expected that private weather service providers will eventually be able to supply NTDA and GTGN data to pilots via Electronic Flight Bags and other superior in-cockpit technology, the demonstration presented in this paper shows that real-time in-cloud turbulence information has the potential to provide a valuable enhancement to pilot situational awareness.
7.
ACKNOWLEDGEMENT
This research is in response to requirements and funding by the Federal Aviation Administration (FAA). The views expressed are those of the authors and do not necessarily represent the official policy or position of the FAA. 8.
REFERENCES
Cornman, L. B. and R. K. Goodrich, 1996: The detection of atmospheric turbulence using Doppler radars. Preprints, AMS Workshop on Wind Shear and Wind Shear Alert Systems, Oklahoma City, OK. Cornman, L. B., G. Meymaris and M. Limber, 2004: An update on the FAA Aviation Weather Research Program’s in situ turbulence measurement and reporting th system. AMS 11 Conference on Aviation, Range, and Aerospace Meteorology, Hyannis, MA, 4.3. Fang, M., J. Zhang, J. K. Williams and J. A. Craig, 2008: Three-dimensional mosaic of the eddy dissipation th rate fields from WSR-88Ds. AMS 13 Conference on Aviation, Range, and Aerospace Meteorology, New Orleans, LA, P4.5. Kessinger, C., S. Ellis, and J. Van Andel, 2003: The radar echo classifier: A fuzzy logic algorithm for the rd WSR-88D. Preprints-CD, AMS 3 Conference on Artificial Applications to the Environmental Science, Long Beach, CA. Williams, J. K., L. B. Cornman, J. Yee, S. G. Carson, G. Blackburn and J. Craig, 2006: NEXRAD detection of hazardous turbulence. 44th AIAA aerospace sciences meeting and exhibit, Reno, Nevada, AIAA 2006-0076.