Remote Measurement of Breathing Rate in Real Time Using a High Precision, Single-Point Infrared Temperature Sensor Laura Boccanfuso and Jason M. O’Kane Department of Computer Science and Engineering University of South Carolina Columbia, SC 29208, USA
[email protected] [email protected]
Abstract— This paper presents a novel approach for remotely monitoring a user’s breathing rate in real-time using a high precision, single-point infrared sensor. Remote breathing detection is especially useful for rehabilitative robotic applications such as post-stroke and post-operative cardiac therapies, where continuous monitoring of a patient’s physical stress level can be used to adjust the level and duration of physical exertion throughout the course of therapy. Additionally, socially assistive robots which discreetly collect breathing information from their users, can customize interactions based on the perceived physiological state of the patient. The proposed approach is an important potential improvement for therapies where user mobility is an inherent part of the therapy and when users have a general aversion to being fitted with sensors. Further, due to its relatively small size and modular design, existing rehabilitative robot systems can be retrofitted with the proposed breathing detection system to enhance and extend their functionality. This research delivers a new technique for capturing changes in the sub-nasal skin surface temperature to monitor breathing events. Temperatures are obtained by tracking the sub-nasal region of the face, continuously targeting and sampling the infrared sensor. The breathing rate is automatically extracted using a sinusoidal curve-fitting function which provides an estimated rate in breaths per minute. Results from preliminary tests show this system effectively captures breathing rates within an error rate of under 2 breaths per minute in excess of 70% of typical test cases.
I. INTRODUCTION Detecting and tracking the physical and physiological state of humans is becoming a major focus of research in rehabilitative robotics (RR) and socially assistive robotics (SAR) because it promises to make robots better-suited to work more closely and more cooperatively with humans. For example, stroke patients undergoing physical therapy with RR are often asked to engage in exercises that repeatedly work a particular limb or muscle. A robot that is able to monitor the patient’s heart and breathing rate can provide encouragement or increase the workload when those indicators are within the normal range and suggest a break when some predefined threshold is exceeded. Another example is in the field of SAR where children with autism interact with a robot during therapy in order to improve their basic communication and social skills. If the child becomes distraught during the course
of the therapy, he or she may not be able to immediately communicate this fact to the therapist or teacher. A robot that is continually collecting information about the child’s heart and breathing rate can detect subtle shifts in the his or her emotional state and alert the child’s therapist before the child’s frustration escalates. Finding a way to detect stress remotely will be the necessary next step towards fully realizing this potential. A variety of methods have been used to collect data about a user’s emotional or stress state including measuring the amount of eye contact, body pose, number, quality and content of verbal utterances, and several physiological indicators such as galvanic skin response, EEG, breathing and heart rate. Galvanic skin response measures changes in the electrical conductance of skin [17] while EEG is used to measure the voltage fluctuations resulting from ionic current flows within the neurons of the brain [23]. Breathing is a physiological indicator which has been referred to as the “neglected vital sign” and is used as a critical measure of a user’s psychophysiological state [14], [19]. Two basic modalities have been employed to capture breathing events: contact and non-contact. Contact approaches have used wearable sensors such as thermistors, respiratory gauge transducers and acoustic sensors. These devices typically deliver accurate breathing data, but are generally not suitable for mobile applications or for people who are generally averse to wearing sensors. In addition, although solutions exist using non-contact methods such as infrared video cameras, radar and doppler modalities, these approaches rely on high-cost equipment and collecting and analyzing very large amounts of data at a high processing cost. This research presents the first non-contact breathing rate measurement technique suitable for most RR and SAR applications. This is accomplished by tracking changes in the sub-nasal skin surface temperature. Recorded temperatures are fit to a sinusoidal curve and the breathing rate is then extracted. The novel contribution of this paper is a simple, low cost system for the remotely collecting and monitoring of breathing rate.
II. RELATED WORK Studies related to the remote collection and use of physiological information have been published across multiple disciplines including computer vision [11], image and signal processing [15], human-computer interaction [2], biomedical engineering [18], plant science [10] and robotics [12]. Traditional approaches include using devices such as thermistors to measure the air temperature changes near the nasal region [5], respiratory belt transducers to measure changes in the circumference of the chest or abdomen [4] and batterypowered wearable sensors to detect the sound created by turbulence occurring in the human respiratory system [6]. Unfortunately, these devices are impractical for use in many real-world scenarios which require patient mobility or for patients who are disinclined to wearing sensors of any kind. A. REMOTE BREATHING DETECTION TECHNIQUES Remote breathing detection can be used in many applications when it is important to measure changes in breathing rate but it is not practical to attach sensors or receive frequent feedback from the user. One of the first published works which measures breathing rate remotely uses an active radar detector to measure movements of the chest caused by cardiac and breathing events [9]. Since then, other noncontact modalities have been explored including laser doppler vibrometry (LDV) [21], radio frequency scanners [1] and mid-wave infrared video cameras [18]. One study remotely collects physiological information using LDV to deduce the stress state of an individual based on vibrations of the skin directly covering the carotid artery [21]. The main drawbacks to this approach include problems with accurate tracking due to variances in patient physiology and the prohibitive cost of the technology. The biomedical engineering field has published a great deal of research dedicated to the acquisition of a wide variety of physiological information. A recent study uses a midwave infrared camera to capture breathing and heart rate based on air temperature changes near the nasal region [8]. This particular implementation was designed for polysomnography and relies initially on the manual identification of a primary region of interest in order to track the outer extent of the nostril region. Because of the large amount of image and data processing required and the small size of the nostril location to be tracked, segmentation becomes challenging and computationally expensive. Medical applications including polysomnography and the diagnosis and management of respiratory diseases may require a high level of precision that demands the collection and analysis of data relating to the entire breath waveform not just the number of breathing events. Our research uses a simpler, less expensive method which does not require capturing a large amount of precise data relating to the full breath spectrum.
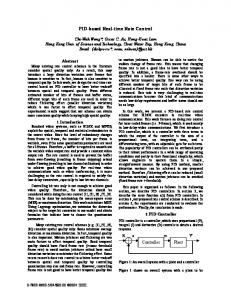
B. BREATH-DETECTING ROBOTS While the collection of physiological data for diagnosing disorders and stress in humans is not new, remotely recovering this information for use in robotics is an emerging field. Important recent research using robots and contact sensors have shown that physiological responses alone can be used to successfully recognize anxiety in humans [20]. One study uses a reasonably-priced, commerciallyavailable biofeedback device to control an iRobot Roomba [22]. Muscle tension signals from an OCZ NIA neural impulse actuator (typically used for video games) were used to deduce a user’s stress state and use that perceived state to adapt the Roomba’s movements accordingly. Other research applies the fundamental concept of human stress detection to the study of autism therapy [16]. Participants of the study were fitted with biofeedback sensors which measured heart rate variability, skin conductivity, eyebrow movement, jaw clenching, and body temperature. The key to this approach includes designing an affective control architecture and creating rules by which the robot decides how to respond when the threshold anxiety level is reached. The modes of collecting physiological data described in these studies have been effective but each method still requires that the subject be fitted with the proper biofeedback sensors. In some controlled settings and with certain subjects, this may not be an issue. However, their efficacy in dynamic environments where people cannot be fitted with biofeedback sensors or in certain medical or therapeutic settings where persons are averse to wearing sensors is still somewhat limited. This paper presents a complementary approach in which one important physiological indicator - breathing - is collected using a non-contact modality. III. METHODOLOGY This research presents a new technique for remotely capturing and measuring breathing rates to ultimately deduce a user stress state. Although resting breathing rates may vary from one individual to the next, healthy adults have a typical resting breathing rate between 8-16 breaths per minute [7]. Normal breathing consists of three phases: inspiration, expiration and a postexpiratory pause. Inspiration occurs when the diaphram contracts, creating negative pressure inside the chest cavity and the passive process of expiration follows as a function of the elastic recoil property of the lungs [13]. In our research, one complete breathing cycle is measured as the interval between the beginning of the expiration phase and the beginning of the next expiration phase. The breathing rate measurement system described in this research (see Figure 1) employs a single-point infrared sensor. To measure breathing rate with this sensor, our system: (1) aims the sensor at a pre-defined sub-nasal target region using the location of the nose as extracted from the most recent video frame and, (2) extracts the temperature information provided by the sensor analog signal. To achieve these objectives,
Fig. 1.
Remote breathing monitoring system. Front view (left) and profile view (right).
a specific combination of hardware and software was included in the overall system design. A. HARDWARE Our breathing measurement system uses a custom-built actuated platform, on which we mounted a non-contact infrared temperature sensor and a camera. The primary hardware components of this system are enumerated below. 1) Infrared Sensor: The infrared sensor is a FAR infrared (spectral range 8 − 14 microns) sensor. The sensor is capable of reading a range of temperatures between 30 − 150◦C. This single-point sensor has an optical resolution of 15 : 1 with a reading precision or temperature resolution of 0.025◦C and an accuracy of approximately ±1◦ C or 1% of the reading. 2) Camera: A consumer-grade USB camera is mounted below the IR sensor to assist maintaining a correct aim of the IR sensor at the user’s sub-nasal region. 3) Pan-tilt platform: Both the IR sensor and the camera are mounted on a direct-drive pan-tilt platform, actuated by two titanium gear servos. The servos are powered by a 7.4V, 2100mA lithium polymer battery, and controlled over USB via an 8-channel servo controller board. B. SOFTWARE The software developed for our system manages three main functions: (1) infrared sensor positioning, (2) infrared temperature collection, (3) data pre-processing and breathing rate calculation. Sensor positioning is accomplished through repeated nose detection and automatic adjustment of the infrared sensor’s pan and tilt angles in order to maintain the region of interest within a pre-defined target. Temperatures are obtained by sampling the IR sensor and processing the signal to convert to a Fahrenheit temperature reading. Finally, the
Fig. 2.
Nose and infrared sensor regions of interest.
data set is smoothed with a low-pass filter and curve-fit using a sinusoidal function to extract the breathing rate as measured by the infrared sensor. 1) Targeting the IR sensor: A camera is used to assist with the positioning of the infrared sensor. Because the camera is mounted on the same pan-tilt platform as the infrared sensor, the center of the sensor’s target region remains at a constant (x, y) offset from the center of each camera image. In this paper we refer to the sensor’s target region as the “infrared region of interest” (irROI.) For the sensor to be positioned properly, a corresponding target point on the image of the subject’s face is defined and aligned with the irROI from one image to the next. We use the nose classifier from the freelyavailable OpenCV library [3] to perform nose detection, extract the nose region of interest (ROI) and compute the (x, y) coordinates of the nose centroid. Positioning the sensor to point at the sub-nasal target area is accomplished by maintaining the nose centroid within the irROI in each image
FittedSine(x) = A sin(2π /T x + C) + B
(1)
Based on the results of this curve-fitting operation, we use the value assigned to the variable T as the breathing rate output of the system. To perform the curve fitting we use the curvefitting command provided by the freely-available graphing utility, gnuplot [24]. Gnuplot uses an implementation of the nonlinear least-squares Marquardt-Levenberg algorithm, where a user-defined function is fit to a set of input data. After each iteration of the algorithm, the quality of the fit is determined by the sum of the squared differences or “residuals” between the input data points and the function values, evaluated at the same places. Each iteration of the algorithm attempts to minimize the residuals, and terminates only when a specific residual minimum or limit is reached. In our implementation, we are curve-fitting data sets in real-time so it is important to set the residual low enough for an accurate fit but not so low that computation causes delay in processing
96.1
IR Data Sine curve fit
96
Temp (f)
95.9 95.8 95.7 95.6 95.5
14
16
18
20
22 24 Time (secs)
26
96.1
28
30
32
IR Data Sine curve fit
96 95.9
Temp (f)
video frame. Continuous positioning of the infrared sensor is driven by repeated nose detections which provide the (x, y) coordinates of the centroid of the nose ROI. This centroid position must be maintained within the rectangular irROI in order to keep the sensor in a stable position. Should the nose centroid move outside of the irROI, incremental pan and tilt commands are automatically generated and executed until the sensor returns to a stable position. 2) Infrared temperature collection: The infrared sensor is initially sampled for 15 seconds, the temperature data set is stored and an initial breathing rate is computed. Subsequent data sets consist of the last 10 seconds from the previous data set and the next 5-second window of temperature data. Samples are collected at a rate of approximately 6 times per second and each is recorded along with a corresponding timestamp. The breathing rate is recalculated each time a full 5-second window of breathing data is collected. This “sliding window” approach enables the system to detect subtle changes in the breathing rate quickly since small increases or decreases in breathing begin to affect the overall breathing rate within a few seconds (Figure 3). 3) Data pre-processing and breathing rate calculation: Temperatures are continuously sampled from the infrared sensor regardless of whether the sensor is stable or not. For this reason, readings too low to be considered human body temperature are assumed to be room temperature or another non-human source and are excluded from the collected data set. Additionally, in order to smooth out occasional noise from the sensor signal, a low-pass filter is applied to each set of data collected by the infrared sensor. Obtaining individual breathing rates for the infrared sensor data sets is achieved by fitting a sinusoidal curve to the infrared data. We observed the best curve-fitting results using four basic fitting parameters: period T , mean B, amplitude A, and offset C.
95.8 95.7 95.6 95.5 95.4
18
20
22
24
26 28 Time (secs)
30
32
34
36
Fig. 3. Successive sliding windows of IR sensor readings. Solid line corresponds to infrared temperature data. Dashed line corresponds to the curve-fit results.
each consecutive data set. After testing several values, we found that the best residual limit for our implementation is 10−15. The function we defined to fit the collected temperature data sets is a sinusoidal curve, with several fitting parameters added. To help in assessing the quality of the curve-fit and the resulting breathing rate output, a running average of the residuals was computed for each data set and an error threshold was defined. Residuals in excess of five times the residual average for each data set were not considered successful and were classified as “no response.” This technique allows the system to determine when it has succeeded in fitting a curve to the infrared data and to avoid generating erroneous results when this is not the case. IV. EXPERIMENTS Experiments were conducted to measure the effectiveness of the single-point infrared sensor for monitoring breathing rate, the accuracy of the nose detection classifier and the reliability of the self-reporting mechanism. A. PREMILINARY TESTS Early tests revealed occasional drifting with the OpenCV nose-detection classifier due to changes in ambient light and the angle of the nose. Additionally, because typical breathing can vary in terms of breath length and frequency, collected temperature data did not always conform to a uniform sinusoidal wave within each data set. Finally, collecting the ground truth for breathing using manually reported data was susceptible to inconsistencies caused by participants failing
to report breaths or inadvertant pushes of the self-reporting button. Each of these issues were addressed in the formal experiments that followed. To reduce potential drifting in the nose detection system, formal testing was conducted in a temperature-controlled setting with controlled lighting conditions. In order to manage errors resulting from a poor fit of the sine wave function to the breathing data, the sum of squares residuals were extracted from curve-fitting results in order to assess the quality of the fit between each data set and the curve generated. Inaccuracies in manually reported data were mitigated by removing instances when it was clear that the study participant failed to report breathing events. It would be impossible to remove all inaccurately reported data since a participant may fail to report just one or two breaths per minute for a given data set. However, data sets in which manually reported breaths were 0.00 per minute for a given window were discarded. Even though the error contributed by each of these factors was minimized, it was not completely eliminated. Consequently, we believe formal test results were still somewhat influenced by errors from limitations in nose detection, curve-fitting and manually reported data and resulted in higher residual values and lower values for accuracy. Data Sets
Typical
Anomaly
Successful response No response
74.8%
16.4%
68.8%
25.2%
83.6%
31.2%
Fig. 4.
All
Response rate across data sets.
B. FORMAL TESTS 1) Experiment setup: Formal experiments were conducted with ten study participants, four females and six males, between the ages of 18 and 60. Individuals who participated in this study were not taking medication which could interfere with their breathing at the time of the experiment. Each participant sat in a chair that was placed approximately 30 inches from a rolling table equipped with the infrared sensor system and a laptop computer. Each study subject watched a video playing on the laptop computer for approximately 10 minutes. The primary purpose of the video was to maintain the participant’s attention in a forward-facing, relatively still position. In addition, participants were provided a push-button sensor to self-report their breaths. We used this self-reported data as ground truth to evaluate our system’s performance. Each individual was asked to breathe naturally through the nose and to push the button through the entire expiration phase. As with the infrared temperature collection, manual reports of each expiration were collected in 15-second windows and subsequent data sets consist of the last 10 seconds of the previous window and the next 5-second window. Each data
entry in the window includes a timestamp and a corresponding “high” (expiration) or “low” (other) temperature. Breathing rates based on manually reported expirations are calculated by dividing the number of complete breaths recorded in a given window by the total number of seconds elapsed between the beginning of the first complete expiration and the beginning of the last reported expiration. Data Sets
Typical
Anomaly
< 4 bpm
94.1%
76.9%
91.2%
< 3 bpm
86.9%
71.2%
83.2%
< 2 bpm
70.9%
53.8%
63.5%
< 1 bpm
42.4%
38.5%
37.4%
Fig. 5.
All
Successful response results in breaths per minute.
2) Experiment Results: Ten test sets, consisting of approximately 120 infrared and 120 manually reported breathing rates each, were collected and analyzed. Of those 10 sets, three were identified as anomalous due to frequent nose detection problems observed while the test was being conducted or a large number of missing manually reported entries. The other 7 test sets contain typical data collected when the nose detection and tracking was working properly and there were few, if any, missing manually reported entries. Approximately 75% of the typical test sets yielded breathing rates at or below the residual threshold (five times the residual average) and were classified as “successful” compared to approximately 25% of the anomalous test sets. Data from both typical and anomalous test sets exceeding the error threshold were classified as “no response.” A summary of the successful and “no response” rates for typical and anomalous data sets is shown in Figure 4. Accuracy was evaluated by computing the difference between breathing rates detected by the infrared sensor and breathing rates reported by study participants. Typical and anomalous test sets were analyzed separately and accuracy was measured in breaths per minute (bpm). Breathing rate entries were classified into one of four basic categories: (1) under 4 bpm, (2) under 3 bpm, (3) under 2 bpm and, (4) under 1 bpm, as illustrated in Figure 5. An important factor in assessing the accuracy of test data is the error threshold for determining which breathing rates were fitted successfully with the curve-fitting function and which were not. As the error threshold is increased, the number of breathing rates in the “no response” category decreases along with the number of breathing rates in the “successful” category. Conversely, with a very low error threshold, the number of successful breathing rates increases as does the number of breathing rates classified as “no response.” We selected a relatively low error threshold so as to evaluate only the data which most accurately reflects the effectiveness of
the infrared sensor. If a higher error threshold were used, the number of breathing rates with a poor fit would be increased and the resulting accuracy would reflect more about the performance of the curve-fit function and less about the sensor’s ability to detect temperature changes corresponding to breathing. V. CONCLUSIONS This paper presents a new non-contact technique for monitoring changes in the sub-nasal skin surface temperature to calculate breathing rate. The main objective of our research was to examine the effectiveness of using a non-contact, simple and low cost sensor for accurately measuring breathing rate. Overall, the results obtained from our formal experiments are very promising. Data from the typical test sets clearly demonstrate that a single-point infrared sensor, when accurately positioned, can detect subtle temperature changes corresponding to inspiration and expiration. Given the small size of the sensor and the minimal computation required for non-contact breathing monitoring (as compared to existing methods), this research demonstrates the usefulness of this sensing modality for RR and SAR applications. Preliminary experiments highlighted limitations with the methods used to position the sensor, collect ground truth and automatically compute breathing rates, but it is our expectation that they will be reasonably easy to overcome. Collecting ground truth can be accomplished using a respiratory belt transducer or thermistors. Nose detection can be improved by training a more robust nose classifier or by extracting depth map information from an RGBD sensor to identify the nose in an image frame. Results obtained from the curvefitting function can be further improved by using a fast fourier transform (FFT.) Future experiments will engage the study participant in a light activity that will require minimal movement while breathing is monitored. Additionally, sensitivity analysis of imprecise nose detection and an examination of the possible cross-effect of perspiration in the perinasal region will be considered in future tests. VI. ACKNOWLEDGMENTS We acknowledge support from the National Science Foundation (NSF Award No. 1004899) for this research. This research is also partially supported by a grant from the South Carolina Developmental Disabilities Council. R EFERENCES [1] A mini-robot with a long standoff capability to detect motion and breathing inside a compound (September 2011), http://www.tialinx.com/cougarfamily.html [2] Barreto, A., Zhai, J., Adjouadi, M.: Non-intrusive physiological monitoring for automated stress detection in human-computer interaction. In: Lew, M., Sebe, N., Huang, T., Bakker, E. (eds.) Human-Computer Interaction, Lecture Notes in Computer Science, vol. 4796, pp. 29–38. Springer Berlin / Heidelberg (2007) [3] Bradski, G.: The OpenCV Library. Dr. Dobb’s Journal of Software Tools pp. 120–126 (Nov 2000)
[4] Cacioppo, J.T., Tassinary, L.G., Berntson, G.G.: The respiratory system. In: Handbook of psychophysiology, pp. 235–244. Cambridge University Press (2007) [5] Chen, W., Zhu, X., Nemoto, T., Kanemitsu, Y., Kitamura, K., Yamakosh, K.: Involuntary monitoring of breath rate and heart rate during sleep. In: Magjarevic, R., Nagel, J., Magjarevic, R. (eds.) World Congress on Medical Physics and Biomedical Engineering 2006, IFMBE Proceedings, vol. 14, pp. 4050–4053. Springer Berlin Heidelberg (2007), http://dx.doi.org/10.1007/978-3-540-36841-0 1025 [6] Corbishley, P., Rodriguez-Villegas, E.: Breathing detection: Towards a miniaturized, wearable, battery-operated monitoring system. Biomedical Engineering, IEEE Transactions on 55(1), 196–204 (jan 2008) [7] Cretikos, M.A., Bellomo, R., Hillman, K., Chen, J., Finfer, S., Flabouris, A.: Respiratory rate: the neglected vital sign. The Medical Journal of Australia 188(11), 657–659 (2011) [8] Fei, J., Pavlidis, I.: Thermistor at a distance: unobtrusive measurement of breathing. In: IEEE Transactions on Biomedical Engineering. pp. 988–998 (2010) [9] Greneker, E.: Radar sensing of heartbeat and respiration at a distance with security applications. In: Proceedings SPIE, Radar Sensing Technology. pp. 22–27 (1997) [10] Jones, H., Serraj, R., Loveys, B., Xiong, L., Wheaton, A., Price, A.: Thermal infrared imaging of crop canopies for the remote diagnosis and quantification of plant responses to water stress in field. Functional Plant Biology 36, 978–989 (2009) [11] Kakadiaris, I., Passalis, G., Theoharis, T., Toderici, G., Konstantinidis, I., Murtuza, N.: Multimodal face recognition: Combination of geometry with physiological information. In: Proceedings, IEEE Conference on Computer Vision and Pattern Recognition. pp. 1022–1029 (2005) [12] Kulic, D., Croft, E.: Physiological and subjective responses to articulated robot motion. Robotica 25(1) (2007) [13] Macklem, P.T.: The mechanics of breathing. American Journal of Respiratory and Critical Care Medicine 157(4) (1998) [14] Masaoka, Y., Homma, I.: Anxiety and respiratory patterns: their relationship during mental stress and physical load. International Journal of Psychophysiology 27(2), 153–159 (1997) [15] Matsukawa, T., Yokoyama, K.: Visualizing physiological information based on 3dcg. Forma 25, 11–14 (2010) [16] McLaughlin, L.: Engineering meets emotion: New robots sense human distress. In: http://www.ncbi.nlm.nih.gov/pmc/articles/PMC3055998/Intelligent Systems, IEEE. vol. 18, pp. 4–7 (2003) [17] Montagu, J., Coles, E.: Mechanism and measurement of the galvanic skin response. Psychological Bulletin 65(5), 261–279 (1966) [18] Murthy, R., Pavlidis, I., Tsiamyrtzis, P.: Touchless monitoring of breathing function. In: Proceedings 26th Annual International Conference IEEE Engineering in Medical Biology Society, San Francisco, CA. pp. 1196–1199 (2004) [19] Pitzalis, M.V., Mastropasqua, F., Massari, F., Passantino, A., Colombo, R., Mannarini, A., Forleo, C., Rizzon, P.: Effect of respiratory rate on the relationships between rr interval and systolic blood pressure fluctuations: a frequency-dependent phenomenon. Cardiovascular Research 38(2), 332–339 (1998) [20] Rani, P., Sims, J., Brackin, R., Sarkar, N.: Online stress detection using psychophysiological signals for implicit human-robot cooperation. Robotica 20(6), 673–685 (2002) [21] Rohrbaugh, J., Sirevaag, E., Singla, N., O’Sullivan, J., Chen, M.: Laser doppler vibrometry measures of physiological function: evaluation of biometric capabilities. IEEE Transactions on Information Forensics and Security 5, 449–460 (2010) [22] Saulnier, P., Sharlin, E., Greenberg, S.: Using bio-electrical signals to influence the social behaviours of domesticated robots. In: Proceedings of the 4th ACM/IEEE international conference on Human robot interaction. pp. 263–264. HRI ’09, ACM, New York, NY, USA (2009), http://doi.acm.org/10.1145/1514095.1514167 [23] Tyson, P.: Task-related stress and eeg alpha biofeedback. Biofeedback and Self-Regulation 12(2), 105–119 (1987) [24] Williams, T., Kelley, C., et al.: gnuplot (1986), http://www.gnuplot.info