Aug 10, 2009 - Forest Fire Damage Estimation Using Remote Sensing and GIS. Ugur ALGANCIa ..... the Greek wildland fires of 2007, Nat. Hazards Earth Syst.
Remote Sensing for Science, Education, and Natural and Cultural Heritage
Rainer Reuter (Editor) EARSeL, 2010
Forest Fire Damage Estimation Using Remote Sensing and GIS Ugur ALGANCIa,b,1, Elif SERTELa,b, and Cankut ORMECIa,b Istanbul Technical University, Geomatics Engineering Department, Maslak, Istanbul, Turkey, 34469 b Istanbul Technical University - Center for Satellite Communications and Remote Sensing, Ground Receiving Station, Maslak, Istanbul, Turkey, 34469 a
Abstract. Forest fires have been causing serious damages and threats in Turkey especially over Aegean and Mediterranean Regions. Damage assessment as the result of a forest fire occurred on 10th August 2009 in Seferihisar district of Izmir, Turkey was conducted in this study. SPOT 4 images obtained before (01.08.2008) and after (31.08.2009) the fire were used in this study. Several digital image processing methods namely orthorectification, classification and level slicing were applied pre- and post-fire images to determine the burned and fire affected areas. Processed satellite images slope and aspect maps were analyzed within a Geographical Information System to reveal the relationships among the topography fire location and fire magnitude. Keywords. Forest fire, SPOT 4, classification, NDVI, change analysis
Introduction Forest fires can be considered as one of the most important environmental hazards. Natural or human-induced fires affect the natural ecosystem and wildlife significantly. Fires also threaten human life directly especially if the settlements are close to burning area and indirectly by destroying the forests which are the suppliers of oxygen. These kinds of fires also have impacts on region’s economy [1]. Aegean and Mediterranean regions have been facing forest fires frequently due to continental climate conditions with hot and dry summers. Forest fires are a recurring phenomenon in Turkey and according to statistics given by Turkish Ministry of Environment and Forestry 1.571.609 ha forest area were burnt as a result of 80012 fires since 1936 [2]. Rapid estimation of damaged area and its spatial distribution is essential for evaluating the impacts of fire in landscape and biodiversity [3]. Information extracted with this evaluation will be valuable for scientists and local administrations in restoration and rehabilitation stages after the fire [4]. Determination of burned area also provides land cover change information of ecology, which is important data for post fire restoration of the region [5]. Remote sensing technology can be used in different phases of fire management which are risk estimation, detection and assessment. Remotely sensed data provide rapid, accurate and reliable information for post – fire damage analysis with being spectrally sensitive to surface vegetative characteristics and structure. Multitemporal data acquisition and synoptic viewing capability are possible with remote sensing satellites [6]. Although different image processing methods are applied in burnt area mapping, the main objective of these methods is to determine the changes in reflective characteristics of the vegetation using their spectral signatures within the period of pre- and postfire. Previous studies stated a strong change in spectral values at this period and also a big difference between burned areas and their surroundings [7,8]. Most popular and effective two image processing methods are vegetation indices and classification methods. Especially, image classification techniques are found to be efficient in determining location and size of the burnt area [9,10].
Ugur ALGANCI, et al.: Forest Fire Damage Estimation Using Remote Sensing and GIS
In this research, the damage of a forest fire occurred on 10th August 2009 in Seferihisar district of Izmir, Turkey, was analyzed using remotely sensed data, topographic data and ground truth data. 1. Study Area Seferihisar is a district of İzmir that resides in Aegean Region of Turkey. District is located at south-west of the İzmir and its geographic location is between 26°45'00"E - 27°01'30"E longitudes and 38°17'00"N - 38°02'00"N latitudes (Figure 1). Topography of the district shows a complex characteristic with changing elevation from sea level to 680 m in Cakmaktepe Hill. Climatologic properties of district are in coherence with general properties of Aegean Region. Annual maximum temperature recorded for the district in July with 35.2°C. Annual wind speed is nearly 12.6 km/hr and relative humidity is 64%. A forest fire started with unknown reason at shrub area and spread a wide area with impact of 60 km/hr speed strong wind on 10th August 2009. Fire was extinguished after 17 hours fire fighting work.
Figure 1. Geographic location of the study area.
2. Data Used Three different data sets were used in this study being satellite images, Digital Elevation Model and ground truth data. Satellite images used in this research are two SPOT 4 data having 20 meter resolution Multispectral (MS) and 10 meter resolution panchromatic (PAN) bands acquired in 01.08.2008 and 31.08.2009. SPOT 4 MS data has 4 spectral bands at red (B1) green (B2) and near infrared (B3 and B4) wavelength portions. ASTER GDEM was the second satellite based data of this research, which is a 30 m resolution Digital Elevation Model derived from ASTER stereo images. Lastly, ground truth information such as climatic annual records, stance maps and photographs taken after fire were used to complete and validate the research (Figure 2) 424
Ugur ALGANCI, et al.: Forest Fire Damage Estimation Using Remote Sensing and GIS
Figure 2. Post- fire aerial photos of the district.
3. Methodology At the first stage of the digital image processing procedures, orthorectification of pre- and post-fire satellite images were conducted using ASTER GDEM data and Ground Control Points (GCP) obtained from 1:25.000 scaled topographic maps. The root mean square error (RMSE) values were ±0.40 and ±0.28 pixels, respectively. Then, three steps were employed for the detection of damaged areas after the forest fire in Seferihisar. In the first step, multispectral satellite images are subjected to spectral analysis which consists of vegetation index analysis and spatial profile analysis. In the second step, pixel based unsupervised image classification was applied to pansharpened pre- and post – fire images. In the last step, results from the previous steps were analyzed with the topographic data derived from DEM data in order to derive the relationships between topography and forest fire impacts. 3.1 Spectral Analysis Vegetation indices based on quantitative analysis of vegetation health and biomass density using spectral values from satellite imagery. These indices commonly use photosynthetically active image wavelength portions, which are NIR and Red. The result of ratio based indices is an image with pixel values between -1 and +1. High values in resultant images indicate healthy vegetation. In this study, orthorectified pre and post images of burned area were analyzed using Normalized Difference Vegetation Index (NDVI) algorithm (Figure 3). The formula of stated algorithm is as follows:
NIR − RED (1) NIR + RED Spatial profile analysis of multitemporal data is an alternative approach to determine the location of changed areas. Spatial profiles can be created for NDVI or spectral data to emphasize changed and unchanged regions. The NDVI or reflectance value of the same object will be represented differently along the spatial profile if there is a substantial change over the examined region. Figure 4 illustrates a spatial transect created from NDVI values over a burnt area. Green colour represents the pre-fire whereas red line represents the post-fire data. It can be easily seen from this NDVI =
425
Ugur ALGANCI, et al.: Forest Fire Damage Estimation Using Remote Sensing and GIS
transect that NDVI values of burnt areas changed significantly. Pre-fire NDVI values are positive values ranging from 0.05 to 0.25 representing healthy vegetation. However, post-fire NDVI values are mostly negative values representing the burnt areas. In the second transect belonging to unburnt area, NDVI values, so the graphics are very close.
Figure 3. Level sliced NDVI results of; (a) 2008 dated, (b) 2009 dated SPOT 4 MS imagery.
Figure 4. Spectral profile derived from layerstacked NDVI images.
426
Ugur ALGANCI, et al.: Forest Fire Damage Estimation Using Remote Sensing and GIS
3.2. Image Classification Pixel based image classification is a technique aimed to produce clusters and classes in a multi dimensional spectral space, using image pixels of multispectral satellite imagery. In unsupervised classification, results will be spectral clusters that formed according to input parameters and used algorithm [11]. Orthorectified and pan sharpened SPOT 4 pre- and post-fire satellite images were classified using Iterative Self-Organizing Data Analysis Technique (ISODATA) classification process. 20 initial clusters were created with 0,99 convergence threshold. The results were interpreted visually according to ground truth information and clusters combined to form final thematic classes namely deciduous forest, evergreen forest, shrub, agricultural fields, bare, residential, burnt and affected, using recode operation (Figure 5).
Figure 5. Classification results of; (a) 2008 dated, (b) 2009 dated pansharpened SPOT 4 images.
3.3. GIS Analysis Classification results and topographic information of the study area were subjected to GIS analysis in order to determine the relationship between topographic characteristics of the region and fire spatial distribution and magnitude. For this aim, aspect and slope maps were created from ASTER GDEM data. Then, these maps were converted to feature classes to be suitable for overlay analysis. Secondly, thematic classes obtained from classification process were converted to vector data from its original raster form. These two datasets were subjected to overlay intersection analysis in GIS environment. Figure 6 shows two important result of this analysis. In the left side of figure, magnitudes of the burnt zones were presented as spatial map and numeric values in hectare unit. In 427
Ugur ALGANCI, et al.: Forest Fire Damage Estimation Using Remote Sensing and GIS
the right side, locations of the fire damaged areas were presented in relation with the aspect map showing the orientation of topography.
Figure 6. Resulting images of overlay intersection analysis; (a) fire magnitude, (b) fire direction.
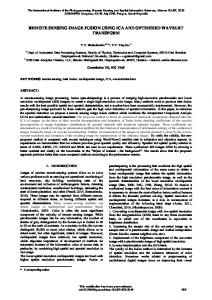
4. Results and Discussions According to results of this study, analysis of remotely sensed data provided valuable information for determination of the damaged areas after the forest fire occurred in Seferihisar District. Different methods were applied to analyze pre- and post- fire SPOT 4 Multispectral (MS) and Panchromatic (PAN) satellite imagery in order to detect the burnt and affected areas. Firstly, orthorectified MS data were processed to obtain NDVI data. Level sliced NDVI results indicated dramatic decreases over burnt areas that can be interpreted as completely destroyed vegetation. Second level of decrease in NDVI values were corresponded to affected areas. Pre- and post- NDVI images were layerstacked and spatial profile obtained from this data along a section confirmed the decrease. Secondly, unsupervised ISODATA classification algorithm was applied to orthorectified preand post- images. Resulting images were tested and verified using ground truth information and aerial photographs taken just after fire. Land cover changes between two dates were determined in hectare units (Table 1) and a change detection histogram was created using this information (Figure 7). Spatial distribution of burnt and affected areas showed a strong relation with NDVI data and ground truth information. In the third step, GIS analysis performed in order to correlate the magnitude and spatial distribution of fire with topographic parameters of the area. Spatial borders of the burned area were extracted from classified imagery using a raster – vector conversion. Aspect and slope maps derived from DEM of the area were also converted to vector data. These two datasets were subjected to 428
Ugur ALGANCI, et al.: Forest Fire Damage Estimation Using Remote Sensing and GIS
overlay analysis. According to results; 55.69% of burnt area has west side aspect where 25.55% has east side, 7.03% has north side, 10.98% has south side. Only 0.76% of burnt area is over flat terrain. The result agrees with wind direction information obtained from Turkish State Meteorological Service that states the wind direction as west side. This statistical result supports that, topography has significant affect on spatial distribution of fire damaged and affected areas. Table 1. Land cover change statistics derived from classification results of pre- and post- fire satellite images. Deciduous forest Evergreen forest Shrub Agr. Field Bare Residential Burnt Affected TOTAL
2008 (ha) 2014,37 1466,67 3000,07 652,84 1148,09 289,29 0,00 0,00 8571,33
2099 (ha) 1038,73 1179,53 2150,77 664,04 1119,34 283,56 1035,51 1099,85 8571,33
Figure 7. Change detection histogram of the land cover types.
The results of this research showed that, remotely sensed data is an important source to estimate and map the damaged and affected areas. Integrated usage of remotely sensed data and ground truth information give valuable information about spatial distribution and areal extends of the fire damages. In addition, land cover changes after the fire can be easily monitored with the use of multitemporal imagery being important information to understand the affects of fire on ecology and biodiversity. GIS environment provides a suitable platform to understand and correlate topographic information with satellite imagery and enables to perform analysis for identification of orientation and distribution of the fire. The results of these analysis can be presented as maps and statistical numeric values which are indispensable representation approaches of information for scientists and policy makers. References [1]
[2] [3]
Petropoulos, G. P., Knorr, W., Scholze, M., Boschetti, L., and Karantounias, G., Combining ASTER multispectral imagery analysis and supportvector machines for rapid and cost-effective post-fire assessment: acase study from the Greek wildland fires of 2007, Nat. Hazards Earth Syst. Sci., 10 (2010), 305–317. http://www.ogm.gov.tr De Santis, A., Chuvieco, E., GeoCBI: A modified version of the Composite Burn Index for the initial assessment of the short-term burn severity from remotely sensed data, Remote Sens. Environ., 113 (2009) 554–562
429
Ugur ALGANCI, et al.: Forest Fire Damage Estimation Using Remote Sensing and GIS
[4] [5] [6] [7] [8] [9]
[10]
[11]
Giglio, L., van der Werf, G. R., Randerson, J. T., Collatz, G. J., and Kasibhatla, P., Global estimation of burned area using MODIS active fire observations, Atmos. Chem. Phys., 6 (2006), 957–974. Roy, D. P., Jin, Y., Lewis, P. E., and Justice, C. O., Prototyping a global algorithm for systematic fire affected area mapping using MODIS time series data, Remote Sens. Environ., 97 (2005), 137–162. Somashekar, R.K., Ravikumar, P., Mohan Kumar, C.N., Prakash, K.L., Nagaraja,B.C., Burnt Area Mapping of Bandipur National Park, India using IRS 1C/1D LISS III Data, J. Indian Soc. Remote Sens. 37 (2009), 37–50 VanWagtendonk, J.W., Root, R. R., and Key, C. C., Comparison of AVIRIS and Landsat ETM+ detection capabilities for burn severity, Remote Sens. Environ., 92 (2004), 397–408. Lobola, T., Neal, K. J., and Csisar, I., Regionally adaptable dNBRbased algorithm for burned area mapping from MODIS, Remote Sens. Environ., 109 (2007), 429–442. Smith, A. M. S, Drake, N. A.,Wooster, M. J., Hudak, A. T., Holden, Z. A., and Gibbons, C. J.: Production of Landsat ETM+ reference imagery of burnt areas within Southern African savannahs: comparison of methods and application to MODIS, Int. J. Remote Sens., 28(12) (2007), 2753–2775. Quintano, C., Fernandez-Manso, A., Fernandez-Manso, O., and Shimabukuro, Y. E.: Mapping burnt areas in Mediterranean countries using spectral mixture analysis from a uni-temporal perspective, Int. J. Remote Sens., 27(4) (2006), 645–662. Ormeci, C., Alganci, U., and Sertel, E., Identification of Crop Areas Using SPOT – 5 Data, FIG Congress 2010 Facing the Challenges – Building the Capacity, Sydney, Australia, 11-16 April 2010 (online proceeding).
430