Remote Sens. 2011, 3, 2682-2703; doi:10.3390/rs3122682 OPEN ACCESS
Remote Sensing ISSN 2072-4292 www.mdpi.com/journal/remotesensing
Article
Remote Sensing Images in Support of Environmental Protocol: Monitoring the Sugarcane Harvest in S˜ao Paulo State, Brazil Daniel Alves Aguiar ? , Bernardo Friedrich Theodor Rudorff, Wagner Fernando Silva, Marcos Adami and Marcio Pupin Mello Remote Sensing Division (DSR), National Institute for Space Research (INPE), Av. dos Astronautas, 1758, S˜ao Jos´e dos Campos, SP 12227-010, Brazil; E-Mails:
[email protected] (B.F.T.R.);
[email protected] (W.F.S.);
[email protected] (M.A.);
[email protected] (M.P.M.) ?
Author to whom correspondence should be addressed; E-Mail:
[email protected]; Tel.: +55-12-3208-6465; Fax: +55-12-3208-6488.
Received: 20 October 2011; in revised form: 9 December 2011 / Accepted: 9 December 2011 / Published: 13 December 2011
Abstract: Traditional manual sugarcane harvesting requires the pre-harvest burning practice which should be gradually banned by 2021 for most of S˜ao Paulo State, Brazil, on cultivated sugarcane land (terrain slope ≤ 12%) according to State Law number 11241. To forward the end of this practice to 2014, a “Green Ethanol” Protocol was established in 2007. The present work aims at analyzing five years of continuous sugarcane harvest monitoring, based on remote sensing images, to evaluate the effectiveness of the Protocol, thus helping decision makers to establish public policies to meet the Protocol’s expected goals. During the last five crop years, sugarcane acreage expanded by 1.5 million ha, which was compensated by a correspondent increase in the green harvested land. However, no significant reduction was observed in the amount of pre-harvest burned land over the same period. Based on the current trend, this goal is likely to be achieved one or two years later (2015–2016), which will be five or six years ahead of 2021 as the goal in the State Law number 11241 states. We thus conclude that the“Green Ethanol” Protocol has been effective with a positive impact on the increase of GH, especially on recently expanded sugarcane fields. Keywords: “Green Ethanol” Protocol; green harvest; pre-harvest burning; satellite images
Remote Sens. 2011, 3 1.
2683
Introduction
In Brazil, the traditional process of sugarcane harvesting is manually performed using the practice of pre-harvest burning [1]. With the rapid expansion of sugarcane crop over the last few decades, this practice has become detrimental for many reasons, especially in terms of its negative impacts on human health and on the environment due to the emission of pollutant gases [2–5]. More recently manual harvesting has been replaced by combiners that do not require the burning practice. In S˜ao Paulo State, which is the largest producer of sugarcane in Brazil [6], the burning practice is scheduled to end by 2021 for most of its producing areas (terrain slope ≤ 12%), according to the State Law number 11241, which regulates the gradual elimination of the practice of pre-harvest burnings. In order to bring the end of pre-harvest burnings forward to 2014 the S˜ao Paulo State Secretary of Environment (SMA), the Sugarcane Industry Union (UNICA), and the supplier associations signed in June 2007 the “Green Ethanol” Protocol to promote sustainable production practices for sugarcane in S˜ao Paulo State [7]. The success of this Protocol depends on effective supervision by the state, but verification of its goals in the field is almost impractical once the sugarcane cultivated area in S˜ao Paulo State is close to 5.0 million ha, equivalent to 21.3% of the state’s territory [8]. Nevertheless, since 2003 remote sensing sugarcane maps have been made available for every crop year in S˜ao Paulo State [9]. Based on these maps, sugarcane harvest can be monitored with the use of remote sensing images which identify the type of harvest: green harvest (GH) or pre-harvest burning (BH) [6,9]. Partial results on the remote sensing harvest monitoring were published by Aguiar et al. [10] and Rudorff et al. [6] for crop years 2006/07 and 2008/09, respectively. The objective of the present work is to analyze a series of five years of continuous sugarcane harvest monitoring, based on remote sensing images, to evaluate the effectiveness of the “Green Ethanol” Protocol in anticipating the end of the sugarcane burning practice in S˜ao Paulo State. 2. 2.1.
Background The “Green Ethanol” Protocol
The “Green Ethanol” Protocol not only anticipates the end of the pre-harvest burnings established by State Law number 11241, but it also aims to reduce the amount of water used in the industrial sugarcane crushing process, and to recover the riparian forests within sugarcane production regions [7]. The Protocol is one of SMA’s 21 strategic projects to improve air quality and promote the improvement and conservation of native vegetation in S˜ao Paulo State (for details, see http://www.ambiente.sp.gov.br/agenda21.php). By 2010, 155 sugarcane mills representing 90% of the state’s production units had signed the Protocol [11]. The Protocol’s technical directives related to the anticipation of the end of pre-harvest burnings were established by type of producer: agribusiness units and suppliers. Under the Protocol’s rules, suppliers are small producers responsible for up to 12,000 tons of sugarcane in each crop year from sugarcane fields of up to 150 ha. They represent 92% of the state’s producers, but only 10% of the sugarcane production. It is necessary to distinguish between types of producers to make sure that small suppliers are not excluded from the productive process and have enough time to comply with the Protocol’s goals.
Remote Sens. 2011, 3
2684
The state government in its turn will award a certificate of agro-environmental conformity to agricultural and industrial sugarcane producers who adhere to the Protocol and comply with its technical directives. In addition, the state government will commit to stimulating an adequate transition from BH to GH, especially for sugarcane suppliers with acreages of up to 150 ha. Until pre-harvest sugarcane burnings are totally banned, producers must comply with two steps established in the legislation which regulates pre-harvest burnings in S˜ao Paulo State. Firstly, producers must send a Requisition for Burning to SMA by April, when the harvest season begins. This requisition is evaluated and registered in a digital map provided by producers with sugarcane fields ≥ 150 ha. For smaller fields, only the coordinates of the field’s centroid are required. When evaluating the requisitions, the goals established in State Law number 11241, as well as the goals and directives set out in the Protocol for its signatories, are taken into consideration. When pre-harvest burnings are authorized, the producer may proceed to the second step, which consists of informing the burning date/time. Nevertheless, before beginning the BH, the producer must be alert to the level of air humidity because, according to SMA Resolution 35, if the relative air humidity is less than 20%, all burnings are prohibited. In short, to comply with the requirements, producers should request a Requisition for Burning so that the yearly reductions of BH percentages, established by Law number 11241 (2002) and by the “Green Ethanol” Protocol (2007), can be met. Sugarcane burning practice in areas close to urban areas, environmental reserves, electrical energy substations, and railway and highway dominions is already prohibited by law. 2.2.
Monitoring Sugarcane Crop Using Remote Sensing
Sugarcane is a semi-perennial crop that, in S˜ao Paulo State, tends to reach its maximum vegetative development in April, when the harvest season starts. Sugarcane planting is mainly done at two moments: (i) at the start of the September–October rainy period, when twelve-month sugarcane is planted for harvesting between April and December of the following year; and (ii) at the end of the February–March rainy period, when eighteen-month sugarcane is planted for harvesting between April and December of the following year. Sugarcane can be harvested either manually or mechanically. When manually done, BH is necessary to burn away the leaves and make it easier to cut the canes. When mechanically done, the field layout must be systemized; this basically consists of: (i) making field dimensions more adequate for efficient operation of the combiner by creating long narrow fields; (ii) adjusting the planting spacing, usually to 1.5 m; (iii) adapting the soil conservation system, creating built-in terraces to allow the combiner to move among them and adjusting the terraces’ vertical spacing to allow the soil to be covered with cane litter; and (iv) removing stones and stumps that could damage the combiner [1]. Systemizing fields is costly and requires planning, and therefore has to be done prior to the planting of new sugarcane fields or during the renovation of old sugarcane fields. Following the harvest, the sugarcane plant sprouts (ratoon) again and can be harvested once a year for a period of about five to seven years, after which the field is renovated as a result of a gradual decrease in crop yield from the successive cuts, which makes the harvest economically unfeasible. Yield can be improved by crop rotation with a leguminous crop to improve the soil’s physical-chemical condition, or just by keeping the field fallow [12].
Remote Sens. 2011, 3
2685
Several characteristics of the sugarcane crop favor its identification in remote sensing images [6,13]. It is cultivated on a large scale in fields surrounded by pathways, and has adequate dimensions for identification in Landsat-type satellite images. Because it is a semi-perennial crop, the adequate image acquisition period for correct crop identification and mapping is extended, increasing the probability of available cloud-free images. Monitoring the harvest practice is further benefitted as the harvest season coincides with the period of less cloud persistence [6,9,14]. 3.
Materials and Methods
In S˜ao Paulo State, Brazil’s largest sugarcane producer [15], the type of sugarcane harvest practice has been monitored using remote sensing images since 2006. Located in the country’s southeast region, S˜ao Paulo State has an area of 248,209 km2 , of which 52,869 km2 were planted with sugarcane in crop year 2010/11 [8]. The state is divided into 645 municipalities and 15 administrative regions (ADRs), eleven of which grow sugarcane to produce sugar and ethanol. The remaining ADRs (Baixada Santista, Registro, S˜ao Jos´e dos Campos and S˜ao Paulo) do not grow significant sugarcane due to unfavorable climate and/or relief [16]. Figure 1 shows the location of S˜ao Paulo State, its administrative regions and the cultivated sugarcane land (available for harvest + under renovation) in crop year 2010/11. Figure 1. Sugarcane crop map for S˜ao Paulo State. Source: Canasat Project [8].
Remote Sens. 2011, 3 3.1.
2686
Remote Sensing Images
Visual interpretation technique of remote sensing images, obtained between April and December in each crop year, was carried out to identify and map the two types of sugarcane harvest practices (GH and BH). By far the major image source was from the Thematic Mapper (TM) sensor on board of Landsat-5 satellite (Table 1). Even though most of the sugarcane harvesting is performed during the dry season, when it is relatively favorable to acquire cloud free images, the Landsat-5 images often presented clouds that precluded image classification. Therefore, images from other sensors acquired by INPE’s ground station in Cuiab´a, MT, and available free of cost, were alternatively used as presented in Table 1. Two images from the Disaster Monitoring Constellation (DMC), and not acquired by INPE’s station, one in 2007 and the other in 2008 were acquired to fulfill gaps that were not covered by any of the other sensors in these years. Otherwise, the available images presented in Table 1 were sufficient to cover the State of S˜ao Paulo at least once a month so that the sugarcane harvest practices could be clearly identified and mapped. Sugarcane acreage in S˜ao Paulo State is covered by 13 Landsat scenes, therefore, 13 databases were created, to which the acquired images from 2006 to 2010 were gradually introduced to be analyzed using the SPRING software [17]. All images were registered based on the orthorectified mosaics from the Enhanced Thematic Mapper Plus (ETM+/Landsat-7) images obtained by the National Aeronautics and Space Administration (NASA) [18] using a first degree polynomial and the nearest neighbor interpolation. Registrations were performed to achieve a squared mean error of less than 0.5 pixels, as recommend by Dai & Khorram [19]. Table 1. Remote sensing images used to monitor the type of sugarcane harvest. Sensor/Satellite TM/Landsat-5 ETM+/Landsat-7 CCD/CBERS-2 and 2B LISS-III/IRS-P6 AWiFS/IRS-P6 DMC/Beijing-1 Total
3.2.
Covered Area By Scene 185 × 185 km 185 × 185 km 113 × 113 km 148 × 174 km 370 × 370 km 324 × 324 km
2006/07 75
75
2007/08 90
Crop Year 2008/09 2009/10 107 129
19
49
1 110
1 157
29 3 31 192
2010/11 158 4 9 34
205
Total 559 4 106 37 31 2 739
Monitoring the Type of Sugarcane Harvesting
The annual sugarcane harvest monitoring is carried out based on a map generated by the Canasat Project [8] that provides the total sugarcane area available for harvest at the beginning of the harvest season including the subclasses: (i) ratoon, which refers to sugarcane fields available for harvest from sprouting after the first or subsequent cuts; (ii) expansion, which refers to fields that were under other land use in the previous year and are now being cultivated with sugarcane, and (iii) renovated, which refers to sugarcane fields that have undergone renovation during the previous crop year [20,21] (Figure 1). The subclass of under renovation with eighteen-month sugarcane is excluded from the harvest monitoring since these fields will only be available in the following crop year.
Remote Sens. 2011, 3
2687
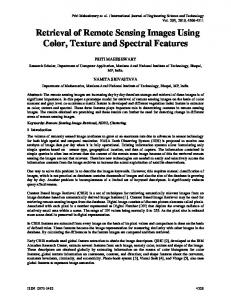
Figure 2. Multispectral [4(R)5(G)3(B)] and multi-temporal Landsat-5 images illustrating some instances in which post-harvest management influences the correct identification of sugarcane as either green harvest (GH) or pre-harvest burning (BH). GH and BH (1a); BH (2a) with later application of lime on top of the soil (2b and 2c); GH (3a) with the later burning of cane litter (3b); harvest in fields with slope ≤ 12% and with slope > 12% (4a); GH with combiner (5a); BH with combiner (6a and 6b). Photos taken in the field (1c, 2c, 4b and 5b) and acquired on the Web for illustration purposes (3c and 6b).
The type of sugarcane harvest is relatively easy to identify in images obtained a few days, or even a few weeks, after harvesting. Identification of harvest type is based on the reflectance difference between
Remote Sens. 2011, 3
2688
green harvested and pre-harvest burned fields. Green harvested fields appear bright in the images due to the “carpet” of litter left on top of the soil by the combiner [20,21]. This cane litter helps in soil conservation by maintaining carbon stocks and retaining moisture [22,23]. However, in colder parts of S˜ao Paulo State, such as the center-east region, the cane litter is layered between planting rows to promote the growth of ratoons (Figure 2(1b)) [24]. Pre-harvest burned fields appear dark in the images due to the presence of ash and the relative low reflectance of the bare soil compared to the soil with the “carpet” of litter. The visual interpretation of remote sensing images was done chronologically by several interpreters, classifying the harvested fields as either GH or BH. Up to 2008, this interpretation was done at once by the end of the harvest season using the most cloud-free images available throughout the harvest season. The interpretation was reviewed by a single experienced interpreter to guarantee uniformity in the final result. Classification doubts were solved with the help of a field team from the Sugarcane Center of Technology (CTC). The analyses and evaluations of the type of harvest were made on a municipal, regional and state level. The regional analysis used the administrative regions (ADRs) from the Geographic and Mapping Institute (IGC) of S˜ao Paulo State. Each ADR is made up of several municipalities within a given geographic region that have economic and social similarities (for details, see: http://www.igc.sp.gov.br/produtos/regioes adm.html). For the analyses at the municipal and state levels, the boundaries used were from the Brazilian Geographic and Statistics Institute (IBGE; for details, see: http://www.ibge.gov.br). There are some situations in which the interpretation of the harvest type can be difficult, requiring the interpreter not only to analyze the various images obtained throughout the harvest season, but also to have some knowledge regarding the agriculture management of sugarcane production and how they interact with the appearance on remote sensing images. Figure 2 illustrates some of these situations presenting the key interpretation elements to identify the type of harvest. One management technique that can lead to confusion is the adding of lime to pre-harvest burned fields (Figure 2(2a–2c)). This procedure is used to improve the soil’s chemical characteristics and is usually done after the last ratoon harvest and prior to field renovation [1]. The reflectance of the fields that received lime (Figure 2(b)) is similar to that of green harvested fields. In this example, there was an image available right after the harvest (12 June 2010; Figure 2(2a)) and therefore the field was correctly classified; however, with the image from 30 June 2010 (Figure 2(2b)) the field would have been incorrectly classified, as GH. The magnitude of this type of misclassification is estimated to be below 1% due to the fact that a large number of images, as shown in Table 1, were used to minimize classification errors. Another management practice that makes interpretation of the type of harvest difficult is the burning of litter after GH (Figures 2(3b,3c)). This practice is aimed at promoting sugarcane sprouting in colder regions where the litter accumulation can delay or even inhibit ratoon growth. However, this practice has been replaced by layering the litter between planting rows (Figure 2(1b)). In years characterized by long dry periods, fires can accidentally occur after GH. Figure 2(3b,3c) illustrates the burning of litter after harvest. By using the image from 12 July, acquired right after harvest, that field will be correctly classified as GH, but with the image from 30 July, it will be misclassified.
Remote Sens. 2011, 3
2689
Labor legislation does not permit mechanized sugarcane harvests in fields with slopes greater than 12% due to increased risk of accidents [1,12]. Figure 2(4a) shows the harvest in a field with both classes of slope, below and above 12%. Part of the field was mechanically green harvested (the bright part of the field), but the fields with greater slope, near the drainage, were manually harvested, using BH (the dark part of the field). Another example of BH in fields with slope greater than 12% is shown in a photograph taken in the field (Figure 2(4b)). Fields with built-in terraces to form the harvest lines for the combiner to pass can be visualized in the remote sensing images obtained during the GH process due to the contrast between the high reflectance of the litter on top of the soil and the low reflectance of the non harvested sugarcane (Figure 2(5a,5b)). In these cases, the interpreter can assume that the whole field will be green harvested. In some cases, due to the use of old and less advanced combiners, BH is still required (Figure 2(6c)). Figure 2(6a) shows a mechanized harvest after BH in an image obtained in June 2010. By monitoring the harvest using remote sensing images, in addition to supporting the “Green Ethanol” Protocol, it becomes possible to quantify, at the end of each crop season, the amount of sugarcane that for some reason was not harvested. This unharvested sugarcane is the first to be harvested in the following season. 3.3.
Evaluation of the Harvest and the Relationship with the Protocol’s Directives
3.3.1. Classes of Slope The current legislation and the “Green Ethanol” Protocol provide for the extinction of BH in fields with slope >12%, therefore, in the near future sugarcane production should be limited to fields with slope ≤12%. Proof of this is the classification of fields with slope >12% as inadequate for sugarcane planting by the Sugarcane Agro-ecological Zoning proposed by the federal government’s Ministry of Agriculture, Livestock and Supply [25] and the Agro-environmental Zoning proposed by SMA [26]. To quantify the sugarcane acreage with GH and with BH by class of slope (≤12% and >12%) and the producers’ compliance with the Protocol’s directives, the harvest season maps were intersected with the slope map generated from altimetry data obtained from the Shuttle Radar Topography Mission (SRTM) [27], obtained from the TOPODATA Project (http://www.dsr.inpe.br/topodata/). The data available on the site had their spatial resolution refined, from ≈90 m to ≈30 m, through interpolation by kriging according to the methodology proposed by Valeriano et al. [28]. This processing minimized some of the effects present in the SRTM data, such as spatial randomness, artifacts originated from land cover, among others. According to Valeriano et al. [29], this is a solution to build digital elevation models (DEM) that maintain the relief representation better than the original data. 3.3.2. Green Harvest in Fields with Expansion Sugarcane and Renovated Sugarcane It is supposed that the GH can only be performed in systemized fields for mechanized harvest. Therefore, sugarcane planted after the Protocol has been established should be prepared for mechanized harvest. To evaluate whether the evolution of GH in both expansion sugarcane and renovated sugarcane fields was in fact observed, the annual harvest maps were intersected with the maps from the Canasat Project [8].
Remote Sens. 2011, 3 3.4.
2690
Rainfall and Harvest
To analyze the influence of rainfall on the harvest, the accumulated monthly rainfall was obtained from the Tropical Rainfall Measuring Mission (TRMM) for S˜ao Paulo State for crop years 2009/10 and 2010/11, product 3B43 V6 [30]. This product is made available by NASA’s Distributed Active Archive System (DAAC), covering the world between latitudes 50◦ S and 50◦ N. The size of the TRMM pixel is ≈30 × 30 km. To estimate rainfall, TRMM uses a passive radar sensor, the TRMM Microwave Imager (TMI), an active precipitation radar sensor (PR) and sensors positioned in the visible and infrared regions (VIRS) of the electromagnetic spectrum [31]. 4. 4.1.
Results and Discussion Monitoring the Type of Harvest
The visual interpretation of remote sensing images obtained between April and December in each crop year allowed quantifying the two types of sugarcane harvest—green harvest (GH) and pre-harvest burning (BH)—in S˜ao Paulo State (Figure 3). Although automated and semi-automated classifications have been reported in the literature (e.g., El Hajj et al. [32]) and some techniques have been tested [33,34], visual interpretation from skilled interpreters is still the most accurate method for mapping sugarcane and its harvest practice over large areas [6]. Accuracy figures for the maps presented in this work are not available, but the maps were elaborated by experienced interpreters. To correctly classify the sugarcane fields that were either GH or BH it is paramount to have a good set of images acquired throughout the harvested season. In all five crop years it was possible to acquire sufficient images to perform the visual interpretation (Table 1). Both CTC and SMA have their own methods to evaluate the yearly sugarcane GH progress in terms of the “Green Ethanol” Protocol, but at the end of each season both agreed on the results presented in this work, although they were all quite similar. Since the maps were obtained on a field by field basis the results are presented and discussed on a state scale, and on a municipal and regional scale. 4.1.1. State Scale Table 2 summarizes the results of the yearly sugarcane harvest monitoring in S˜ao Paulo State. Crop year 2006/07 was the one prior to the beginning of the Protocol when GH was 34.2% (Table 2). In the following crop year, when the Protocol’s directives were already in effect, this percentage significantly increased to 46.6% (Table 2). The Protocol’s impact observed during the first crop year (2007/08) was not repeated in the following years. In fact, the impact of the Protocol was more pronounced on the GH increase rather than on the reduction of the amount of BH of sugarcane. Actually, from 2006/07 to 2010/11 no major reduction in BH was observed, except for crop year 2009/10. However, during that same period the sugarcane area in S˜ao Paulo State increased by 1.5 million ha which did not cause any increase in BH, since it was entirely compensated by the increased GH.
Remote Sens. 2011, 3
Figure 3. Sugarcane map of crop year 2010/11 indicating the administrative regions of S˜ao Paulo State: Arac¸atuba (AR); Baixada Santista (BS); Barretos (BR); Bauru (BA); Campinas (CA); Central (CE); Franca (FR); Mar´ılia (MA); Presidente Prudente (PP); Registro (RE); Ribeir˜ao Preto (RP); S˜ao Jos´e do Rio Preto (SR); S˜ao Jos´e dos Campos (SC); S˜ao Paulo (SP); and Sorocaba (SO).
2691
Remote Sens. 2011, 3
2692
Table 2. Summary of the yearly sugarcane harvest monitoring in S˜ao Paulo State for: green harvest (GH); pre-harvest burning (BH); unharvested by the end of the season (UH); and total harvested (TH). Crop Year 2006/07 2007/08 2008/09 2009/10 2010/11 (a) Percentages
GH ha 1,110,121 1,767,049 1,924,076 2,234,331 2,627,023
BH (a)
%
34.2 46.6 49.1 55.5 55.6
ha 2,131,989 2,023,215 1,997,630 1,792,734 2,101,110
UH (a)
%
65.8 53.4 50.9 44.5 44.4
ha 101,878 173,534 513,190 884,229 260,953
%
(b)
3.0 4.2 11.6 18.0 5.2
TH ha 3,242,111 3,790,264 3,921,706 4,027,065 4,728,133
of GH and BH refer to TH; (b) percentages of UH refer to the total available for harvesting (UH + TH).
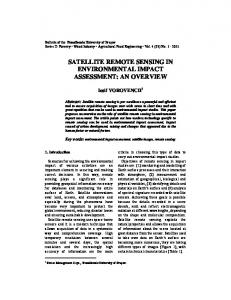
From crop years 2009/10 to 2010/11, there was an increase of 17.2% in BH which in part can be attributed to severe drought (Figure 4) and relatively low air humidity between May and August 2010. Accumulated monthly rainfall and the sugarcane area harvested monthly with BH in crop years 2009/10 and 2010/11 are shown in Figure 4. It can be observed that precipitation was almost always lower in 2010 compared with 2009 (Figure 4). Although sugarcane harvest requires a dry season [35] long drought periods precludes pre-harvest burnings that have to be performed in compliance with SMA’s Resolution 35 (see Section 2.1) mainly to prevent the noxious effects on human health that result from the burnings [2,3,5]. This indicates that the issuing of burning authorizations, inspections and preventive measures against fires in drier years should be more rigorous. Therefore, the monthly harvest maps generated from remote sensing images, together with rainfall data are an important source of information for SMA to make decisions that ensure compliance with the goals set by the Protocol. Figure 4. Sugarcane burning and accumulated monthly rainfall (TRMM) for crop years 2009/10 and 2010/11.
Remote Sens. 2011, 3
2693
Another important factor that set back the advancement to reduce BH, pointed out by Jank [36], was the 2008 global economic crisis. From 2000 to 2008, sugarcane production grew 10.3% per year in Brazil, mainly as a response to the increase in the sales of flex-fuel vehicles and to the increase in sugar prices. Starting in 2005, an average of 20 new mills was inaugurated every year and large investments were made in the modernization of agricultural machinery and in the purchase of combiners. However, with the global crisis, one-third of the sector began to experience difficulties and underwent a strong financial restructuring. Investments in modernization and purchases of machinery were reduced precluding the intensification of mechanized harvests. Thus, the economic crisis also affected the high percentages of unharvested sugarcane in crop years 2008/09 and 2009/10 (Table 2), due to an imbalance between the amount of available raw material and the production capacity for sugar and ethanol [6]. 4.1.2. Municipal and Regional Scale The percentage of green harvests at municipal and regional scale is shown in Figure 5(a). Analysis of the maps allows the identification of municipal groupings with greater adherence to the Protocol, such as the municipalities of Barretos and Ribeir˜ao Preto and its surroundings areas in the center-north of S˜ao Paulo State, where the percentage of GH is above 50% for all analyzed years. On the other hand, the municipality of Ja´u and its surroundings, as well as the municipalities located along the state’s southern boundary, presented percentages of GH below 50% in this period. The negative highlight goes to Ja´u with just 37% of GH in crop year 2010/11. These groupings are similar to those found by Novaes et al. [37] and can serve to direct municipal and state public policies towards accelerating the end of BH to meet the Protocol’s goals. In crop year 2006/07, 3.2 million ha of sugarcane were available for harvest in 430 municipalities in S˜ao Paulo State while, in crop year 2010/11, 4.7 million ha were distributed among 472 municipalities (Table 2 and Figure 5(a)), a growth of 9.7% in the number of municipalities. Some municipalities in the west and north-east of the state, such as Andradina, Nova Independˆencia, Mes´opolis and Paranapu˜a, where recent expansions in sugarcane production are concentrated [21], have rapidly adhered to the Protocol as several agro-industrial units were installed in these municipalities after the Protocol was signed and planned ahead the mechanized GH within its infrastructure. The ADR of Barretos had the largest percentage growth in sugarcane fields with GH, going from 23.1% in crop year 2006/07 to 63.9% in crop year 2010/11, an increase of 175,900 ha. The ADR of Presidente Prudente, which had the lowest percentage of GH in crop year 2006/07 (23.1%), harvested 50.2% of its sugarcane without burning in crop year 2010/11. A negative highlight goes to the ADR of Bauru, the only one that did not reach the 50% mark for GH during the evaluated period (Table 3). In the ADRs where sugarcane production is more traditional, such as Ribeir˜ao Preto, Franca and Campinas, the change in type of harvest depends in part on the systemization of current cultivated fields as, the proportion of expansion fields to renovation fields in these regions is less than one [6,21]. The percentage of GH in the ADRs of Bauru, Campinas, Central, S˜ao Jos´e do Rio Preto and Sorocaba suffered a setback in crop year 2010/11, compared to the previous crop year, in spite of the increase in GH, except for the ADR of Campinas which reduced its GH area. The percentage increase in green harvests between these two crop years in the remaining ADRs was small when compared to the other evaluated crop years.
Remote Sens. 2011, 3 Figure 5. (a) Percentage of green harvest at municipal scale; and (b) acreage available for harvest and percentage of green harvest by the ADRs of S˜ao Paulo State: Arac¸atuba (AR); Baixada Santista (BS); Barretos (BR); Bauru (BA); Campinas (CA); Central (CE); Franca (FR); Mar´ılia (MA); Presidente Prudente (PP); Registro (RE); Ribeir˜ao Preto (RP); S˜ao Jos´e do Rio Preto (SR); S˜ao Jos´e dos Campos (SC); S˜ao Paulo (SP); and Sorocaba (SO).
2694
Remote Sens. 2011, 3
2695 Table 3. Green harvested sugarcane by ADR.
ADR Aracatuba Barretos Bauru Campinas Central Franca Mar´ılia Pres. Prudente Ribeir˜ao Preto S. Jos´e R. Preto Sorocaba Total
4.2.
2006/07 ha % 87,154 33.4 62,202 23.1 97,700 31.0 159,255 40.3 116,834 36.4 113,482 29.9 69,896 28.1 34,771 21.3 150,926 38.7 154,157 44.5 63,743 41.8 1,110,121 34.2
2007/08 ha % 169,949 47.3 123,127 41.7 157,619 42.0 236,027 54.7 176,990 51.3 185,818 45.7 126,354 38.9 109,160 51.7 179,902 46.0 212,086 46.7 87,960 45.1 1,767,049 46.6
2008/09 ha % 215,526 55.4 150,567 44.8 153,923 42.5 213,560 51.7 176,047 48.6 191,944 47.0 121,615 43.1 146,162 59.9 201,959 48.9 261,571 49.9 91,201 48.4 1,924,076 49.1
2009/10 ha % 246,018 56.8 177,211 61.7 179,796 50.4 274,052 60.8 217,606 61.4 204,129 51.2 139,178 43.7 139,833 49.0 223,380 56.6 309,629 59.9 119,239 57.9 2,234,331 55.5
2010/11 ha % 304,525 58.3 238,136 63.9 208,976 47.5 257,778 53.0 245,517 60.1 237,641 54.4 204,718 54.1 184,523 50.2 249,180 57.6 373,153 57.7 122,878 52.0 2,627,023 55.6
Harvests by Class of Slope and Compliance with the Protocol’s Directives
4.2.1. State Scale The intersection of the type-of-harvest maps with the slope map showed that 4,577 thousand ha (96.9%) of the sugarcane available for harvest were in fields with slope ≤12%, while only 149 thousand ha (3.1%) were in fields with slope >12%, in crop year 2010/11 (Table 4). Although the BH area in the last crop year was of 98,126 ha, it represented only 2.1% of the total harvested area (4,726,063 ha) that according to the “Green Ethanol” Protocol has until 2017 to be gradually solved. Major attention should be given to the ≤12% slope class where 2, 002 thousand ha need to be converted from BH to GH until 2014. Table 4. Sugarcane harvest by slope at state scale. Crop Year
GH ha %(a)
2006/07 2007/08 2008/09 2009/10 2010/11
1,085,730 1,724,250 1,886,743 2,223,907 2,575,443
34.7 47.0 49.7 56.4 56.3
2006/07 2007/08 2008/09 2009/10 2010/11
23,953 41,082 36,613 47,365 50,723
22.4 33.8 30.3 37.1 34.1
(a) Percentages
BH ha %(a) ≤12% 2,047,321 65.3 1,945,119 53.0 1,912,342 50.3 1,720,323 43.6 2,001,771 43.7 >12% 83,079 77.6 80,449 66.2 84,226 69.7 80,329 62.9 98,126 65.9
TH ha
%
UH ha
3,133,051 3,669,369 3,799,085 3,944,230 4,577,214
96.7 96.8 96.9 96.9 96.9
98,507 167,687 492,665 668,693 251,220
3.0 4.4 11.5 14.5 5.2
107,033 121,531 120,839 127,695 148,849
3.3 3.2 3.1 3.1 3.1
3,318 5,796 20,115 28,065 9,565
3.0 4.6 14.3 18.0 6.0
%(b)
of GH and BH refer to TH; (b) percentages of UH refer to the total available for harvesting (TH + UH).
Remote Sens. 2011, 3
2696
4.2.2. Municipal and Regional Scale To direct public environmental incentive policies towards adherence to the Protocol and compliance with the goals established therein, the municipalities were assigned the responsibility of complying or not with the goals to anticipate the reduction of harvests with pre-harvest burnings to crop year 2010/11: (i) in slopes > 12%, at least 30% of the available sugarcane area should be green harvested; and (ii) in slopes ≤ 12%, at least 70%. This procedure will make it easier to identify the municipalities and consequently the agro-industrial units and suppliers that need more demanding actions to meet the directives established in the Protocol. Also, special attention should be given to the agro-industrial units which are responsible for 90% of the sugarcane production. Figure 6 illustrates the percentage of green harvests in relation to the total harvest in crop year 2010/11 for each municipality in the two slope classes indicating which municipalities are complying with the goals established in the Protocol. Figure 6. Percentage of green harvest in relation to total harvest by class of slope for sugarcane municipalities in S˜ao Paulo State—2010/11 crop year.
Of the 472 municipalities that produce sugarcane, only 85 (18.0%; green dots) had complied with the two goals established in the “Green Ethanol” Protocol for crop year 2010/11. Of these, the highlights are Gua´ıra and Miguel´opolis that had no pre-harvest burnings in, respectively, 85.4% (50,496 ha) and 80.8% (30,458 ha) of their harvested fields with slope ≤12%, and 42.1% (8 ha) and 47.6% (58 ha) of their harvested fields with slope >12%. Fourteen municipalities (3%; orange dots) complied only with the
Remote Sens. 2011, 3 Figure 7. Comparison of the percentage of green harvest for the ADRs of S˜ao Paulo State considering the goals of the “Green Ethanol” Protocol and Law number 11241 for slopes (a) ≤12% and (b) >12%. The ADRs are: Arac¸atuba (AR), Barretos (BR), Bauru (BA), Campinas (CA), Central (CE), Franca (FR), Mar´ılia (MA), Presidente Prudente (PP), Ribeir˜ao Preto (RP), S˜ao Jos´e do Rio Preto (SR) and Sorocaba (SO).
2697
Remote Sens. 2011, 3
2698
goal for slopes ≤12%, highlight on Pereira Barreto with no pre-harvest burnings in 75.9% (16,947 ha) of its sugarcane harvested land. A total of 213 municipalities complied only with the goal for slopes >12%, with the highlight on Guararapes and Barretos; however, this is not very relevant in terms of the impact on reducing sugarcane burning due to the small amount of sugarcane cultivated in slopes >12%. Figure 6 also shows that 312 municipalities (66%; blue, orange and green dots) complied with at least one of the Protocol’s goals and 160 municipalities (34%; black dots) failed to comply with any of the goals for crop year 2010/11, such as Morro Agudo. Therefore, special attention should also be given to the 373 municipalities that have not yet met the goal of 70% of GH for sugarcane cultivated in slope ≤12%, which is the great majority (black and blue dots in Figure 6). Figure 7 shows that from 2006 to 2010 all ADRs accomplished the goals stated by State Law number 11241; however, in terms of the goals of the “Green Ethanol” Protocol they were met only for the slope class >12%, but Central and Bauru. Figure 7(a) also shows that in 2009 all ADRs met the goal of 50% set by the “Green Ethanol” Protocol, but Mar´ılia. In 2010 this goal was set to 70% of GH for slope ≤12%. This new goal was not achieved by any ADR; however, based on the current trend of GH evolution it should be attained by 2013. Nevertheless, to achieve the final goal of the “Green Ethanol” Protocol by 2014 the annual growth rate of GH needs to significantly increase during the next four years. 4.3.
Type of Harvest for Renovated and Expanded Sugarcane
The intersection between the cultivated sugarcane maps and the harvest maps for crop years 2008/09, 2009/10 and 2010/11 made it possible to quantify the dynamics of the fields converted from BH to GH (Table 5) and from GH to BH (Table 6) after the fields were renovated with an eighteen-month sugarcane. It is important to consider that fields under renovation will skip one crop year, which means that the conversion dynamic can only be observed the year after renovation has taken place. Table 5 shows that from the total renovated fields in crop year 2008/09, i.e., fields that were BH in crop year 2006/07, only 27.2% were converted to GH. Similarly, for the renovated fields of crop years 2007/08 and 2008/09 only 33.9 and 42.1% were converted from BH to GH (Table 5). Actually a much higher percentage was expected considering that these fields were systemized for proper GH. In the opposite direction, Table 6 shows that fields that were GH prior to field renovation were BH after renovation. There should be no reason for this type of conversion, but it did occur in 41.1% of the renovated fields of crop year 2008/09, in 36.2% of the renovated fields of 2009/10, and in 31.9% of the fields renovated in 2010/11. This indicates that the conversion from BH to GH and vice versa also depends on the logistics of the agro-industrial units, and on other aspects that are outside the scope of this work (e.g., BH to reduce undesirable animals such as rats and snakes). Another interesting aspect to be considered in the BH to GH conversion is the positive balance of greenhouse gas (GHG) emissions in GH sugarcane fields [23]. Under a scenario of conventional production, the emission of these gases in fields converted to GH is, on average, for a five-year cycle, 1,480 kg CO2 eq less than in BH fields. This reduction is mainly due to the emissions avoided by the GH and to the carbon sequestration by the soil, favored by keeping the cane litter on the ground. However, when other aspects are considered such as the use of fertilizers and diesel then the GH advantage in terms of the reduction of GHG emissions is less evident. Thus, if we consider only the conversion of renovated fields with the eighteen-month sugarcane in crop years 2008/09, 2009/10 and 2010/11 to GH,
Remote Sens. 2011, 3
2699
at the end of one season, an emission of 216,800 tons of CO2 eq can be avoided. However, according to Kim et al. [38], management techniques used during field renovation also contribute to the emission of GHG causing the loss of carbon stocks in the soil with less mitigation of GHG gases, especially due to soil preparation which after some weeks can be responsible for the emission of tons of CO2 [39]. For this reason, the monitoring and management of agricultural land allocated to the production of biofuels, particularly those associated to soil preparation, will be relevant in future studies. Table 5. Renovated sugarcane converted from pre-harvest burning (BH) to green harvest (GH).
BH 2006/07 2007/08 2008/09
Renovated Sugarcane Converted from BH to GH 2008/09 2009/10 2010/11 ha % ha % ha % 40,486 27.2 51,859 33.9 53,767 42.1
The percentages were calculated in relation to the total renovated area.
Table 6. Renovated sugarcane converted from green harvest (GH) to pre-harvest burning (BH).
GH 2006/07 2007/08 2008/09
Renovated Sugarcane Converted from GH to BH 2008/09 2009/10 2010/11 ha % ha % ha % 36,331 41.1 63,711 36.2 47,783 31.9
The percentages were calculated in relation to the total renovated area.
The intersection between the harvest maps and the recent expanded sugarcane maps showed that in crop year 2009/10, 64.4% (152,321 ha) were GH while in crop year 2010/11, 62.7% (58,590 ha) were GH (Table 7). These results indicate that the adherence to the “Green Ethanol” Protocol for the recent expanded sugarcane is greater than that for the remaining sugarcane areas in S˜ao Paulo State since they are mostly from new projects that take into account the Protocol requirements. Table 7. Type of harvest for recent expanded sugarcane in crop years 2009/10 and 2010/11. Expansion 2009/10 2010/11
5.
GH ha % 152,321 64.4 58,590 62.7
BH ha % 84,332 35.6 34,826 34.3
TH ha 236,652 93,416
Conclusions
The remote sensing monitoring of the sugarcane harvest in S˜ao Paulo State, Brazil, is paramount to evaluate the effectiveness of the “Green Ethanol” Protocol in terms of its goals to gradually reduce
Remote Sens. 2011, 3
2700
pre-harvest sugarcane burning. Furthermore, it helps decision makers to establish public policies to accomplish the expected end of the pre-harvest sugarcane burning practice. During the last five crop years, sugarcane acreage was expanded by 1.5 million ha, which was compensated by a correspondent increase in the green harvested land, however, no significant reduction was observed in the amount of pre-harvest burned land. This sugarcane expansion was motivated to increase ethanol production, however, from remote sensing monitoring it is not possible to identify and map the green harvested fields designated to produce ethanol. This issue can be relevant in studies that account for gas emissions due to BH of sugarcane for ethanol production. The GH and the BH practices are unevenly distributed throughout the state’s municipalities with some of them entirely meeting the “Green Ethanol” Protocol goals while others are still far behind. Efforts to significantly reduce BH should focus on municipalities that are below the goal of 70% of GH for sugarcane cultivated in slope ≤12%, which are the great majority. Furthermore, to achieve the goal of the “Green Ethanol” Protocol by 2014 (100% of GH in slope ≤12%), the annual growth rate of GH needs to increase. Based on the current trend, this goal is likely to be achieved one or two years later (2015–2016), which will be five or six years ahead of 2021 as the goal in the State Law number 11241 states. We thus conclude that the “Green Ethanol” Protocol has been effective with a positive impact on the increase of GH, especially on recently expanded sugarcane fields. Free of cost available images from Landsat type sensors were paramount to accomplish the remote sensing monitoring of the sugarcane harvest practices due to the very large number of images required to evaluate these land cover changes. Governments should encourage the use of remote sensing images to monitor land use and land change activities by providing free of charge images from high quality sensors/satellites to the users’ community. With improved remote sensing image quality and increased image availability, coupled with an adequate data distribution policy, land use and land change monitoring activities, such as sugarcane harvest monitoring, will provide decision makers with relevant information to establish public policies. Acknowledgements Special thanks go to: The team of image interpreters from the Laboratory of Remote Sensing in Agriculture and Forestry (LAF) of the Remote Sensing Division (DSR) of INPE; Luiz Antonio Dias Paes for his valuable assistance in clarifying some of the interpretation doubts through field work; Newton La Scala Jr. and the reviewers who significantly contributed to improving the manuscript; the financial support of the Brazilian Research Council CNPq (Conselho Nacional do Desenvolvimento Cient´ıfico e Tecnol´ogico—153608/2010-2 and 142845/2011-6) and S˜ao Paulo Research Foundation FAPESP (Fundac¸a˜ o de Amparo a` Pesquisa do Estado de S˜ao Paulo—2008/56252-0). References 1. Segato, S.V.; Pinto, A.S.; Jendiroba, E.; N´obrega, J.C.M. Atualizac¸a˜ o em produc¸a˜ o de cana-de-ac¸u´ car, 1st ed.; CP2: Piracicaba, SP, Brazil, 2006; p. 415.
Remote Sens. 2011, 3
2701
2. Canc¸ado, J.E.; Saldiva, P.H.; Pereira, L.A.; Lara, L.B.; Artaxo, P.; Martinelli, L.A.; Arbex, M.A.; Zanobetti, A.; Braga, A.L. The impact of sugar cane-burning emissions on the respiratory system of children and the elderly. Environ. Health Persp. 2006, 114, 725–729. 3. Arbex, M.A.; Martins, L.C.; Oliveira, R.C.; Pereira, L.A.A.; Arbex, F.F.; Canc¸ado, J.E.D.; Saldiva, P.H.N.; Braga, A.L.F. Air pollution from biomass burning and asthma hospital admissions in a sugar cane plantation area in Brazil. J. Epidemiol. Community Health 2007, 61, 395–400. 4. Goldemberg, J.; Coelho, S.T.; Guardabassi, P. The sustainability of ethanol production from sugarcane. Energy Policy 2008, 36, 2086–2097. 5. Martinelli, L.A.; Filoso, S. Expansion of sugarcane ethanol production in Brazil: Environmental and social challenges. Ecol. Appl. 2008, 18, 885–898. 6. Rudorff, B.F.T.; Aguiar, D.A.; Silva, W.F.; Sugawara, L.M.; Adami, M.; Moreira, M.A. Studies on the rapid expansion of sugarcane for ethanol production in S˜ao Paulo State (Brazil) using Landsat data. Remote Sens. 2010, 2, 1057–1076. 7. Lucon, O.; Goldemberg, J. S˜ao Paulo—The “other” Brazil: Different pathways on climate change for State and Federal Governments. J. Environ. Develop. 2010, 19, 335–357. 8. CANASAT: Sugarcane Crop Mapping in Brazil by Earth Observing Satellite Images. Maps and Graphs; 2011. Available online: http://www.dsr.inpe.br/laf/canasat/en/map.html (accessed on 10 May 2011). 9. Abdel-Rahman, E.M.; Ahmed, F.B. The application of remote sensing techniques to sugarcane (Saccharum spp. hybrid) production: A review of the literature. Int. J. Remote Sens. 2008, 29, 3753–3767. 10. Aguiar, D.A.; Rudorff, B.F.T.; Adami, M.; Shimabukuro, Y.E. Imagens de sensoriamento remoto no monitoramento da colheita da cana-de-ac¸u´ car. Engenharia Agr´ıcola 2009, 29, 440–451. 11. UNICA: Sugarcane Industry Union. Dados e Cotac¸o˜ es—Estat´ısticas; 2011. Available online: http://www.unica.com.br/dadosCotacao/estatistica/ (accessed on 7 July 2011). 12. Segato, S.V.; Fernandes, C.; Pinto, A.S. Expans˜ao e renovac¸a˜ o de canavial, 1st ed.; CP2: Piracicaba, SP, Brazil, 2007; p. 352. 13. Lebourgeois, V.; B´egu´e, A.; Degenne, P.; Bappel, E. Improving sugarcane harvest and planting monitoring for smallholders with geospatial technology: The Reunion Island experience. Int. Sugar J. 2007, 109, 109–117. 14. B´egu´e, A.; Lebourgeois, V.; Bappel, E.; Todoroff, P.; Pellegrino, A.; Baillarin, F.; Siegmund, B. Spatio-temporal variability of sugarcane fields and recommendations for yield forecast using NDVI. Int. J. Remote Sens. 2010, 31, 5391–5407. 15. IBGE: Brazilian Institute for Geography and Statistics. Agropecu´aria—Censo Agropecu´ario; 2011. Available online: http://www.ibge.gov.br/home/estatistica/economia/agropecuaria/censoagro/ (accessed on 7 July 2011). 16. Alfonsi, R.; Pedro, M.J., Jr.; Brunini, O.; Barbieri, V. Condic¸o˜ es clim´aticas para a cana-de-ac¸u´ car. In Cana-de-ac¸u´ car: cultivo e utilizac¸a˜ o; Paranhos, S., Ed.; Fundac¸a˜ o Cargill: Campinas, SP, Brazil, 1987; pp. 42–55. 17. Cˆamara, G.; Souza, R.C.M.; Freitas, U.M.; Garrido, J. Spring: Integrating remote sensing and GIS by object-oriented data modelling. Comput. Graph. 1996, 20, 395–403.
Remote Sens. 2011, 3
2702
18. Tucker, C.; Grant, D.; Dykstra, J. NASA’s global orthorectified Landsat data set. Photogramm. Eng. Remote Sensing 2004, 70, 313–322. 19. Dai, X.; Khorram, S. The effects of image misregistration on the accuracy of remotely sensed change detection. IEEE Trans. Geosci. Remote Sens. 1998, 36, 1566–1577. 20. Aguiar, D.A.; Silva, W.F.; Rudorff, B.F.T.; Adami, M. Canasat Project: Monitoring the Sugarcane Harvest Type in the State of S˜ao Paulo, Brazil. In Proceedings of ISPRS TC VII Symposium-C-100 Years ISPRS, Vienna, Austria, 5–7 July 2010; pp. 10–15. 21. Silva, W.F.; Aguiar, D.A.; Rudorff, B.F.T.; Sugawara, L.M. Canasat Project: Monitoring of the Sugarcane Cultivation Area in South Central Brazil. In Proceedings of ISPRS TC VII Symposium-C-100 Years ISPRS, Vienna, Austria, 5–7 July 2010; pp. 535–540. 22. Galdos, M.V.; Cerri, C.C.; Cerri, C.E.P. Soil carbon stocks under burned and unburned sugarcane in Brazil. Geoderma 2009, 153, 347–352. 23. Figueiredo, E.B.; La Scala, N., Jr. Greenhouse gas balance due to the conversion of sugarcane areas from burned to green harvest in Brazil. Agric. Ecosyst. Environ. 2011, 141, 75–85. 24. Walter, A.; Dolzan, P.; Quilodr´an, O.; Garcia, J.; Silva, C.; Piacente, F.; Segerstedt, A. A Sustainability Analysis of the Brazilian Ethanol, 1st ed.; Unicamp: Campinas, SP, Brazil, 2008; p. 167. 25. Manzatto, C.; Assad, E.; Bacca, J.; Zaroni, M.; Pereira, S. Zoneamento Agroecol´ogico da cana-de-ac¸u´ car: expandir a produc¸a˜ o, preservar a vida, garantir o futuro; EMBRAPA Solos: Rio de Janeiro, RJ, Brazil, 2009; p. 58. 26. Resoluc¸a˜ o Conjunta da Secretaria do Meio Ambiente e Secretaria de Agricultura e Abastecimento. Disp˜oe sobre o Zoneamento Agroambiental para o setor sucroalcooleiro no Estado de S˜ao Paulo; Resoluc¸a˜ o Conjunta SMA-SAA-4; 2008. 27. Rabus, B.; Eineder, M.; Roth, A.; Bamler, R. The shuttle radar topography mission: A new class of digital elevation models acquired by spaceborne radar. ISPRS J. Photogramm. 2003, 57, 241–262. 28. Valeriano, M.M.; Kuplich, T.M.; Storino, M.; Amaral, B.D.; Mendes, J.N., Jr.; Lima, D.J. Modeling small watersheds in Brazilian Amazonia with shuttle radar topographic mission-90m data. Comput. Geosci. 2006, 32, 1169–1181. 29. Valeriano, M.M.; Rossetti, D.F. Topodata: Brazilian full coverage refinement of SRTM data. Appl. Geogr. 2012, 32, 300–309. 30. Huffman, G.J.; Bolvin, D.T.; Nelkin, E.J.; Wolff, D.B.; Adler, R.F.; Gu, G.; Hong, Y.; Bowman, K.P.; Stocker, E.F. The TRMM Multisatellite Precipitation Analysis (TMPA): Quasi-global, multiyear, combined-sensor precipitation estimates at fine scales. J. Hydrometeorol. 2007, 8, 38–55. 31. Kummerow, C.; Barnes, W.; Kozu, T.; Shiue, J.; Simpson, J. The Tropical Rainfall Measuring Mission (TRMM) sensor package. J. Atmos. Oceanic Technol. 1998, 15, 809–817. 32. El Hajj, M.; B´egu´e, A.; Guillaume, S.; Martin´e, J.F. Integrating SPOT-5 time series, crop growth modeling and expert knowledge for monitoring agricultural practices: The case of sugarcane harvest on Reunion Island. Remote Sens. Environ. 2009, 113, 2052–2061.
Remote Sens. 2011, 3
2703
33. Aguiar, D.A.; Rudorff, B.F.T.; Rizzi, R.; Shimabukuro, Y.E. Monitoramento da colheita da cana-de-ac¸u´ car por meio de imagens MODIS. Revista Brasileira de Cartografia 2008, 60, 375–383. 34. Mello, M.P.; Rudorff, B.F.T.; Vieira, C.A.O.; Aguiar, D.A. Classificac¸a˜ o autom´atica da colheita da cana-de-ac¸u´ car utilizando Modelo Linear de Mistura Espectral. Revista Brasileira de Cartografia 2010, 62, 181–188. 35. Aguiar, D.A.; Silva, W.F.; Feitosa, F.F.; Gonc¸alves, F.G.; Rizzi, R.; Rudorff, B.F.T. An´alise espacial da colheita da cana-de-ac¸u´ car no Estado de S˜ao Paulo: A influˆencia da precipitac¸a˜ o. In Proceedings of the 13th Brazilian Remote Sensing Symposium, Florian´opolis, SC, Brazil, 2007; pp. 2231–2238. 36. Jank, M.S. Etanol—Novo ciclo de crescimento; 2011. Available online: http://www.unica.com.br/ opiniao/show.asp?msgCode=3FAE426A-0046-4987-8CAF-C2ADDDF86BF9 (accessed on 23 July 2011). 37. Novaes, M.R.; Rudorff, B.F.T.; Almeida, C.M.; Aguiar, D.A. An´alise espacial da reduc¸a˜ o da queima na colheita da cana-de-ac¸u´ car: Perspectivas futuras ao cumprimento do protocolo agroambiental. Engenharia Agr´ıcola 2011, 31, 572–583. 38. Kim, H.; Kim, S.; Dale, B. Biofuels, land use change, and greenhouse gas emissions: Some unexplored variables. Environ. Sci. Tech. 2009, 43, 961–7. 39. La Scala, N., Jr.; Bolonhezi, D.; Pereira, G. Short-term soil CO2 emission after conventional and reduced tillage of a no-till sugar cane area in southern Brazil. Soil Till. Res. 2006, 91, 244–248. c 2011 by the authors; licensee MDPI, Basel, Switzerland. This article is an open access article
distributed under the terms and conditions of the Creative Commons Attribution license (http://creativecommons.org/licenses/by/3.0/.)