REMOTE SYSTEM OF TEMPERATURE MONITORING AND CONTROL
Remote System of Temperature Monitoring and Control doi:10.3991/ijoe.v4i4.689
M. Silva and V. Carvalho Polytechnic Institute of Cávado and Ave, Barcelos, Portugal
Abstract—This paper presents a system capable of monitoring and control remotely the temperature of a physical space. This work was part of a final year graduation of the Industrial Informatics Course at the Polytechnic Institute of Cávado and Ave. It was developed by an undergraduate student using a LabVIEW custom application with a methodology of on-off control. The local user can use a touch screen display to configure the system setpoint temperature and for overall monitoring. For remote access it can be used any device supporting LabVIEW environment. Index Terms—Remote control, On-Off control, LabVIEW.
I. INTRODUCTION Nowadays, with the emergent use of the Internet, the need of the physical presence of human operators to control and monitoring Industries processes is decreasing. In this point of view, it is of major importance to develop systems, where are applied Internet networks, as autonomous as possible. The goal of this project it monitoring and control remotely, the temperature of a scale model classroom with reduced dimensions (36cm of width, 34cm of length, and 31cm of height) enabling a high portability and autonomy. It is designed for a resistive temperature sensor with a positive temperature coefficient (PTC) [1, 2]; the control is performed by a personal computer (PC) [3] with custom software developed in LabVIEW 8.2 [4] using actuators for cooling [5] and warming. It integrates a webcam [6] to observe the activity inside the classroom, as well as the possibility of simulating a temperature disturbance. II. DEVELOPED PROJECT In this section it is presented the hardware and software developed in the project. A.
Hardware The inner workings of the designed prototype are based on the block diagram presented in Fig. 1. Sensor (PT100)
Wheastone Bridge
Setpoint
ADC (MAX187)
Controller (PC)
Instrumentation Amplifier
RPT100 = R0(1 + a1T - a2T2) for T ≥ 0ºC
(1)
where, R0 = 100 Ω; a1 = 3.90802 x 10⁻³ ºC-1; a2 = 0.5802 x 10⁻⁶ ºC-1; T = temperature ºC. The system is designed for a maximum temperature of 50ºC, for which through Equation (1) results in a RPT100 of 119.4Ω. Equation (2) defines the system sensibility (S (V/ºC)). S = ∆V / ∆T
(2)
where, ∆V = Voltage variation (V); ∆T = Temperature variation (ºC). For an input voltage of +5V in the Wheatstone bridge, it is obtained through eq.(2) a sensibility of 1.6mV/ºC, considering ∆V = 78mV and ∆T = 50ºC. Subsequently, to amplify the low voltage differences obtained in the Wheatstone bridge arms, it was necessary to apply an instrumentation amplifier (AI). The AI design is based on three UA741[8] operational amplifiers, where to obtain an output of +5V for the maximum temperature value (50ºC), it was required a gain of 64.1. The gain (A) of the instrumentation amplifier is defined by Equation (3). A = 1 + 2 R / Rg
(3)
where, Rg = Gain resistance (Ω); R = Other schema resistances (Ω). Actuators
Figure 1. Block diagram of the project
60
The platinum resistance temperature sensor (PT100 in Fig. 1) presents a value of 100Ω at 0ºC of temperature. This sensor is then integrated in a Wheatstone bridge, allowing obtaining a proportional voltage variation with the temperature variation [7]. The bridge is balanced for 0ºC using 1kΩ and 100Ω resistors. However, as these resistors have deviations (± 5% tolerances), it was introduced a 1kΩ trimmer in order to compensate the bridge arms unbalances verified for 0ºC. The sensor response function (RPT100 (Ω)) is shown in Equation (1).
In Equation (3), considering R equal to 1 kΩ and A equal to 64.1, the gain resistance (Rg) is 31.69Ω.
http://www.i-joe.org
REMOTE SYSTEM OF TEMPERATURE MONITORING AND CONTROL Afterwards, to establish an interface with the PC based in the Standard Parallel Port(SPP) [9], the output of the AI was connected to a 12-bit analogic to digital converter (ADC) (MAX187 [10]). The parallel port pins used to control the ADC were from address 0x378, where pin 2 controls the ADC shutdown (SHDN), pin 3 the ADC chip select (CS) and pin 4 the ADC clock (SCLK); the output of the ADC was connected to address 0x379 considering pin 10. As heating actuators were used halogen lamps of +12V with 20W of power and, as cooling actuators were used two FK-180SH motors of +6V from Mabuchi[4]. The interface between the SPP [9] and the actuators was established by a +5V low profile relay (TQ2-5V) from NAIS [11], which was associated to a driver circuit through transistor P2222 [12]. Moreover, it was considered the possibility of disturbing the controlled temperature through the opening of a door in the scale model. This is carried out by pin 1 of address 0x37A, whose output is applied in a +3V motor (RC-260RA/SA) from Mabuchi [13], using has the control actuators, a relay and a driver circuit from the same type. Fig. 2 presents a photograph of the developed prototype.
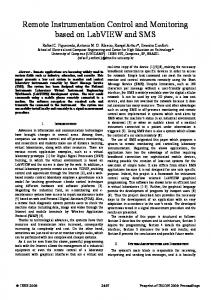
To access the SPP, the development tool integrates a specific function (I/O VI) [4]. The on-off control methodology [14, 15] is established according to the setpoint value configured by the user. The monitoring can be preformed locally through a 7’’ touch screen (Fig. 2) display from Lilliput [16]. To allow remote access it was used the Web Publishing Tool [4], generating a web server with an HTML page, where any device that suports LabVIEW can access using the Internet. Fig. 4 shows the developed application interface.
Figure 4. Application interface [1- Disturbance (door) activation button, 2- Setpoint adjustment, 3- Classroom temperature (ºC), 4- Input voltage over time (V), 5- Temperature over time (ºC), 6- Webcam display]
The inputs of the application are the disturbance activation button and the setpoint adjustment (Fig. 4); the outputs are the webcam display, the actual and over time temperature values and the input voltage value over time (Fig. 4). In order to obtain the acquisition image of the webcam it was used the LabVIEW Logitech UWA software [4].
Figure 2. Final look of the scale model [1- Heating actuators, 2Cooling actuators, 3- Touch screen display, 4- Disturbance (door)]
B.
Software The system software was developed in LabVIEW 8.2 [4] (graphical programming). Fig. 3 presents the high level diagram of the software designed.
User
Interface Routines Monitoring/Control
III. CONCLUSION AND FUTURE WORK The system was a final year graduation project developed by a student of the Industrial Informatics Course of the Polytechnic Institute of Cávado and Ave. During the project implementation, the student built the system using, a platinum resistance as a temperature sensor, a PC (on-off controller) and the SPP communication protocol, developing also a LabVIEW application interface. The system is available with either local or remote control configurations for teaching/learning purposes, where students can physically test the on-off control methodology in order to verify the system performance. It was observed the ability to control the scale model classroom temperature between the environment temperature and the maximum temperature (50ºC). Several workshops in schools specialized in the Electronics and Informatics areas were already made, being noticed the high interest of the students. For future work, it is intended applying to the system, a proportional-integral-derivative (PID) control methodology [14, 15] integrated in a microcontroller, eliminating the necessity of the computer, increasing the system portability and reducing the final cost.
Figure 3. High level diagram of the software
iJOE – Volume 4, Issue 4, November 2008
61
REMOTE SYSTEM OF TEMPERATURE MONITORING AND CONTROL ACKNOWLEDGMENT To the 6th edition of “Ciência Viva – Ensino Experimental das Ciências na Escola»”, the Dept. of Industrial Electronics from University of Minho, and to Universal Rádio, Mendes Caldas and Abreu. REFERENCES [1]
http://us.100y.com.tw/pdf_file/CRZ-1632-100.pdf (access in October 2008). [2] Pires, J. N., Industrial Automation, LIDEL, Lisbon, 2007. [3] http://eu.shuttle.com/pt/desktopdefault.aspx/tabid-546/169_read433/ (access in October 2008). [4] www.ni.com (access in October 2008). [5] http://www.mabuchimotor.co.jp/en_US/cat_files/fk_180sh.pdf (access in October 2008). [6] Logitech Webcam QuickCam Pro 3000 at www.logitech.com (access in October 2008). [7] Silva, M. M., Introduction to Electronic and Electric Circuits, Calouste Gulbenkian Foundation, Lisbon, 2006. [8] http://www.st.com/stonline/products/literature/ds/5304.pdf (access in October 2008). [9] http://www.beyondlogic.org/spp/parallel.pdf (access in July 2008). [10] http://datasheets.maxim-ic.com/en/ds/MAX187.pdf MAX189.pdf (access in October 2008).
62
[11] http://www.mew.co.jp/ac/e_download/control/relay/signal/catalog/ mech_eng_tq.pdf (access in October 2008). [12] http://doc.chipfind.ru/pdf/usha/p2222.pdf (access in October 2008). [13] http://www.mabuchimotor.co.jp/ja_JP/cat_files/rc_260rasa.pdf (access in October 2008). [14] Ogata, K., Modern Control Engineering, Prentice-Hall, New York, 2001. [15] Ogata, K., System Dynamics, Prentice-Hall International Editions, 1992. [16] http://www.lilliput.cn/619GL-70NP.html (access in October 2008).
AUTHORS M. Silva is with the Polytechnic Institute of Cávado and Ave, School of Technology, Dept. Industrial Informatics, 4750-117 Barcelos, Portugal (e-mail:
[email protected]). V. Carvalho is with the Polytechnic Institute of Cávado and Ave, School of Technology, Dept. Industrial Informatics, 4750-117 Barcelos, Portugal (e-mail:
[email protected]). Manuscript received 10 October 2008. Published as submitted by the authors.
http://www.i-joe.org