some reports, you need to get a third party application to get the data out the way ... http://www.salesforce.com/us/dev
The wisdom of a Sherpa. The reward of your practice.
DatabaseSherpa.com
Reporting Tips & Tricks for Nonprofits Using Salesforce Once you get your data into Salesforce, you’ll want to get that data back out of your database in a format you wanted. This is reporting, and often reporting isn’t as easy as we think it will be. Not because it’s impossible, but often, you didn’t think about the report you wanted before you created your database. This isn’t uncommon. We often think about the reports we want after we learn how the database works. However, there are many ways you can get data out of Salesforce using the reporting tool that comes with Salesforce. Some reports, you’ll need to do some work to your data to get the data out as you wish, and some reports, you need to get a third party application to get the data out the way you want.
Here we’ll share a few tips and tricks to help you with reporting:
)
Filtering Reports
Let’s say you want to create a report that shows only individuals who have given 100 or more for last month and this month. A filter like this will give you the details of who gave what, and when they gave. It’ll look something like this:
Filters allow you to see data in a different way, really honing in on specific individuals you would want to connect with.
Learn more Here is a great resource to help you understand more that can be done with filtering in reports, like focusing on the blank values: https://help.salesforce.com/HTViewHelpDoc?id=reports_builder_filtering.htm&language=en_US.
)
Summary Reports
With these types of reports you can summarize the data by a specific field. For example, perhaps you want to see the donations given during a specific time period (data filter) and to see how much was given by a specific designation (field on the opportunity). This data can then be summarized and totaled. Summary reports are not meant to be used to show the details, they are to show the summary of the data. Often, organization want to use a summary report to show details (like addresses, email addresses, phone numbers, etc), but that’s not the point of the summary report. These types of reports are more challenging to create, and often the out of the box reporting isn’t going to provide what you need.
)
Matrix Reports
While summary reports will show data by one column, what if we wanted to see the data by another? So, we want to see the designation, and by month. This is where the Matrix report type will come into play. Now we could convert the summary report to include the month/year by designation, but it’s a little challenging to compare month to month in this view:
There is another way to compare: the matrix report allows you to have a column summary and row summary. So, the report can look like this:
Now we can see the month and the designation. Look to see some interesting information with this data.
Learn more Here is a great resource to help with matrix reports: http://www.salesforce.com/us/developer/docs/fundamentals/index_Left.htm#CSHID=adg_reports_formats.htm|StartTopic=Content%2Fadg_reports_formats.htm|SkinName=webhelp Here is a helpful video to help create a matrix report: http://www.salesforce.com/_app/video/chatter/help/matrix_reports.jsp
)
Cross Filters
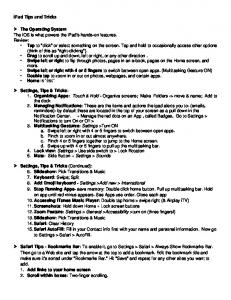
Cross filters are another type of filter, as mentioned above, but it allows you to filter by a related object related to the report type you selected. For example, you might want to see all the donors who gave to the 2014 Spring Appeal. Perhaps you want to create a 2015 Spring Appeal letter to those who gave in the 2013 Spring Appeal. You can do this with a Cross Filter. This is a simple list of donors who gave at least once during the last year:
Click the Customize button and let’s look at the cross filter. From the preview pane, click the Add button (click on the arrow, not the button itself) and you’ll see this drop down:
Pick Cross Filter and then we can look at those donors who gave to the 2014 Spring Appeal. When you pick the Cross filter, you can pick the object you wish to work with—in this case, Contacts. We’re looking for Contacts who donated to the 2014 Spring Appeal, or in other words those who have opportunities with the primary campaign source of 2014 Spring Appeal.
Our list is shorted to 9 donors:
We can focus on these donors, even create a separate campaign for just them and do a calling campaign to target them for the 2015 Spring Appeal, knowing that they were past donors.
Learn more Here is a great resource to help with cross filters: https://help.salesforce.com/HTViewHelpDoc?id=reports_cross_filters_create.htm&lang Here is a helpful video to help with cross filters: http://www.salesforce.com/_app/video/reports/help/cross_filters.jsp The more you understand how your Salesforce database works, the more likely you will find effective ways to use your data. Reporting tools like filtering reports, summary reports, matrix reports, and cross filters can help you uncover gems and information in your data that you might not normally glean by looking at the data individually.
Database Sherpa
Salesforce Training and Consulting for Nonprofit Organizations
DatabaseSherpa.com
At Database Sherpa, we are more guide than taskmaster, more teacher than consultant. We have met organizations at every point in their trek to database clarity. We know that treating the design and development of your Salesforce database as a journey, and collaborating with an experienced guide, can be transformational for your organization. The wisdom of a Sherpa. The reward of your practice.