The responses of such models to speech, or speech-like analogues, ... This is accompanied by enhanced discrimination of stimulus ... consisting of the computational auditory model feeding an artificial neural network (ANN) ...... nature of the representations, the perceptron type of feedforward net lacks any real generative.
Dept. for Speech, Music and Hearing
Quarterly Progress and Status Report
Representation of initial stop consonants in a computational model of the dorsal cochlear nucleus Damper, R. and Pont, M. and Elenius, K. O. E.
journal: volume: number: year: pages:
STL-QPSR 31 4 1990 007-041
http://www.speech.kth.se/qpsr
STL-QPSR 411990
late this intervention. Analysis of the responses of s ~ ~ cmodels h to relevant stimuli could thereby offer a uniquely powerful way of relating neurobiological data to observed behaviour. Computer models of peripheral processing which transform acoustic inputs to a pattern of presumed neural activity in the auditory nerve (AN) have been extensively studied (see Carlson and Granstrom, 1982). The responses of such models to speech, or speech-like analogues, have figured prominently in this work and the obtained neural-activity patterns (or neurograms) have been usefully interpreted by speech scientists as 'auditory spectrograms'. While the motivation behind modelling work has often been scientific, to explore the implications for audition of known peripheral mechanisms (e.g. Lyon and Dyer, 1986; Shamn~a,1987; Deng, Geisler and Greenberg, 1988), there is also much interest in improving the representations of speech signals used in technological applications such as automatic recognition and voice coding (e.g. Hunt and Lefkbvre, 1986; Ghitza, 1986; Cooke, 1986). However, there is an accumulating wealth of biological data on the structure and function of the cochlear nucleus (CN). The CN is the first brain-stem auditory nucleus and all AN fibres terminate here. This store of anatomical and physiological knowledge, together with ever increasing accessibility to the required computer power, now makes it possible to proceed beyond the periphery and consider the cochlear nucleus in constructing new auditory models. In so doing, we can hope to increase the explanatory power of our models. It has long been a goal of speech science to identify the specific acoustic and auditory features from which phonetic percepts are assembled. Our purpose in here is to explore possible relations between certain speech sounds, the auditory representations of these sounds, and known details of their perception. The auditory representations are inferred from a computational model of low-level neural processing which includes explicit details of dorsal and function, based on recent anatomical and physiological cochlear nucleus (DCN) struct~~re findings. Clearly, there itre limits to what the study of low-level neural processes can reveal concerning speech perception, so that the particular stinluli to be studied must be carefully chosen. We have chosen to focus on the synthetic stop-consonant/vowel (CV) syllables, varying uniformly in voice-onset time (VOT), which were developed by Abramson and Lisker (1970). This is a natural choice: voicing plays a vital distinctive (phonemic) r61e in the vast majority of the world's languages. Consequently, psychophysical responses to such stimuli have been extensively studied, both with human and non-human listeners, and the representation of these stimuli in the auditory nerve of experimental animals has also been investigated to some extent. Further, there are several reasons to suppose that important aspects of VOT processing may be localised to a low level of the auditory system. Various studies over many years have shown that, under appropriate experimental conditions, psychophysical responses to stimuli from the VOT continuum are in some sense categorical, i.e. as VOT varies (uniformly) in equal steps, perception of the initial stop by native English speakers changes abruptly (non-uniformly) from voiced to voiceless (e.g. from /ba/ to /pa/) at some boundary value. This is accompanied by enhanced discrimination of stimulus pairs drawn from different categories (voiced or voiceless), and which consequently straddle the boundary, relative to stimulus pairs drawn from the same category. Numerous theories have been advanced to explain such categorical perception (CP) of the VOT continuum (and other speech stimuli), including the idea that non-linertrities in auditory sensitivity could lead to the observed non-monotonic sensitivity (e.g. Stevens, 1975; 1981). Computational modelling of low-level auditory processing offers a likely way of identifying such non-linearities and assessing their possible contribution to categorical perception. This report is structured as follows. We start (Section 2) with some preliminary facts about cochlear nucleus structure and function which are important to an understanding of our computational model. This model, fully described in Pont (1990) and in Pont and Damper (1991), is then oiitlined in Section 3. It sin~ulatesafferent processing up to the level of the dorsal
STL-QPSR 411990
cochlear nucleus, transforming acoustic input into patterns of activity in the auditory nerve and dorsal acoustic stria (DAS). It has been shown previously to reproduce well the observed physiological responses to tones and to noise stimuli. We next review (Section 4) what is known about the perception of the Abramson and Lisker VOT continuum by human and animal listeners, and outline current understanding of the processing of VOT by the auditory periphery. Section 5 details the responses of the model to the synthetic speech tokens, describing the patterns of simulated neural activity at the AN and DAS. Analysis of these patterns, by which we hope to reveal possible important features of the representation of stop consonants at the two levels, is considered next (Section 6). We show that a composite model, consisting of the computational auditory model feeding an artificial neural network (ANN) trained by back-propagation, is able to reproduce the non-uniform identification and nonmonotonic discrimination behaviour of listeners with these stimuli. Section 7 discusses the in~plicationsof our findings for the understanding of VOT perception, before summarising in Section 8. 2
THE COCHLEAR NUCLEUS: SALIENT FACTS
We outline very briefly here some of the salient facts of cochlear nucleus structure and function which have impacted on the design of the computational model. Much of what is known comes from work in the cat. 2.1
Divisions of the Cochlear Nucleus
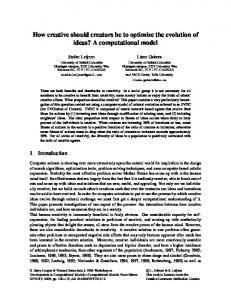
Fig. I .
Sagittal section of the cochlear nucleus in cat showing the three major divisions. AVCN: anteroventral cochlear nucleus; PVCN: posteroventral cochlear nucleus; DCN: dorsal cochlear nucleus. From Pickles (1988):. With permission of author and publisher.
On entering the cochlear nucleus, each fibre of the auditory nerve branches, with one branch going rostrally and the other caudally (Fig. 1). As one might expect, the tonotopic organisation of the AN is reflected in tonotopically-organised divisions of the CN. However, there are three such divisions, rather than just two corresponding to the two AN branches. The rostra1 branch innervates the anteroventral cochlear nucleus (AVCN) while the caudal branch innervates both the posteroventral division (PVCN) and the dorsal cochlear nucleus (DCN). In higher animals, the DCN is rather small in comparison with the two divisions of
STL-QPSR 411990
the ventral cochlear nucleus (VCN), especially in man. It is the only division of the CN which has been shown to contain a significant number of interneurons. The three divisions are composed of cells with different response properties. This is widely hypothesised to imply different functions for each. According to Pickles (1988), neurons of the AVCN ". . . have properties rather similar to those of auditory nerve fibres, and may well function much as a simple relay for afferent information." However, cells of the DCN ". . . have very much more complex response properties, and may therefore contribute to complex signal analysis." Finally, PVCN neurons have response properties generally intermediate between those of the AVCN and the DVCN. Largely because of its presumed r6le in information processing, and given our interest in the representation of particular speech-like sounds, we have chosen to concentrate on modelling the DCN. 2.2 Structure of the DCN
The DCN of cat has a laminar structure, although this is less discernible in primates. There is an outer (or molecular) layer, a granule layer and a deep (or central) region. Cells of the cochlear nucleus, including the DCN, have been usefully characterised by their morphological appearance (Osen, 1969; Brawer, Morest and Kane, 1974). The granule layer contains conspicuous, large cells with double processes, one oriented towards the surface and the other oriented inwards, and called the fuiform (or pyramidal) cells. The other large cells of the DCN -the so-called giant cells -are found in number in the central layer. There are several varieties of small cell, including the granule cells which are found in all layers but largely in the granule layer. Some of these are inhibitory interneurons with short axons, forming connections with the fusiform cells, the granule cells and with each other (Hackney, 1987). The fusiform cells are the main projection neurons of the DCN; their axons form the dorsal acoustic stria (DAS). These DCN neurons project more centrally than do the VCN cells, again suggesting participation in the processing of complex signals. The DAS fibres bypass the superior olive to terminate at the inferior colliculus and lateral lemniscus, whereas the output neurons from the VCN end mainly at the superior olive. 2.3 Response Types
In order to construct computer models of neural circuitry in the cochlear nucleus, we need to know the response properties of the various cells involved. Two particular schemes are in widespread use for describing and classifying responses to stimulation. The first (e.g. Pfeiffer, 1966) is a temporal description based on the appearance of post-stimulus time histograms (PSTHs) when stimulated by tone bursts at best frequency (BF). The second (e.g. Evans and Nelson, 1973; Young and Brownell, 1976; Young and Voigt, 1982) is in terms of response maps showing the areas in which discharge rates decrease or increase with stimulation, relative to some criterion level, as a function of stimulus frequency and intensity. This is sometimes referred to as depicting the receptive field of the neuron. The classification generally considers discharge rate versus sound level functions in conjunction with the response maps. Temporal responses are conventionally divided into primary-like, onset, chopper, pauser and build-up according to the detailed shape of the PSTH. A problem for this classification scheme is that the same cell can display different sorts of PSTH under different conditions (Young, 1985). Frequency responses are often classified as types I through V, although there is currently a tendency to collapse the number of distinct categories recognised (Young, per-
STL-QPSR 4/1990
sonal communication). For our purposes, the important distinction is between type I1 units', which do not exhibit spontaneous firing and have an excitatory response in the BF region, and type IV units, which are spontaneously active and for which inhibition dominates the BF region. There is no general correspondence between temporal and frequency response characteristics. For instance, Shofner and Young (1985) found that type I1 units "show a variety of discharge patterns in response to short tone bursts at BF". Also, it is difficult to obtain simple and direct relations between the various response types and morphological cell categories. However, painstaking experimentation has suggested some useful correspondences. Young (1980) obtained evidence in the cat from antidromal stimulation that units of response type IV formed the vast majority of projection neurons constituting the DAS. Thus, type IV responses are likely to be associated with fusiform cells. Almost no type I1 units could be antidromically stimulated from the DAS implying that these responses are recorded from the deep layer probably from interneurons. Type I1 and IV units close in BF are known to exhibit complementary activity, an effect which has been studied by cross correlation. According to Young (1980): "The consistent occurrence of inhibitory troughs in DCN type I1 and type IV units' cross correlograms supports the idea that type I1 units are inhibitory interneurons terminating on type IV units". Subsequently, Shofner and Young (1985) further subdivided the type IV category into two, based on PSTHs, which they called onset-inhibitory (ON-I) and onset-offset (ON-OFF). The ON-I responses were associated with fusiform cells and the ON-OFF responses with giant cells in the deep layer. Rhode and Smith (1986) found that units with ON-I responses were usually found in the fusifom~cell (granule) layer. In the human DCN, there are very few giant cells (Moore, 1987); the most numerous cells are medium elongate neurons, believed to be homologous to fusiform cells (Moore, 1986). For modelling purposes, therefore, we assume that the projection neurons forming the human DAS are of type IV in their frequency response and ON-I in their temporal responses. We further assume that any inhibitory interneurons influencing them will be type I1 units of similar BF. 2.4 Interconnections
While much remains to be learned about the interconnection of the various response types in the DCN, we felt that sufficient was known to make computer modelling of (at least some aspects of) cochlear nucleus function a worthwhile enterprise. A recurring theme in the literature (see Section 2.3 above) is the strong evidence for a local circuit within the DCN in which small cells of response type I1 act as inhibitory interneurons terminating on fusiform cells of response type IV (Kane, 1974; Young and Brownell, 1976; Voigt and Young, 1980; Manis and Brownell, 1983; Cant and Morest, 1985). Fig. 2 shows the local circuit proposed by Manis and Brownell on the basis of evidence for the following three separate sources of synaptic input to fusiform (pyramidal) cells: - a direct mono-synaptic, excitatory input from the AN; - a longer-latency excitatory input of unknown origin; - a di-synaptic inhibitory input. As will be seen, this proposed wiring diagram has strongly influenced the design of our computer model.
Young (1985) draws a careful differentiation between the term "unit", which refers to thc rcsponsc activity of a neuron, and the "cell" or "neuron" itself. This distinction appcars necessary because there is no guarantee that a particular ccll will always produce the same lypc of response.
A
Loyar
I
2
0
3
I
I I I
I I I
I I I
'?
Fig. 2.
Vlll
Local DCN neuronal circuit proposed by Manis and Brownell (1983) as consistent with their experimental observations. With permission of authors and publisher.
2.5 Inter-Species Differences
There are considerable morphological differences in the DCNs of different mammalian species. Clearly, this fact must be borne in mind when trying to construct a model applicable to aspects of human speech processing using data from animal studies. However, as detailed in Section 4.2 below, important commonalities have been demonstrated in the psychophysical responses of human and animal listeners to the Abramson and Lisker stimuli (e.g. Kuhl and Miller, 1975; 1978). Such commonality of behaviour across species strongly suggests a basis in structural similarities in their auditory systems. According to Moore (1986), the DCN projection neurons forming the DAS are "striking in their structural similarity across species". Thus, although the present model is based principally on data derived from the cat, it is likely that its responses accurately reflect those of the human DAS. THE COMPUTATIONAL MODEL Ours was the first auditory model to include comprehensive details of cochlear nucleus function. Since the model is fully described in Pont (1990) and in Pont and Damper (1991), only a brief description will be given here. Full software listings appear in Pont and Damper (1989). By "comprehensive" above, we mean that the model includes a large enough number of neurons that we can reasonably simulate responses across frequency. As long ago as 1984, a simple computational model of type Illtype IV interactions was described (Voigt and McMullen, 1984; McMullen and Voigt, 1984) and subsequent extensions are detailed by Voigt and Davis (forthcoming). Even the latest version, however, is restricted to 50 cells and is intended to model an isofrequency patch of the DCN. 3
STL-QPSR 411 990
3.1 Macrostructure
The model consists of two separable stages simulating afferent activity in: - the cochlea and auditory nerve; - the dorsal cochlear nucleus. Input stimuli were pre-processed using the cochlear filterbank described by Hukin (1988) before application to the model. The filterbank consists of a user-defined number (128 in this work) of finite impulse response (FIR) filters designed to mimic the physiological tuning curves of cat AN data, with frequency rescaling appropriate to the human auditory system. After filtering has been performed, mechanical-to-neural transduction, logarithmic compression and two-tone suppression are modelled phenomenologically in the cochlear stage.
Fig. 3.
Schematic of the computational model. From Pont and Damper (1991)
STL-QPSR 411 990
rate at which the driven response will saturate are given by SATURATION -LEVEL and SATURATION RATE respectively. The DCN units in Rows 2 - 4 have 6 parameters, viz: - SPONTANEOUS - THRESHOLD - FIRING PROB -DECAY- RESET - DELAY SPONTANEOUS and THRESHOLD are as described for the HCIAN unit, while FIRING PROB represents the probability of generating a spike when the transmembrane potentialis above threshold. DECAY is the factor which multiplies the previous transmembrane potential when calculating the present va1u.e. RESET is the factor by which the potential is reduced after generation of a spike; this models after-hyperpolarisation. Finally, DELAY simul:ites synaptic delay and is usually set at 0.8 nis (see Manis and Brownell, 1983, p. 1171). After defining the basic structure of the model, its parameters were 'fine tuned' in an artempt to align the spontaneous activity and driven responses to tones and noise of its units as closely as possible to those reported in recent physiological studies (see Pont and Damper, 1991, for details). This fine adjustment was constrained such that all units in any particular row had identical parameter values. Even so, the extent of free variability in the model was considerable; consequently, the adjustment process was extremely time-consuming. Because of the good correspondence between responses of the model's units and physiological observations, we believe we can place a high degree of confidence in its predictions when subjected to more complex inputs, such as the VOT stimuli studied here3. When considering the model's responses to these stimuli (see Section s), however, it is as well to bear in mind the more important limitations of the model. The individual components are extremely simple 'point' neurons, with their number limited by computer run time. We simulate effectively just one local circuit in the DCN, albeit one we believe to be important to auditory information processing. A homogeneous population of units is assumed for each row o f the iiiodel. I n the absence of adequate neurobiological data, sources of inhibition outside the IICN and efferent processing are not simulated, nor are the local excitatory connections onto the fusi1i)rm cells (the presumed Type IV units of Row 4) sometimes mentioned in the literature".
This position has been vigorously challenged. For instance, one anonymous referee called it a "massive leap". However, as wc point out in thc Introduction, there is a long tradition of employing computational models to study prcsumed auditory representations of speech and speech-like signals. As the focus of intercst in modelling shifts from auditory nerve to cochlear nuclcus, the indications are strong that conccrn with the rcprcsentation of speech signals is being maintained. To the extent that we limit our concern initially to the Abramson and Lisker VOT stimuli (not thc whole of speech!), that these are in any event simplified speech analogues, that useful physiological data exist on the representation of these stimuli at AN level, that our model produces realistic oulputs in response lo lonal and noise stimuli from which the VOT stimuli are (in principle) constructed, and that we arc continuing a well-established tradition, we believe our approach is justified. For instance, Young (1985, p. 447) states: "It seems likely that granule cells form excitatory connections on lusifom cells ... ".
STL-QPSR 411990
gestures which produce them, whereas vowel production, and thereby perception, is more 'continuous'. A major challenge to the notion of speech-specific mechanisms comes from the demonstration of CP for a non-speech continuum (Pisoni, 1977). Further strong counter-evidence is obtained from behavioural studies with animals, who obviously lack the human listeners' speech decoding abilities. Kuhl and Miller (1975; 1978) showed that chinchillas exhibited identification (labelling) functions with VOT boundaries not significantly different from human subjects, although the functions at the boundary were less steep. Fig. 4 depicts the mean identification functions for human and chinchilla subjects; note especially the shift in phonetic boundary with place of articulation. Going from bilabial through alveolar to velar, the boundary shifts from 26.8 through 35.2 to 42.3 ms for the humans, and from 23.3 through 33.3 to 42.5 ms for the chinchilla.
100
-
I
I
I
1
I
I
I
11-1
I
I
Chinchillas
-
\
2 sod
-
@
-
\
60-
-
W
m
.,.> . .. ......I . . .. .i ... .... . ...:.Y . .. .-..- ,.>. ...::i..:...>. ... ..-, : . .... -.... .... ..-. ... ....... . . . .. -. . ., . . . . . .. . . .:.: . .,..: . . ... . :.. . . . I..':-.:..:... . 7 ..~: .:.?.: -- -...- , ........ . : 1 : . : . ,:.,,,.. .... . -. : -.., -. .. . . . ......., . . . . . . ",. . .... ....... . ".' i.,: _ --.................................. . ..:.....'*. ;*=~*=~,~f:~~-*~f :- ".tyz.%..%s ....................... . ,:.:. : .., .~-.-~::::::::~:::..:y.:..y:~..=::-.:.::.. ::::, . . . ?,...:..:. ...... - . ... . .... _. .. . _ :;:5.. i . : . ? i : , . . ~ t \ % . < t . ' F ? + . ; r . . : ~ ? ; ? ~ .......; _............................ .... ._. .................................. . . . ....... . . . . . . .. ..........&. ............. y :.,.".";-; ;'~';- ..-;,':.'~-.-~-.~~.; .:;._. . ......... .-..
100
.. ...................... . .. .. .. _. . :.! ,-. . ulr.i.m.a..rz .'.... :... ..........&.... . .>.:.:..;> . ?.$m-?gp:W= .. +....? ..... -a==-. ,'.e;:.v*.d--?z< . :.., ............... ,. = : A = * .! * ; : . * . :-;p5-=&:3;:-g:F.,s 5:: .I=, (ii.iim.-. a.s r - ~ . w B . ~ d : - G W . = ~. ~.~~L . . :. .,...;!,.7;:;;., Li. ,.... ...... . ,......... -=,A,%.-. ,::+::::s:- . . ...,..::..;.:,:. .,,,> -.-.-.------.-----..-... .. ,. I.'.' .:.,' '&:.--=-*+:.~~-&rs:-:.$.:2.:>:;:
.....-
:.I
.8;.
.--?~iii:%-i,i .:ii:i; . i-.:,
'"
;
. . . . . ',.:-?, ii:k.;. ,.:.A M ~ L ~ ~ : ~ < \ M ~ ~ ~ - ~ ~ - , \ ~ ~ : ,: ~:.:;:; . . . . ....... -. ..... ,- -. . . .. . . . . . .. . . ...: