The experiments are performed on stop consonants extracted from the ... extraction and stop classification block. .... 'X' denotes a âdon't careâ, since a flap could.
ROBUST CLASSIFICATION OF STOP CONSONANTS USING AUDITORY-BASED SPEECH PROCESSING Ahmed M. Abdelatty Ali (1)(2), Jan Van der Spiegel (2) and Paul Mueller (3) (1)
Texas Instruments, Inc., Warren, NJ 07059, (2) Department of Electrical Engineering, University of Pennsylvania, Philadelphia, PA 19104, and (3) Corticon, Inc., 155 Hughes Rd, King of Prussia, PA 19406, USA.
In this work, a feature-based system for the automatic classification of stop consonants, in speaker independent continuous speech, is reported. The system uses a new auditorybased speech processing front-end that is based on the biologically rooted property of average localized synchrony detection (ALSD). It incorporates new algorithms for the extraction and manipulation of the acoustic-phonetic features that proved, statistically, to be rich in their information content. The experiments are performed on stop consonants extracted from the TIMIT database with additive white Gaussian noise at various signal-to-noise ratios. The obtained classification accuracy compares favorably with previous work. The results also showed a consistent improvement of 3% in the place detection over the Generalized Synchrony Detector (GSD) system under identical circumstances on clean and noisy speech. This illustrates the superior ability of the ALSD to suppress the spurious peaks and produce a consistent and robust formant (peak) representation.
1. INTRODUCTION Despite the long history of research on the acoustic characteristics of stop consonants, current state-of-the-art automatic speech recognition (ASR) systems are still incapable of performing accurate fine phoneme distinctions for this class of sounds (and for some other classes as well). One of the main reasons for this is the dynamic, short, speaker- and contextdependent nature of these sounds. The information that exists in the literature is not sufficient or consistent enough to be integrated in an ASR system. In this work, we investigate the automatic classification of stop consonants in speaker independent continuous speech using auditory-based front-end processing. Due to the superb ability of humans to recognize speech in noisy environments, auditorybased front-end processing systems were developed to emulate some of the processing performed in the human auditory periphery. Several speech recognition experiments have demonstrated that such auditory-based systems yield better performance (in terms of recognition accuracy) compared to the traditional LPC and Mel-Frequency Cepstral Coefficients [7][8], especially in the presence of noise. The relatively robust performance of the auditory-based systems was attributed to the Bark-scale filtering, the compressive non-linearity, the shortterm adaptation, the forward masking and the synchrony detection [10][14].
The front-end processing system used in this work is based on the Average Localized Synchrony Detector (ALSD) for peak (formant) extraction. The ALSD is an auditory-based system developed by the authors [2] as a modification to the well-known Generalized Synchrony Detector (GSD) [13][14] to alleviate some of the limitations of the latter. The output of the front-end processor goes into a featureextraction and stop classification block. Various static and dynamic acoustic-phonetic features are investigated statistically for their information content and robustness in the presence of noise to decide on a minimal set of robust features for the classification task. Those features are combined and manipulated using a decision-tree-like algorithm to produce a classification decision.
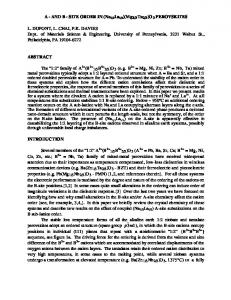
2. AUDITORY-BASED PROCESSING The general structure of the auditory-based processing system used in this work is shown in Fig. (1). It consists of a Barkscaled filter bank of 36 filters with a spacing of half a Bark between neighboring filters. Besides the critical-band filtering, the system includes other auditory effects like compressive nonlinearity, half-wave rectification, automatic gain control, shortterm adaptation and forward masking [3]. It gives two outputs: the mean-rate output and the synchrony output. The synchrony detector block could be a GSD or ALSD depending on which system is being tested. Input Critical Band Filters Hair-Cell Synapse Model
ABSTRACT
Half-wave Rectification and Saturating Non-linearity Low-Pass Filter AGC GSD or ALSD
Synchrony
Short-term Adaptation AGC Envelope Detector Mean-Rate
Fig. (1) Block diagram of the auditory-based front-end processing system.
The GSD system is based on the generalized synchrony detector developed by Seneff [13][14]. The GSD computes an autocorrelation-like output by finding the soft-limited ratio of the expected (averaged) value of the sum and difference of the output of each filter and a delayed version of it. The delay of each GSD must match its corresponding filter’s center frequency (i.e. the delay is equal to the inverse of the center frequency). The GSD enhances the formants and improves the spectral resolution by detecting the periodicity (temporal structure) in the filter outputs instead of the envelope (mean-rate). Despite its advantage over the mean-rate response in enhancing and extracting the formants and its better performance in the presence of noise, the GSD has some serious limitations. Mainly, it suffers from significant spurious peaks due to individual harmonics of the fundamental frequency and various artifacts. Those peaks could be so strong in the low frequency filter responses for female speakers that they affect the detection of the first formant. Trying to reduce those peaks by using wider-band filters or averaging, usually results in significant deterioration in the resolution that defeats the system’s original purpose. To alleviate the previously mentioned problems, without sacrificing the resolution, the authors developed the ALSD system [2]. The output of each ALSD is the average of several (say n) GSD’s tuned to the same frequency but applied to n filters in the neighborhood of the filter corresponding to that frequency. The ALSD provides an extra degree of freedom that enables the suppression of individual harmonics while preserving the formants. It showed better ability to provide a robust and consistent representation of the formants in both clean and noisy speech [2]. The ALSD is used in our experiments and compared against the GSD as explained below.
3. CLASSIFICATION OF STOPS The classification of the stop consonants, which involves the detection of the voicing and the place of articulation, is one of the most challenging tasks in speech recognition. Due to their dynamic, variable, context- and speaker-dependent nature, stops were always quite elusive in their features. In our experiments, we made use of the wealth of information that exist in the literature and our own spectrogram reading and statistical analysis experiments in order to extract a set of features, from the mean-rate and the synchrony outputs, that achieve a good classification performance using a feature-based decision-treelike algorithm [1][3]. The system was tested using 1200 stops (not used in the design/training phase) for 60 speakers from 7 different dialects of the TIMIT database with additive white Gaussian noise at various signal-to-noise ratios (SNRs).
3.1 Voicing Detection Three features were needed for the voicing detection of stop consonants: 1. 2. 3.
Voicing during closure (prevoicing). Voicing onset time (VOT). Closure duration.
Prevoicing is found to be a sufficient, yet not necessary, condition for voicing. If closure phonation exists, then the stop is detected as voiced. Otherwise, we use the VOT to discriminate between voiced and unvoiced stops. The VOT is known to be larger for the voiceless stops relative to the voiced ones. Unfortunately, we found that the threshold depends on the position of the stop. Therefore, another feature is used, namely the closure duration, as a cue to flag which VOT threshold to use. If the closure duration is long (above a certain threshold), then a certain VOT threshold (found statistically to be 40 ms) is used, either because the stop is in initial position, or it is in medial position but its closure was long enough that it behaves like an initial stop. If the closure duration is short, then the stop is assumed to be in a medial position and smaller VOT threshold is used (found statistically to be 10 ms). This technique is only valid for stops in initial and medial positions. Stops in absolute final positions (i.e. followed by a silence) and stops followed by fricatives do not follow the above rules. In those cases, the only reliable voicing feature is the closure phonation. If the stop is prevoiced, it is detected as voiced, otherwise it is unvoiced. Using the above algorithm [3] for voicing detection on 1200 stop consonants extracted from continuous speech of 60 speakers of 7 different dialects yielded an accuracy of 96% as shown in the confusion matrix of table 1. Table 1. Confusion matrix for voicing detection on 1200 stops from 60 speakers. Accuracy is 96%.
Voiced Unvoiced
Detected as voiced 95% 3%
Detected as unvoiced 5% 97%
3.2 Place of Articulation Detection Before discussing the acoustic features used in the place detection, we need to discuss how to extract the flaps. The flap /dx/ is an allophone of /t/ and /d/ that is used in some dialects in certain contexts (like “matter”, “better”, etc.). It exists between two sonorants (usually vowels) and it has unique characteristics that make its detection fairly simple. Flaps are characterized by a very short drop in the total energy, which may even be detected as silence, followed by no release burst and has phonation in it. The duration of the flaps has to be less than or equal to 32 ms. Using these criteria, flaps were recognized correctly with an accuracy of 94% in 1200 stop consonants spoken by 60 speakers. The following discussion of the place detection is concerned with the remaining stops (/t,k,p,d,g,b/). In our experiments, we found the following features to be useful in the place detection [3]: 1. 2. 3. 4. 5. 6.
The burst frequency (BF). The second formant of the following vowel. The maximum normalized spectral slope (MNSS). The burst frequency prominence. Formant transitions before and after the stop. The voicing decision (using the previous section algorithm).
It was found, however, that the burst frequency alone is not consistent or invariant enough to rely upon in the place detection. The BF value was highly dependent on the next vowel in a way that could not be ignored. This variability of the BF could be significantly reduced if we take the next vowel identity (more specifically: the next vowel height) into consideration. This relational invariance is detected by using the second formant of the neighboring vowel as represented by the ALSD. Other features were also found to be important in the place detection. The MNSS (obtained from the mean-rate output) and burst frequency prominence [3] describe respectively the spectral flatness and compactness; properties that characterize labials and velars respectively. Formant transitions are crucial for the place detection in the absence of release bursts. If a burst exists, their role becomes secondary and highly dependent on their salience [3][6]. Finally, the voicing decision was helpful in deciding the thresholds for various features, as it was found that variable thresholds yield better results than fixed and voicingindependent ones [3]. Table 2. Confusion matrix for the place of articulation detection. ‘X’ denotes a “don’t care”, since a flap could be either a /t/ or a /d/. Accuracy is 90%.
Alveolar Velar Labial Flap
alveolar /t,d/ 91% 3% 6% X
velar /k,g/ 6% 88% 6% 2%
labial /p,b/ 3% 9% 86% 4%
flap /dx/ 0% 0% 2% 94%
Details of the extraction and manipulation of those features are given in [3]. A decision-tree-like algorithm was developed to use the above features to perform place of articulation detection. The result of such detection for 1200 stops from 60 speakers with 7 different dialects from the TIMIT database is given in table 2.
4. DISCUSSION Combining the voicing and place detection to perform detailed stop classification yielded the results given in table 3. Performing the same experiments in the presence of white Gaussian noise at various signal-to-noise ratios, results in the
curves shown in Fig. (2). The voicing detection was hardly affected by the presence of noise. The place detection accuracy, on the other hand, deteriorates as the signal-to-noise ratio decreases. The deterioration depends strongly on the features used. For example, extracting the BF using the spectral peak instead of the spectral slope yields the same accuracy on clean speech, but results in a significant deterioration in the presence of noise as shown in Fig. (2). Therefore, the spectral slope was the feature used in our system to extract the BF. Table 3 Confusion matrix for the overall classification. Overall accuracy is 86%. Det. Det. as /t/ as /d/ /t/ 87.5% 3.5% /d/ 3% 88% /k/ 2.5% 0.5% /g/ 2% 2% /p/ 7% 0% /b/ 0% 5% /dx/ X X
Det. as /k/ 5% 0.5% 87.5% 10% 7% 0% 0%
Det. Det. Det. Det. as /g/ as /p/ as /b/ as /dx/ 0.5% 3% 0.5% X 7% 0.5% 1% X 1% 8% 0.5% 0% 76% 0% 10% 0% 0% 83.5% 1% 1.5% 5% 2.5% 85.5% 2% 2% 0% 4% 94%
100 90 80 70
Accuracy (%)
These features describe efficiently the various distinctive properties of the stop consonants as represented by the auditorybased processor, while being relatively robust in the presence of noise. The burst frequency was statistically found to be the single most important feature for the place detection from the information content standpoint. It is defined as the most prominent peak in the synchrony output during the stop release. This is the peak with the largest amplitude or largest spectral slope. Using the spectral slope results in better immunity to noise as will be shown later. The synchrony output is used, as opposed to the mean-rate output, for peak extraction because of its superior ability to extract formants and dominant peaks accurately and its less sensitivity to noise. A comparison showed a clear improvement when using the synchrony compared to the mean-rate. This improvement is 5% in clean speech and becomes more significant in the presence of noise.
60 50 40 30 20 10 0 5
10
20
40
60
Signal-to-Noise Ratio (dB)
Fig. (2) Accuracy of the stop place detection in the presence of additive white Gaussian noise using either spectral slopes (o) or spectral peaks (x) to extract the BF. Most of the extra errors in the presence of noise were labials erroneously detected as alveolars. Alveolars were seldom affected. Velars, on the other hand, were wrongly detected as alveolars when using the spectral peak to locate the burst frequency (BF). This is due to the high frequency energy that shifts the BF location toward high frequency. Using the maximum spectral slope instead to locate the BF preserves its correct location, despite the presence of noise, and significantly reduces such error. In fact, most of the improvement in robustness when using the spectral slope is actually due to eliminating such errors. From Fig. (2), it is also clear that the system demonstrates a relatively good immunity to noise as evidenced by the negligible
deterioration in performance even at SNRs as low as 20 dB. In fact, the accuracy at SNR = 10 dB (72%) is still considered acceptable [4][9]. This robustness is mainly due to the auditorybased processing and the robust acoustic-phonetic features used. Repeating the above experiments using the GSD (instead of the ALSD) showed a consistent deterioration of 3% in the place detection on clean and noisy speech. This is attributed to the ALSD’s superior ability to robustly extract the formants while suppressing the spurious peaks. There are several stop classification experiments in the literature. Searle et al. [12] achieved an accuracy of 77% for 148 stops (including detection errors). In our experiments, we obtained 90% accuracy, which shows a clear improvement over their results. Bush, Kopec and Zue [4] obtained recognition results ranging between 72% and 81% on 216 stops, compared to 86% in this work. De Mori and Flammia [5] performed phoneme recognition experiments on stops using back propagation neural networks as classifiers. Their performance was about 82%, which is comparable to the 86% obtained in this work. Nathan and Silverman [9] used time-varying features in a statistical framework to perform place of articulation detection. Their results ranged between 72.3% to 89.1%, which is comparable to the 90% obtained in our work. Samuelian [11] obtained 83%90% accuracy for recognition of stops from 3 speakers. This is comparable to the 86% obtained in this work on a larger number of speakers. His approach is similar in spirit to the work described here since he used statistical tools to build a knowledge-based system. His system however suffered from the inherent traditional limitations of the decision tree algorithms. Moreover, his frame-level recognition did not make use of the context information as was performed in this work.
5. CONCLUSION In this work, we investigated a feature-based approach to the classification of stop consonants in clean and noisy speech using an auditory-based front end processing system. Based on the previous research and our own statistical analysis and spectrogram reading experiments, we extracted a minimal set of features that are robust and rich in their information content for the specified tasks. New algorithms were developed to extract the articulatory gestures from these features. Using the obtained features to perform classification of stops yielded 96% and 90% for the voicing and place of articulation detection respectively. The overall stop classification had an accuracy of 86% for continuous speech of 60 speakers from the TIMIT database. The performance compares favorably with previous work and was relatively robust in the presence of additive white Gaussian noise. Our results demonstrate the importance of using multiple features (static and dynamic) whose roles in the decision process depend on their salience; context dependence and relational invariance of features (as opposed to absolute invariance); and the promise of feature-based approaches in phoneme recognition. The results emphasized the differences among various features in their roles and robustness in the presence of noise. They also demonstrated the effectiveness of the newly developed ALSD system in alleviating the GSD drawbacks and its ability to
robustly extract the formants while suppressing the spurious peaks in clean and noisy speech.
6. ACKNOWLEDGMENT This work is supported by a grant from Catalyst Foundation.
7. REFERENCES [1] Ali, A.M.A., et al., “Acoustic-phonetic Features for the Automatic Recognition of stop consonants”, Journal of the Acoustical Society of America, 103(5), pp. 2777-2778, 1998. [2] Ali, A.M.A., et al., “Auditory-based speech processing based on the average localized synchrony detection”, Proc. ICASSP’2000, pp. 1623-1626, 2000. [3] Ali, A.M.A., “Auditory-based acoustic-phonetic signal processing for robust continuous speech recognition”, Ph.D. Thesis, University of Pennsylvania, 1999. [4] Bush, M. A., Kopec, G. E. and Zue, V. W., “Selecting acoustic features for stop consonant identification”, Proc. ICASSP, 1983. [5] De Mori, R. and Flammia, G., “Speaker-independent consonant classification in continuous speech with distinctive features and neural networks”, J. Acoust. Soc. Am., 94 (6), 1993, pp. 3091-3103. [6] Dorman, M. F., et al., “Stop-consonant recognition: Release bursts and formant transitions as functionally equivalent, context-dependent cues”, Perception & Psychophysics, 1977, Vol. 22 (2), pp 109-122. [7] Ghitza, O., “Auditory models and human performance in tasks related to speech coding and speech recognition”, IEEE Trans. Speech and Audio Proc., 2(1), pp. 115-132, 1994. [8] Jankowski, C.R., Vo, H.H. and Lippmann, R.P., “A comparison of signal processing front ends for automatic word recognition,” IEEE Trans. on Speech and Audio Processing, vol. 3, pp. 286-293, 1995. [9] Nathan, K.S. and Silverman, H.F., “Time-varying feature selection and classification of unvoiced stop consonants”, IEEE Trans. Speech and Audio Processing, Vol. 2, No. 3, 1994, pp. 395-405. [10] Ohshima, Y., “Environmental robustness in speech recognition using physiologically-motivated signal processing”, Ph.D. Thesis, Carnegie Mellon University, 1993. [11] Samuelian, A., “Frame-level phoneme classification using inductive inference”, Computer Speech and Language, 11, pp. 161-186, 1997. [12] Searle, C. J. et al., “Stop consonant discrimination based on human audition”, J. Acoust. Soc. Am., 65 (3), Mar. 1979, pp. 799-809. [13] Seneff, S., “A Joint Synchrony/Mean Rate Model of Auditory Speech Processing”, J. Phonetics, 16, pp. 55-76, 1988. [14] Seneff, S., “Pitch and Spectral Analysis of Speech Based on an Auditory Synchrony Model”, Ph.D. Thesis, MIT, 1985. [15] Zue, V. W., “Acoustic characteristics of stop consonants: A controlled study”, D. Sc. thesis, MIT, 1979.