We investigate the general problem of reproducing color images on an offset press using custom inks in any combination and number. While this problem has ...
Reproducing Color Images Using Custom Inks Eric J. Stollnitz
Victor Ostromoukhov�
University of Washington
� Ecole Polytechnique F´ed´erale de Lausanne
Abstract We investigate the general problem of reproducing color images on an offset press using custom inks in any combination and number. While this problem has been explored previously for the case of two inks, there are a number of new mathematical and algorithmic challenges that arise as the number of inks increases. These challenges include more complex gamut mapping strategies, more efficient ink selection strategies, and fast and numerically accurate methods for computing ink separations in situations that may be either over- or under-constrained. In addition, the demands of high-quality color printing require an accurate physical model of the colors that result from overprinting multiple inks using halftoning, including the effects of trapping, dot gain, and the interreflection of light between ink layers. In this paper, we explore these issues related to printing with multiple custom inks, and address them with new algorithms and physical models. Finally, we present some printed examples demonstrating the promise of our methods. CR Categories: I.3.4 [Computer Graphics]: Graphics Utilities; G.1.6 [Numerical Analysis]: Optimization Additional Keywords: color reproduction, color printing, gamut mapping, ink selection, Kubelka-Munk model, Neugebauer model, separations
1
David H. Salesin
Introduction It is of interest : : : that, regardless of the number of impressions, the inks may be selected solely on the basis of their color gamut. Their colors need not be cyan, magenta, and yellow; nor is it required that they be transparent. The way is therefore opened for entirely new printing processes. —Hardy and Wurzburg, 1948 [6]
Fifty years ago, the promise of color printing with custom inks appeared imminent. The advantages of such a process are clearly numerous. Freed from the same fixed set of process color inks—cyan, magenta, yellow, and black—it should be possible to print more vibrant colors for art reproductions, annual reports, and packaging. Moreover, if the inks are chosen specifically for the particular image being reproduced, it should be possible in many cases to achieve these vivid colors with just a small number of inks—perhaps four— and perhaps at no greater cost than using the four process colors. In addition, it is common today to print boxes and wrappers with four process inks (for images) plus two spot colors for corporate logos or large areas of background. By selecting custom inks that complement the required spot colors, we might achieve better quality with six inks or comparable quality with fewer inks.
In recent years, several new color printing processes have been proposed that use a fixed set of six or more standard printing inks [1, 22, 28]. For those willing to use more inks, these new processes do provide more vivid color reproduction. However, Hardy and Wurzburg’s fifty-year-old vision of printing with arbitrary custom inks remains elusive. Indeed, there are quite a few difficult problems that stand in the way. For one, it is very difficult to derive a physical model that accurately predicts how arbitrary inks will interact when printed together, in superposition and in juxtaposition using halftoning. In addition to optical effects, the model must take into account physical effects such as trapping and dot gain. Furthermore, the gamuts produced by multiple custom inks have irregular, nonconvex shapes. Creating efficient, reliable gamut mapping algorithms for smoothly mapping image colors to the colors that can be achieved with a given set of inks is a nontrivial problem. Choosing the best set of custom inks to use for a given image is another difficult problem—in this case, a combinatorial challenge, particularly as the number of inks used for printing gets large. Finally, computing ink separations becomes more difficult for multiple inks. While for two inks there is always a simple analytic solution, for three or more inks the problem can become either overor under-constrained. The problem becomes over-constrained when the color to be printed cannot be achieved with quantities of ink between 0 and 100%. The problem is under-constrained when there are two or more ways of achieving the same color, using different ink combinations. This situation arises wherever the gamut is doubly covered, a commonplace occurrence with four or more inks. This paper addresses these challenges in detail with new physical models and algorithms, then demonstrates the potential of our approach with printed examples. Although a great deal more work remains to be done before Hardy and Wurzburg’s vision is achieved in its entirety, this paper at least takes some steps toward that goal. Related work Power et al. [23] showed that for duotone printing, in which just two inks are used, choosing the optimal inks for the particular image at hand can result in remarkably good reproductions. Our paper discusses the many issues involved in generalizing their work to three or more custom inks—what we refer to as n-tone printing. These issues can be broken down into a number of subproblems. First, for any given choice of paper and inks, we require a model of the gamut of printable colors. Many existing models have been developed for specific inks and printing processes; unfortunately, these models typically do not apply when printing with custom inks. More general models include the color halftoning model developed by Neugebauer [21], and colorant layering models such as the BeerBouguer, Kubelka-Munk, and Clapper-Yule equations (described by Kang [12]). Liu describes a model for process color printing similar to both the Kubelka-Munk layering model and the Neugebauer halftoning model [16]. We model the printing gamuts of custom inks using a similar approach in Section 2, where we combine the Kubelka-Munk and Neugebauer equations while taking into account the effects of dot gain and trapping.
The second subproblem, that of mapping the original image colors into the gamut of available colors, has been addressed previously for monitors and various types of printers. Studies have shown that the least objectionable mappings are those that preserve hue at the expense of luminance and saturation [5, 20]. In accordance with these findings, most existing gamut mapping techniques maintain hue while compressing each color’s luminance and saturation in one of two ways: either toward a gray of equal luminance, or toward a fixed gray of medium luminance [10, 14, 27, 29]. In Section 3, we develop a continuous family of gamut mappings filling the gap between these two predominant strategies.
2.1 Modeling color halftoning Most models of color halftone printing used today are based on the equations published by Neugebauer in 1937 [21]. His model assumes that small dots of color are printed in such a way that their edges are sharply defined, their overlapping areas are distributed randomly, and within each overlapping area each ink is either completely present or completely absent. His model also assumes we know the colors of the printing primaries: the paper color, the color of each ink printed on paper alone, and the color of each overprinted combination of inks. Under these conditions, the Neugebauer equations state that the overall color of a small area is simply the areaweighted average of the colors of the printing primaries.
The problem of choosing inks has most often been framed as a search for one fixed palette that reproduces all images well. A number of multicolor printing approaches have been developed to achieve greater fidelity than process inks: the PANTONE Hexachrome system adds an orange and a green to the four process colors; Ostromoukhov [22] adds orange, green, and purple; Boll [1] adds red, green, and blue; and Takaghi et al. [28] mention a nine-ink process. Iwata and Marcu [9] touch on the subject of choosing the optimal printing order for a fixed set of inks printed on fabric. However, in none of the previous literature (aside from the work done by Power et al. for duotones) are the inks chosen to be optimal for a given image. We discuss criteria and algorithms for choosing optimal inks in Section 4.
Neugebauer’s model is easily generalized from its original threecolor formulation to incorporate any number of inks. For n inks, there are 2n printing primaries (since each ink is either present or absent in a primary). The colors of the primaries are typically represented using coordinates in the XYZ color space, though the model applies equally well to reflectance spectra or any linear transformation of XYZ coordinates. With a slight modification of the notation used by Power et al. [23], we will refer to the color of paper as gp , the color of paper covered by the first ink as gp1 , the color of paper printed with the first and second inks as gp12 , and so on. The fraction of area in which ink i is actually printed is denoted by �i , and we write these ink amounts collectively as � = (�1 , : : : , �n ).
The multicolor printing processes mentioned above have corresponding algorithms for computing ink separations. A number of these methods assume the printing gamut is a convex union of tetrahedra [9, 19, 22, 28], but many gamuts violate this assumption. Other separation algorithms, like those for process inks, are tailored for particular inks. Still others use Newton’s method [15] or an analytic solution [18, 23] to invert the gamut model, but these approaches do not generalize to more than three inks. In Section 5, we present a robust separation method for arbitrary inks, paying particular attention to the difficulty of obtaining smooth results.
For a given set of printing primaries, the Neugebauer equations give a printable color c as a function of the ink amounts �. For example, three-ink printing yields eight printing primaries, and the Neugebauer model is written as follows: c(�) = + + + + + + +
Each of the topics above is treated in more detail in the first author’s dissertation [26]. In addition to describing our models and algorithms in the main text of this article, we display our printed results and discuss our experimental procedures in a set of appendices (printed with custom inks and inserted into the proceedings). We conclude in Section 6 with a summary of our work and ways in which it can be extended.
2
, �1 ) (1 , �2 ) (1 , �3 ) gp (�1 ) (1 , �2 ) (1 , �3 ) gp1 (1 , �1 ) (�2 ) (1 , �3 ) gp2 (�1 ) (�2 ) (1 , �3 ) gp12 (1 , �1 ) (1 , �2 ) (�3 ) gp3 (�1 ) (1 , �2 ) (�3 ) gp13 (1 , �1 ) (�2 ) (�3 ) gp23
(1
(�1 )
(�2 )
(�3 ) gp123
2.2 Adding trapping to the Neugebauer model Implicit in the Neugebauer model is the assumption that if we intend to cover a fraction �i of an area with ink i, we can actually achieve that fractional coverage. In reality, because of the physical properties of inks and papers, some of the ink on the printing plate may not stick to the printed page. The portion of ink that does stick is said to be “trapped” by the paper. We will denote by tp1 the fraction of ink 1 that sticks to paper, and by tpij the fraction of ink j that sticks to ink i (the trapping fraction for ink j on ink i on paper).
Modeling printing gamuts
In order to find the best combination of paper and inks from many possible choices, we need a mathematical model of the gamut of printable colors that results from any particular choice. Power et al. use the Neugebauer model of color halftoning in concert with a simple ink layering model to predict duotone gamuts. The accuracy of the gamut model is not crucial for duotone printing, since the user cannot expect a perfect reproduction from only two inks. By contrast, users can be expected to be much more critical when printing with three or more inks, and therefore n-tone printing requires a much more accurate gamut model.
With this convention, we can model the color c we get by trying to cover a fraction �1 of the paper with ink 1: c(�) = (1
, tp1 �1 ) gp + tp1 �1 gp1
(1)
Now suppose we print a second ink on top of that result. Of the area that was the color of paper gp , a fraction tp2 �2 will get covered by ink 2 and become gp2 , while the rest will stay the same. Likewise, in the area that was colored gp1 , a fraction tp12 �2 will be overprinted with ink 2 and become gp12 , while the rest will stay the same. Thus, the result is a weighted average of four colors (as in the Neugebauer model):
We develop a model below that extends the Neugebauer model of color halftoning to account for the fact that an ink does not always adhere to paper and to other inks. This gamut model further requires that we know the colors achieved by overprinting combinations of inks. As we cannot always measure these overprinted colors, we rely on a mathematical model of layered media in addition to the Neugebauer model. We postpone until an appendix a discussion of the experimental procedure we followed to fit the model’s parameters to measured data.
, ,
, ,
c(�) = (1 tp1 �1 ) (1 tp2 �2 ) gp + (tp1 �1 ) (1 tp12 �2 ) gp1 + (1 tp1 �1 ) (tp2 �2 ) gp2 + (tp1 �1 ) (tp12 �2 ) gp12
2
(2)
zzzz yyyy ���� ,,,,
If we add a third ink, the result will be a weighted average of eight colors, and we need seven trapping fractions: c(�) = + + + + + + +
, tp1 �1 ) (1 , tp2 �2 ) (1 , tp3 �3 ) gp (tp1 �1 ) (1 , tp12 �2 ) (1 , tp13 �3 ) gp1 (1 , tp1 �1 ) (tp2 �2 ) (1 , tp23 �3 ) gp2 (tp1 �1 ) (tp12 �2 ) (1 , tp123 �3 ) gp12 (1 , tp1 �1 ) (1 , tp2 �2 ) (tp3 �3 ) gp3 (tp1 �1 ) (1 , tp12 �2 ) (tp13 �3 ) gp13 (1 , tp1 �1 ) (tp2 �2 ) (tp23 �3 ) gp23 (1
(tp1 �1 )
(tp12 �2 )
(tp123 �3 ) gp123
air
Ri
(3)
Rp
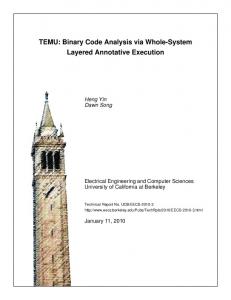
Once again, we can measure Rp and Rpi for a single ink on a variety of papers, and fit Ri and Ti to the model. Equation (6) is subsumed by a more general model, known as the Kubelka-Munk model (described by Judd and Wyszecki [11, pages 420–438] and by Kort¨um [13], among others). As Figure 1 illustrates, light can reflect any number of times between the ink and paper before finally exiting the ink layer, making the reflectance of ink on paper an infinite sum of terms:
In addition to the effects of trapping, offset printing is subject to dot gain. The halftoned dots of an ink appear larger than they should for two reasons: ink spreads out on the paper (physical dot gain), and some of the light entering the paper is scattered until it emerges through dots of ink (optical dot gain). We can account for both varieties of dot gain using an empirical model that corrects the value of �i for each ink. When we produce a halftone separation that specifies a coverage �¯ i , we find that one minus the actual coverage in the printed result is approximated very closely by a power law:
Rpi = Ri + Ti2 Rp (1 + R˜ i Rp + R˜ 2i R2p +
Note that we can modify equation (7) to predict the reflectance of one ink on another ink (on paper), assuming the top ink layer behaves the same as it would on paper. If we print on paper p using ink i followed by ink j, we can compute Rpij from quantities we have measured or fit to measurements:
We have so far assumed that we know the colors of the printing primaries. While it is straightforward to measure these colors for a small set of inks (like the process inks) on a small set of papers, it is impractical to do so for all the combinations that could be chosen from large sets of inks and papers. If we want to print on a new paper without measuring all our inks on that paper, we need a model capable of predicting the primaries. There are many levels of complexity we can introduce into a model; we will start with a simple model and progress to more complicated ones.
Rpij = Rj +
Tj2 Rpi 1 R˜ j Rpi
,
(8)
The Kubelka-Munk model can be derived from physical principles, but only under certain assumptions. One assumption is that all the layers have the same index of refraction. However, the index of refraction of a colorant layer is typically between 1.45 and 1.6 [11, page 398], while that of air is very nearly 1. As a result of the difference in indices, some of the incident light will undergo Fresnel reflection at the material interface.
If we assume that a layer of ink acts as an ideal filter, we need to know only how much light it transmits at each wavelength �. We will write the transmittance of the ink as Ti , and the reflectance of paper as Rp (for some wavelength �). The reflectance of ink on paper is given by the amount of light that penetrates the ink (Ti ), reflects off the paper (Rp ), and emerges through the ink again (Ti ):
We can correct for Fresnel reflection at the boundary between ink and air using a construction similar to that of the Kubelka-Munk model. Suppose �ai is the fraction of diffuse light traveling from air to ink that is reflected by the surface of the ink layer, and �ia is the surface reflectance for light going from ink to air. Then, according to Saunderson [25], we find the corrected reflectance R0pi of a layer of ink on paper by modifying the prediction given by equation (5), (6), or (7) as follows:
(5)
We can measure Rpi and Rp using a spectrophotometer, but not Ti because it is a property of the ink layer without paper. However, we can characterize an ink by printing an identical layer of that ink on a variety of papers, measuring Rp and Rpi for each paper, then fitting Ti to the model. Unfortunately, a single transmittance spectrum may not be enough information to accurately model an ink on paper, let alone one ink atop another.
R0pi = �ai + (1
, �ai )(1 , �ia) 1 ,R�piia Rpi
(9)
Assuming dried ink has an index of refraction of 1.5, �ai is approximately 0.1 and �ia is about 0.6 for all wavelengths [11, page 417].
One problem with the simple model above is that inks reflect some light in addition to absorbing and transmitting light. If we introduce a reflectance Ri for the ink, we have Rpi = Ri +
(7) p
The reflectance of the back side of the ink layer, R˜ i , can differ from the reflectance of its front side because the layer may be inhomogeneous. Now we must fit three reflectance spectra (Ri , R˜ i , and Ti ) to measured data in order to characterize an ink. If R˜ i is identically zero, we are left with equation (6); if Ri is also zero, we are left with equation (5).
(4)
2.4 Modeling the printing primaries
Ti2 Rp
2
� � � ) = Ri + 1 ,Ti RR˜ pR i
The parameter i associated with ink i can be determined from experimental data using standard curve-fitting techniques, as discussed in an appendix. Note that if we desire an actual coverage of �i , we can always solve the equation above for �¯ i , the coverage we should specify.
Rpi = Ti2 Rp
Rp
Figure 1 The light reflected by a single layer of ink on paper.
2.3 Adding dot gain to the Neugebauer model
i
~ Ri
paper
,
, �i = (1 , �¯ i )
Ti
~ Ri
Ti
In general, for n inks the resulting color will be a weighted average of the 2n printing primaries, where the weights depend on 2n 1 trapping fractions.
1
Ti
ink
Fresnel reflection may also occur at the boundary between ink and paper if the interface is planar. In this case, we adjust our earlier equations using surface reflection coefficients �ip (for light going
(6)
3
white yellow
fixed [14, 17, 27]; the second simultaneously alters luminance and saturation toward the central gray of the gamut [14, 17].
orange
yellow
Because the first approach maps colors into the printing gamut by reducing their radial distances from a central gray axis, we refer to it as a “cylindrical” mapping. Likewise, because the second approach reduces each color’s distance from a single central gray point, we refer to it as a “spherical” mapping. Laihanen notes that depending on the image being reproduced, one may be preferable to the other [14]. The cylindrical mapping has the advantage of preserving luminance relationships, but it tends to desaturate brightly colored highlights until they become white. The spherical mapping keeps the highlights more saturated, but reduces their luminance at the same time, resulting in a reordering of brightnesses in the image.
orange
purple
purple green green black
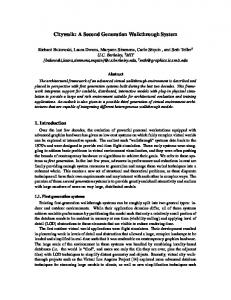
Figure 2 Front and top views of a four-ink gamut.
from ink to paper) and �pi (for the opposite direction). We simply replace Rp in equations (5), (6), or (7) with a corrected reflectance R0p : R0p = �ip + (1
, �ip)(1 , �pi ) 1 ,R�ppiRp
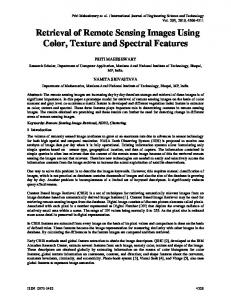
In order to obtain some of the advantages of both the cylindrical mapping and the spherical mapping, we developed a parameterized family of intermediate mappings. While we could simply interpolate between the color given by the cylindrical mapping and the color given by the spherical mapping, there would be no guarantee that the result would lie in the printing gamut (because gamuts are not necessarily convex). Instead, we vary the locus of colors that serve as the centers of projection in the mapping: the cylindrical mapping moves colors toward a fixed line segment along rays orthogonal to a cylinder; the spherical mapping moves colors toward a single point along rays orthogonal to a sphere; our new mapping moves colors toward a line segment whose length is parameterized, along rays orthogonal to an ellipsoid. Figure 3 illustrates the directions in which colors are compressed by each type of mapping. These directions are made explicit in the following section.
(10)
Uncoated papers consist largely of air, so their indices of refraction are close to 1 and we can use �ip = 0.6 and �pi = 0.1. For lack of better knowledge, we use the same numbers for coated papers; however, these papers and modern plastic substrates deserve more study. Note that in the previous two equations Rp and R0pi are measurable quantities, while Ri , R˜ i , and Ti are characteristics of the ink that we need to derive from other measurements. Regardless of the level of complexity we choose for our ink layering model—equation (5), (6), or (7), with or without the corrections in equations (9) and (10)—we often need to convert reflectance spectra into tristimulus XYZ colors for use in the color halftoning model of Section 2.2. Judd and Wyszecki describe this conversion in detail and provide the necessary data for standard illuminants and the XYZ matching functions [11, pages 125–153 and 472–479].
3
3.2 Coordinate system of n-tone mapping The implementation of our n-tone gamut mapping makes use of a special-purpose coordinate system that varies according to the parameter k. The coordinate system yields a cylindrical mapping when k = 0, a spherical mapping when k = 1, and an ellipsoidal mapping for intermediate values. Transforming an XYZ color into this coordinate system takes place in two stages. The first is a linear transform that rewrites the color as a triple (u, v, y), where y represents luminance and u and v hold the chrominance information. This linear transform shears the dark-to-light axis of the printing gamut (while preserving luminance) until it parallels the luminance direction, then applies a uniform scaling and translation that brings the darkest point of the printing gamut to (0, 0, –1) and the lightest to (0, 0, 1). Our linear transform is similar to that of Stone et al. [27, Section 5.2], but we have replaced their rotation with a shear in order to preserve luminance relationships throughout the gamut mapping process.
Gamut mapping
Suppose we want to reproduce an image using a particular combination of paper and inks. We can use the model presented in the previous section to predict the gamut of all printable colors associated with this choice of paper and inks. In most cases, there will be a number of image colors that are outside the gamut of printable colors. We therefore need to define a gamut mapping function that associates a printable color with each of the original image colors without introducing unnecessary color distortion into the image’s appearance. According to a number of articles that address gamut mapping, it is most important to maintain the hue of a color, while allowing its lightness and saturation to change in order to fit within the printing gamut [5, 10, 14, 20, 27, 29]. In the sections that follow, we devise a hue-preserving gamut mapping strategy that is more general than existing ones, then present its coordinate system and algorithmic details. We conclude our discussion of gamut mapping with some remarks on the special steps we need to take when printing with only one or two inks.
The second stage of the transformation converts (u, v, y) to curvilinear coordinates (r, h, �), where h represents hue and r and � indirectly encode luminance and saturation. These new coordinates are found by inverting the following equations: u = r cos h cos � v = r sin h cos � y = (1
3.1 Strategy of n-tone mapping
, k2 + kr) sin �
In this coordinate system, lines of constant h and � trace out the normals to the ellipsoid (u2 + v2 )=k2 + y2 = 1; these are the lines along which we compress out-of-gamut colors. Note that when k = 1, the transformation above gives the standard conversion between spherical and Cartesian coordinates, which is easily inverted. Likewise, when k = 0 the equations are only a slight modification of standard cylindrical coordinates, and are also easily inverted. However, for intermediate values of k, we lack an analytic solution and therefore resort to Newton’s method to solve a nonlinear equation for �.
In general, the gamut of three or more inks occupies a volume in color space. A typical example is shown in Figure 2, illustrating the fact that printing gamuts can take on unusual nonconvex shapes. Because an n-tone gamut occupies a volume, we can attempt to preserve hues (though for some choices of inks, not all hues may be printable). Among the hue-preserving gamut mapping algorithms in the literature, there are two predominant strategies for altering luminance and saturation: the first reduces saturation, leaving luminance
4
y
y φ
r
h
h
v
u
v
(a)
φ
r
r
h
u
y
φ
u
(b)
v
(c)
Figure 3 The coordinate systems used by three gamut mapping methods chosen from a continuum: (a) cylindrical (k = 0), (b) ellipsoidal (k = 0.3), and (c) spherical (k = 1). Arrows on the cutaway surfaces indicate the directions in which colors are compressed.
3.3 Steps in n-tone mapping
gamut exceeds the image gamut for some bin, we set r¯image equal to r¯print , so that gamut mapping will not spread similar colors apart.
The first step in our gamut mapping technique is to apply a global mapping to the luminance values of the source image’s colors. As noted by Power et al. [23], we can use any monotonically increasing function to compress the image’s luminance range into the range of printable luminance values. Experiments in the literature typically rely on clamped or linear mappings [5, 20], but we often use a cubic mapping that has the advantages of both (see Figure 4). This mapping is inspired by the B´ezier-curve mapping described by Power et al., but is more easily constructed. We determine a unique cubic function by constraining the minimum and maximum input values to map to the minimum and maximum output values, while choosing for each endpoint a slope between 0 and 1 that yields an increasing function as close as possible to the identity function (Stollnitz [26] provides further details). For most values of k we can skip this first step because subsequent steps will also adjust luminance; it is only when k = 0 that we must compress luminance in order for a cylindrical mapping to get all colors into the printing gamut.
The final step is to apply a mapping to the r value of each image color, where the mapping varies from one bin to the next. Given an image color, we determine the four bins closest to the (h, �) coordinates of that color, and apply bilinear interpolation to the corresponding values of r¯ image and r¯print . We construct a function that maps zero to zero and the interpolated value of ¯rimage to the interpolated value of r¯print . The intermediate values of r can be computed using a clamped, linear, or cubic mapping, as shown in Figure 4. Once all the image colors have been mapped, we can convert them from (r, h, �) coordinates back to XYZ coordinates, and they should all lie within the printing gamut. 3.4 Monotone and duotone mappings The gamut mapping steps described above (and many other color gamut mapping techniques) rely on assumptions about the shape of the printing gamut that do not always hold. In particular, we assumed that the gamut consists of a volume of colors that includes the line segment connecting the darkest and lightest printable colors. If we are printing with one ink, however, the gamut is a line segment of colors rather than a volume. With two inks, the gamut is a surface rather than a volume. We treat one-ink (monotone) and two-ink (duotone) printing as special cases.
The second step is to divide the set of directions that are parameterized by h and � into a two-dimensional array of bins, as indicated by the grid lines in Figure 3. The number of divisions in each direction determines the storage, efficiency, and accuracy of subsequent mapping steps; numbers near 20 are adequate for quick previews, while numbers near 100 are more suitable for high-quality output. Next, we determine the maximum extent in the r direction of the printing gamut within each (h, �) bin. For each bin, we construct a ray centered within that bin, and intersect it with each of the bilinear surfaces that bound the gamut model described in Section 2.2. We associate with the bin the largest r value encountered in these intersection tests, which we call r¯print .
The gamut of colors that can be printed with one ink is given by equation (1); it consists of a line segment parameterized by �1 . According to Stone et al. [27], the most important quality to preserve (aside from the gray axis, which we cannot keep gray) is maximum luminance contrast. Therefore, we first remap the input image’s luminance values to lie within the luminance range of the printing gamut. As in the n-tone mapping, we can use any one of the clamped, linear, or cubic mappings illustrated in Figure 4. Once we finish this remapping, we can safely project each image color onto the printing gamut while preserving luminance relationships.
input (a)
The gamut produced by two inks is a bilinear surface given by equation (2). Once again, because the gamut has lower dimensionality than the space of colors, we must resort to projection within any gamut mapping. The core of the work presented by Power et al. [23] is a method of mapping image colors to a duotone gamut while preserving as much color information as possible. Their algorithm first remaps the input image’s luminance values as described above, then remaps a second component (s for “spread”) of the image colors that is orthogonal to luminance. This second remapping is a function of luminance, so that the most compression is applied to the darkest and lightest colors, where the printing gamut is the most narrow (and the least compression to the mid-luminance colors, where the gamut
output
output
output
We also store with each bin a quantity called r¯ image , defined as the largest r value of all image colors lying in that bin. If the printing
input (b)
input (c)
Figure 4 Monotonically increasing mappings: (a) Clamped mapping preserves exact values, except at the endpoints. (b) Linear mapping preserves relationships. (c) Cubic mapping provides a good compromise between the two.
5
is widest). Finally, each color is projected onto the printing gamut in the direction orthogonal to the first two mappings.
of which is distinct from the others, and we keep them sorted according to their respective objective function values. At each iteration, we choose a genetic operator according to a time-varying probability distribution, and we choose its operands randomly from the current population. The operators for our application include global mutation, local mutation, and crossover. Global mutation operates on one combination, changing the paper and inks completely randomly; this operator is more likely to be chosen in early iterations. Local mutation also operates on one combination, but changes the paper and inks only to nearby colors; this operator is more likely in later iterations. Crossover takes two combinations and exchanges each of the papers and inks with 50% probability. The likelihood of choosing crossover starts out high, and gradually declines to zero, so as to prevent one solution from dominating the population.
We offer two minor improvements to the method described by Power et al. First, we avoid discontinuities in our duotone gamut mapping by applying piecewise-linear (rather than piecewiseconstant) interpolation to the bin values approximating the gamut’s extent in the s direction. Second, we offer a choice of luminance mappings, including the clamped and cubic mappings shown in Figure 4 in addition to the linear mapping used by Power et al.
4
Selecting inks
Throughout Sections 2 and 3 we treated the paper and inks as though they were known. Our goal, however, is to find the optimal combination of paper and inks for a given image. This task is difficult because there may be a huge number of possible choices, most of which will result in poor reproductions. Often it is not obvious even to an experienced user whether or not a choice of paper and inks will reproduce an image well; therefore, we are not yet willing to rely on heuristic rules for accepting or rejecting combinations. Instead, we pose the problem of selecting paper and inks as a combinatorial optimization problem and apply a general-purpose algorithm to solve it, just as Power et al. [23] did for duotones. We describe below our objective function and optimization algorithm for choosing inks.
Every time an operator produces a previously untested combination of paper and inks, we evaluate the objective function and compare the result to the current members of the population. If the new combination outperforms the worst member of the population, we replace the old one with the new one. Thus, each iteration maintains or improves the population. We repeat the process for a fixed number of iterations, or until a fixed number of iterations fails to yield a decrease in the objective function. The results are presented to the user as a list of possible paper and ink combinations, sorted from best to worst, from which he or she can choose any one to preview.
5 Computing separations
4.1 Ink-selection objective function
Once the paper and inks have been selected and a preview has been computed using our gamut mapping algorithm, our only remaining task is to produce separations for each of the inks. More precisely, for each color generated by the gamut mapping algorithm, we need to find the amount of each ink required to reproduce that color. The mathematical model of printing gamuts that we developed in Section 2 gives tristimulus colors as a function of the ink amounts �i , whereas now we want to find the ink amounts as a function of color. Determining this inverse function is no simple matter, mainly because each tristimulus component of our model is a nonlinear function of the � values. In addition, the inverse is underdetermined when there are more than three inks; there may be many � values that yield the same color. There is another difficulty that arises in practice: some of the colors for which we wish to compute separations may be slightly out of gamut because of imprecisions in the gamut mapping stage, yet we still need to find � values between zero and one that reproduce similar colors.
Our objective function for ink selection is very similar to the one described by Power et al. Given an image and a combination of paper and inks, we apply the gamut mapping algorithm discussed in Section 3 to obtain a preview image. Then we compare the preview image pixel-by-pixel to the original image, using the L2 norm in L� a� b� color space. The value we assign to our objective function is the average over all pixels of the L2 distance between the preview and original image. The efficiency of the objective function is an important concern because it gets evaluated often. Fortunately, we don’t need to apply our gamut mapping algorithm to each of the tens or hundreds of thousands of distinct colors contained in a typical high-resolution scan. Instead, we can use Heckbert’s median-cut algorithm [7] to quantize the image to about 2,000 distinct colors while maintaining its general appearance. Then we need only apply the gamut mapping algorithm to these quantized colors, and weight each color’s L� a� b� distance according to the number of pixels of that color in the original image.
For more than three inks, we cannot invert the gamut model analytically as Power et al. [23] did for two inks, and Mahy and Delabastita [18] did for three. We also cannot treat the printing gamut as a convex union of tetrahedra, as some authors have [9, 19, 22, 28]; many gamuts are actually concave. Instead, we rely on a continuous optimization technique to find the separations that most closely reproduce a desired color while meeting the physical constraints of the printing process. The details of our objective function and optimization algorithm are given below.
4.2 Ink-selection algorithm Power et al. chose a simulated annealing algorithm for their combinatorial optimizer because of its ability to find global minima and relatively good local minima. We prefer to use a genetic algorithm, mainly because it maintains a population of candidate solutions, each of which can be presented to the user as a possibility when the optimizer is finished. Simulated annealing and the genetic algorithm are both stochastic optimization techniques, making use of random changes to intermediate solutions in order to avoid local minima. In fact, Power et al. made their simulated annealer slightly closer to a genetic algorithm by using multiple initial conditions to obtain a variety of solutions; likewise, we made our genetic algorithm slightly closer to simulated annealing by assigning a timevarying probability distribution to each of the genetic operators.
5.1 Separation objective function The goal of the current optimization is to find the ink amounts � = (�1 , : : : , �n ) for which our gamut model yields the color c(�) closest to a given tristimulus color c¯ . We formulate the objective function as the sum of four terms:
k
, k ,
f (�; c¯ , �ref ) = w1 c(�) c¯ 2 P + w2 i max(0, �i , �i 1)2 , P �2 + w3 max 0, i �i �limit
Following suggestions made by Davis [3], we include in our implementation a number of variations on the “standard” genetic algorithm. We maintain a population of candidate combinations, each
+ w4
6
k� , �refk
2
,
,
The first term of the objective function is just the square of the distance in XYZ color space between the desired color c¯ and the color our gamut model predicts from the � values. For an in-gamut color, the optimizer should find a solution where this term is zero. For an out-of-gamut color, minimizing the first term is akin to projecting onto the nearest point of the gamut, as was done by Stone et al. before computing separations [27]. We arbitrarily choose the weight w1 = 0.005, and set the remaining weights by trial and error based on the magnitudes of the terms.
considering the amount of information they require and their rates of convergence. Because we can efficiently compute the first partial derivatives of all the terms in our objective function, we can use optimization techniques that achieve quadratic convergence rates. These include the conjugate gradient method and “quasi-Newton” methods, among others. We found the BFGS quasi-Newton method to be the most efficient for our problem (even when compared to Newton’s method, which uses costly second derivative information as well). Detailed descriptions of these algorithms are given by Press et al. [24, pages 420–430].
The second and third terms introduce penalties for violating constraints inherent in the printing process. The second term bounds each of the ink amounts between 0 and 1, thereby moving out-ofgamut colors to in-gamut separations. The third term ensures that the total amount of ink does not go over the “ink limit,” the point at which ink no longer adheres to the page. The ink limit depends upon the press and the paper; we use �limit = 3.7. We typically set w2 = w3 = 1000 so that ink amounts violating these constraints are strongly penalized.
6 Conclusion In this paper, we have laid out a general framework for multicolor printing with custom inks, and described algorithms that show promise for solving longstanding problems in color printing. Our gamut model combines previous ink layering and halftoning models with modifications for trapping and dot gain. We introduced a new ellipsoidal gamut mapping that effectively fills a gap between the existing cylindrical and spherical variations of gamut mapping. We described the operators needed to adapt a genetic algorithm to the selection of papers and inks. Finally, we developed a robust multiresolution algorithm that, given any combination of inks, computes separations that are as smooth as the input image.
The final term of the objective function allows us to achieve a unique solution when there are multiple ways to produce the same color. We do so by finding the solution that is closest to a given set of reference values �ref . We use a relatively small weight for this term (w4 = 0.025) so that it does not prevent the color c(�) from matching c¯ . We can set each component of �ref to 0 or 1 to minimize or maximize the amount of ink used, or choose 0.5 for an intermediate solution.
The appendices present practical results of our experiments in the realm of custom-ink color image reproduction. We outline there the steps required to fit the parameters of our gamut model to measured data, and exhibit a variety of printed images produced with our techniques. While we still see room for improvement in these results, they demonstrate the potential for making color reproductions with custom inks that are more accurate or less costly to produce than with standard process inks.
Unfortunately, we find that these simple choices of reference values often lead to separations containing artificial discontinuities. Because the ink amounts used for adjacent pixels are computed independently, slightly different colors may result in very different separations. While in theory these separations will produce similar colors when printed, in reality even the slightest misregistration reveals the discontinuities. To avoid such artifacts, we try to compute separations that are just as smooth as the input image. One possible solution is to set �ref to the ink amounts of the most similar color among the four adjacent pixels that have already been separated. This approach eliminates many artifacts, but because of the asymmetry inherent in processing pixels from left to right and top to bottom, it may still produce discontinuities in some directions.
In general, n-tone printing offers the opportunity to match monitor colors better than process color printing because the inks are chosen specifically for the image. Moreover, because we construct a gamut mapping that is customized for the image at hand, we can achieve a much more accurate reproduction than is possible with a gamut mapping designed to bring all monitor colors into the same printing gamut. As a case in point, our gamut mapping will not alter an image whose colors all happen to fall within the printing gamut, while many other algorithms will shift the image colors merely because some colors in the monitor gamut (but not in the image) are not printable.
We can generate much better separations using a multiresolution algorithm based on image pyramids. The central idea is to compute for each pixel the ink amounts that produce the right color and are as close as possible to the ink amounts of the entire surrounding neighborhood. Of course, the ink amounts that best reproduce a pixel’s neighborhood depend in turn on a larger neighborhood, and thus we rely on a recursively defined image pyramid. First, we construct a pyramid of reduced images from the gamut-mapped source image by repeatedly applying a low-pass filter followed by downsampling. We use a separable low-pass filter with coefficients 161 (1, 4, 6, 4, 1); see Burt and Adelson [2] for further details on image pyramids. Next, we compute separations for the lowest-resolution image (with each component of �ref set to 0.5). Then we calculate new separations for each higher resolution image, using as the reference values �ref an enlarged version of the current separations (where enlargement consists of upsampling followed by low-pass filtering). The result is a set of separations at the highest resolution that maintain the smoothness of the original color image. Smoothness comes at the cost of computing separations for the entire image pyramid, but this is only 4/3 the work of computing separations just at the highest level.
In the near future, we hope to eliminate some of the remaining artifacts from our results. In particular, we would like to eliminate the extreme desaturation of out-of-gamut hues by introducing a selective hue compression method. By using stochastic screening for our future printing experiments, we will be able to avoid the moir´e interference patterns present in traditional halftones when four or more inks are assigned different screen angles. We are also interested in the effects achievable by measuring and printing opaque inks on dark papers. There are a number of other ways in which this work can be extended. We could model metallic inks by including angular variation in the ink layering model, or capture the behavior of fluorescent inks and papers by treating reflectance and transmittance as functions of both incoming and outgoing wavelength. By substituting a model of the inks and halftoning process of ink-jet printers for our current gamut model, we could suggest custom ink choices and compute separations for these widely available devices (assuming cartridges of custom inks were available).
5.2 Separation algorithm
Our gamut mapping algorithm might be improved by performing the mapping in a perceptually uniform color space like L� a� b� or L� u� v� , as recommended by MacDonald [17] and Wolski et al. [29].
There are a plethora of continuous optimization algorithms we could apply to the separation problem. We can choose among them by
7
Montag and Fairchild [20] suggest using different gamut mapping strategies for light colors and dark colors.
[11] D. B. Judd and G. Wyszecki. Color in Business, Science, and Industry. John Wiley and Sons, New York, 1975.
We are considering a variety of changes to the way in which the optimizer chooses inks. The user could indicate to the optimizer which colors are most important by painting a weighting function over the original image; these weights would multiply each pixel’s L� a� b� distance in the objective function. We could also use the RLab color space [4] or Hunt’s color-appearance space [8] instead of L� a� b� to obtain a more accurate estimate of color differences. With more terms in the objective function, we could try to minimize the cost of the materials or their environmental impact (favoring recycled papers and soy inks), maximize the longevity of the reproduction (favoring acid-free papers and fade-resistant inks), or reduce the impact of misregistration artifacts by favoring inks similar in color to the image subject matter. As a more general extension, we might optimize not only the paper and inks, but also the gamut mapping parameters and even the choice of which images to print.
[12] Henry R. Kang. Comparisons of Color Mixing Theories for Use in Electronic Printing. In Proceedings of the IS&T/SID Color Imaging Conference: Transforms & Transportability of Color, pages 78–82, 1993. [13] Gustav Kort¨um. Reflectance Spectroscopy: Principles, Methods, Applications, chapter 4, pages 103–169. Springer, New York, 1969. [14] P. Laihanen. Colour Reproduction Theory Based on the Principles of Colour Science. In Proceedings of the International Association of Research Institutes for the Graphic Arts Industry, volume 19, pages 1–36, 1987. [15] Bruce J. Lindbloom. Accurate Color Reproduction for Computer Graphics Applications. In Proceedings of SIGGRAPH 89, pages 117– 126, 1989. [16] Yan Liu. Spectral Reflectance Modification of Neugebauer Equations. In Proceedings of the Technical Association of the Graphic Arts, pages 154–172, 1991.
As mentioned earlier, well-chosen heuristics may help to speed up the selection of inks by eliminating poor combinations before any time is spent evaluating them. We hope to accelerate the separation algorithm as well, perhaps by exploiting coherence of image colors in color space, or using a local approximation to our gamut model that is more easily inverted.
[17] Lindsay W. MacDonald. Gamut Mapping in Perceptual Color Space. In Proceedings of the IS&T/SID Color Imaging Conference: Transforms & Transportability of Color, pages 193–196, 1993. [18] Marc Mahy and Paul Delabastita. Inversion of the Neugebauer Equations. Color Research and Application, 21(6):401–411, December 1996. [19] Gabriel Marcu and Satoshi Abe. Color Designing and Simulation in Non-Conventional Printing Process. In Applications of Digital Image Processing XVII, volume 2298 of Proccedings of the SPIE, pages 216– 223, 1994.
Acknowledgments We are grateful to Safeco Insurance’s Graphics & Printing Services for their donation of time and resources. Thanks to Roger Hersch, Pat Lewis, Fr´ed´eric Pighin, and Joanna Power for helpful discussions. This work was supported by a grant from the Washington Technology Center and Numinous Technologies, an NSF Presidential Faculty Fellow award (CCR-9553199), an ONR Young Investigator award (N00014-95-1-0728), and industrial gifts from Microsoft and Pixar.
[20] Ethan D. Montag and Mark D. Fairchild. Psychophysical Evaluation of Gamut Mapping Techniques Using Simple Rendered Images and Artificial Gamut Boundaries. IEEE Transactions on Image Processing, 6(7):977–989, July 1997. [21] H. E. J. Neugebauer. Die Theoretischen Grundlagen des Mehrfarbenbuchdrucks (The Theoretical Foundation for Multicolor Printing). Zeitschrift fuer Wissenschaftliche Photographie, 36(4):73–89, 1937. Reprinted in Neugebauer Memorial Seminar on Color Reproduction, volume 1184 of Proceedings of the SPIE, pages 194–202. SPIE, Bellingham, WA, 1990.
References [1] Harold Boll. A Color to Colorant Transformation for a Seven Ink Process. In Device-Independent Color Imaging, volume 2170 of Proceedings of the SPIE, pages 108–118, 1994.
[22] Victor Ostromoukhov. Chromaticity Gamut Enhancement by Heptatone Multi-color Printing. In Device-Independent Color Imaging and Imaging Systems Integration, volume 1909 of Proceedings of the SPIE, pages 139–151, 1993.
[2] P. J. Burt and E. H. Adelson. The Laplacian Pyramid as a Compact Image Code. IEEE Transactions on Communications, 31(4):532–540, April 1983.
[23] Joanna L. Power, Brad S. West, Eric J. Stollnitz, and David H. Salesin. Reproducing Color Images as Duotones. In Proceedings of SIGGRAPH 96, pages 237–248, 1996.
[3] Lawrence Davis. Handbook of Genetic Algorithms. Van Nostrand Reinhold, New York, 1991.
[24] William H. Press, Brian P. Flannery, Saul A. Teukolsky, and William T. Fetterling. Numerical Recipes. Cambridge University Press, New York, second edition, 1992.
[4] M. D. Fairchild and R. S. Berns. Image Color-Appearance Specification Through Extension of CIELAB. Color Research and Application, 18(3):178–190, June 1993.
[25] J. L. Saunderson. Calculation of the Color of Pigmented Plastics. Journal of the Optical Society of America, 32(12):727–736, December 1942.
[5] R. S. Gentile, E. Walowit, and J. P. Allebach. A Comparison of Techniques for Color Gamut Mismatch Compensation. Journal of Imaging Technology, 16(5):176–181, October 1990.
[26] Eric J. Stollnitz. Reproducing Color Images with Custom Inks. Ph.D. thesis, University of Washington, 1998.
[6] Arthur C. Hardy and F. L. Wurzburg, Jr. Color Correction in Color Printing. Journal of the Optical Society of America, 38(4):300–307, April 1948.
[27] Maureen C. Stone, William B. Cowan, and John C. Beatty. Color Gamut Mapping and the Printing of Digital Color Images. ACM Transactions on Graphics, 7(4):249–292, October 1988.
[7] Paul Heckbert. Color Image Quantization for Frame Buffer Display. In Proceedings of SIGGRAPH 82, pages 297–307, 1982.
[28] Atsushi Takaghi, Toru Ozeki, Yoshinori Ogata, and Sachie Minato. Faithful Color Printing for Computer Generated Image Syntheses with Highly Saturated Component Inks. In Proceedings of the IS&T/SID Color Imaging Conference: Color Science, Systems and Applications, pages 108–111, 1994.
[8] R. W. G. Hunt. Revised Colour-Appearance Model for Related and Unrelated Colours. Color Research and Application, 16(3):146–165, June 1991. [9] Kansei Iwata and Gabriel Marcu. Computer Simulation of Printed Colors on Textile Materials. In Color Hard Copy and Graphic Arts III, volume 2171 of Proceedings of the SPIE, pages 228–238, 1994.
[29] M. Wolski, J. P. Allebach, and C. A. Bouman. Gamut Mapping: Squeezing the Most out of Your Color System. In Proceedings of the IS&T/SID Color Imaging Conference: Color Science, Systems and Applications, pages 89–92, 1994.
[10] Tony Johnson. A Complete Colour Reproduction Model for Graphic Arts. In Proceedings of the Technical Association of the Graphic Arts, pages 1061–1076, 1996.
8