This is the objective of dedicated software such as RepeatScout [30] or of clustering algorithms ... accumulate differences, and the seeds within the copies become smaller and multiple, se- parated by the ... However, because of the quadratic computational cost ..... Results shown here were performed on a Intel-Linux server.
Repseek, a tool to retrieve approximate from large DNA sequences G Achaz, F Boyer, EPC Rocha, A Viari and E Coissac 2002-2008 (last version may 08)
1
Introduction
The importance of genome redundancy has been strongly emphasized in the field of genome dynamics and evolution as well as in medical biology. A repeat is a sequence present twice or more with a high degree of similarity within a larger sequence (e.g. a chromosome) or set of sequences (e.g. a genome with several chromosomes). Each instance of the repeated sub-sequence is called a ’copy’ of the repeat. We use the term ”duplication” to denote any active mechanistic event that creates a repeat. Even though spurious duplication events (or recombination events between repeats) can cause severe disorders [26, 24], repeated elements remain nonetheless a very important driving force of genome evolution [28]. In that respect, the dynamics and the evolution of these redundant sequences have been studied in bacterial genomes [31, 32, 5] as well as in eukaryote genomes [3, 4, 38]. Duplication events can sometimes copy entire coding regions, giving birth to what is often referred as duplicate genes. Those duplicate genes are the raw material leading to the emergence of novel functions and have been extensively studied (for a historical review see [37]). Although the repeats we are interested in encompass a lot of known biological repeated elements (i.e. transposable elements, duplicated genes, DNA-satellites, segmental duplication, etc.) our main concern is not to identify specific families of repeats, but to extract repeats on the sole basis of their sequence similarity and without any prior consideration of their biological function. Unlike RepeatMasker [34], we do not search for already well characterized repeated elements. Furthermore, our primary goal is not to construct families of repeats. This is the objective of dedicated software such as RepeatScout [30] or of clustering algorithms [9, 29], which reconstruct families from pairs of repeats. Of course, our program can be used to feed these clustering algorithms. While there are some widely accepted methods to detect duplicate genes in a genome (for instance based on BLAST or FASTA programs), there is no firmly established technique concerning the detection of repeats in large DNA sequences. The detection of repeats is not a trivial problem and there is no satisfactory methodology available apart from recursive local alignment (using dynamic programming) of sequences with themselves [41]. Such algorithms, however, are quadratic in computation time and in memory usage and 1
cannot be used for large sequences. One way to circumvent this problem is to restrict to the Hamming distance [20, 30]. This method is very efficient but it is unable to handle insertions/deletions (indels) or scoring matrices. Another workaround consists in clustering stretches of physically close exact repeats within a single approximate repeat[31, 40]. This is however not fully satisfactory since this approach will miss the region of the repeat that lies outside of the first and last exact repeats in the cluster. Our approach, like most current methods to detect similarity in large sequences [8, 39, 23], works around the problem through a two-step strategy. First, strict repeats (repeats with neither indels nor substitutions) are detected using efficient algorithms. Second, these strict repeats are extended into larger approximate repeats (including indels or substitutions). For the sake of clarity, in the rest of the paper, we will use the term ”seed” to refer to a strict repeat and simply ”repeat” to refer to an approximate repeat (which includes strict repeats as well). Several approaches have been proposed to detect seeds in DNA sequences. One of the early ones is based on Karp, Miller and Rosenberg’s algorithm (KMR) where seeds are computed by using a doubling-size technique [17, 22, 36] leading to a O(N.logL) time and O(N ) space complexity (where N is the length of the sequence and L the length of the largest seed found). Another popular approach, implemented in the program reputer [21], uses of a suffix tree data structure leading to an O(N ) time and space complexity. Another data structure called suffix-array has been proposed more recently [25]. It shares a lot of properties with the suffix tree but is easier to construct [1]. The first construction algorithm that has been proposed [25] is actually a variant of KMR and exhibits similar same space and time complexity. More recent implementations achieve a O(N ) direct construction time [14, 18, 19] and suffix arrays now appear as a very competitive alternative to suffix trees for biological applications. Although the theoretical behavior of suffix trees is better, in practice, KMR (and early implementations of suffix arrays) still has some advantages when working on very large datasets (it uses less memory and displays a ’cache oblivious’ behavior that makes it practically very efficient on modern processors). Moreover, as shown by Soldano and colleagues [36], KMR can be easily extended to take into account a nontransitive relationship between the symbols therefore allowing to search directly for some kind of approximate repeats. Seeds are easy to compute but unfortunately not directly suitable for most biological questions. One interesting exception concerns the potential of recombination in genomes [2], which depends on the length of seeds [33]. Shortly after duplication, repeats are strictly identical, thus identifiable as seeds. However, as sequences diverge by mutation, repeats accumulate differences, and the seeds within the copies become smaller and multiple, separated by the growing number of mismatches and deletions. One is usually interested in considering these stretches of perfect and imperfect matches as a unique repeat characterized by a given percentage of identity. Such repeats are the biological objects arising from ancient duplication events. Dynamic programming is the only available method to transform seeds into larger repeats with indels and mismatches. However, because of the quadratic computational cost of this approach one should resort to a heuristic in order to align the regions flanking the repeats and to handle potentially long sequences. We propose a heuristic similar to the 2
one used in BLAST2 [8, 43] that appears very efficient in terms of memory and computation time. This approach allows us to keep the dynamic programming framework and, in particular, to use adapted scoring matrices correcting for sequence composition biases.
2
Methods DNA Sequence(s) choose L arbitrarily or set L = Lmin using Pseeds
find/import seeds with length >= L
Seeds extend seeds into repeats
set S = 0 (ignore filter) or set S = Smin using Prepeats
remove repeats with score < S
Repeats
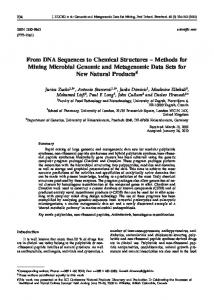
Fig. 1 – Schematic workflow of repseek. This figure represents the basic steps that are performed as repseek runs. Seeds longer than a minimum length (L) are detected and then extended into repeats using a dynamic programming framework. Statistical significance of repeats can be performed either at the seed level (more stringent but faster) or at the repeat level (less stringent but slower). Therefore a users can either used the Karlin-Ost statistics that gives a minimum seed length for a given probability (Lmin derived from Pseeds ) and the Karlin-Altschul statistics that gives a minimum repeat score for a given probability (Smin derived from Prepeats ). When the latter option is chosen, user should set the minimum seeds length well below the one given by the Karlin-Ost statistics (default is 2/3 of Lmin ).
Basically, repseek works on a two step strategy : first, it detects seeds and, then it extends them into repeats. The statistical evaluation of the repeats can be undertaken either on seed length using Karlin and Ost statistics [16] (Pseeds in figure 1) or on repeats score using Karlin and Altschul statistics [15] (Prepeats in figure 1). Using the ”statistics on repeat” is interesting only when the minimum length given for seed detection is much smaller than the one given by the ”statistics on seed” ; in this case, repseek detects by default seeds with a minimum length of L ≥ 2/3 × Lmin . As it will be illustrated below, 3
detecting only significant seeds is faster but more stringent (only recent repeats are detected), while detecting significant repeats is slower though less stringent (older repeats can be retrieved). One should note that both statistics can be used for the detection of repeats within a single sequence or between two sequences. First, we recall the statistical framework aimed at defining a minimal length for significant seeds or a minimum score for repeats, we then describe the method used to identify seeds and, finally, we describe the derivation of the dynamic programming approach to extend the seeds into repeats, focusing on the construction of substitution matrices to take into account nucleotide composition.
Statistical threshold for seeds length and repeats score One of the major concerns of a repeat-detection strategy is designing a statistical threshold beyond which one can assume that a repeat is not the result of a simple random arrangement of nucleotides. Here, we propose two alternative solutions that associate a given probability to either a seed length (Lmin ) or a repeat score (Smin ). We would like to emphasize that the former is with no doubt more stringent than the latter one. Hence the seeds statistics will select only very similar repeats, whereas the repeats statistics will allow for more degenerate repeats. Statistics of seed length For seeds, an analytical solution was described by Karlin and Ost [16] and used in previous works [31, 4]. It is usually expressed as the probability P (Llongest−seed ≥ L) that the longest seed observed in a random genome of same size and nucleotide composition is longer than L. Reciprocally, by imposing a statistical threshold (e.g. P = 0.001), one can calculate the smallest length Lmin above which no such seed is expected to occur by chance in a random genome. An equivalent statistics is available for the analysis of seeds between two genomes. Note that Lmin increases with the length of the sequence and with the deviation of the nucleotide composition from 50% G+C. This is because larger genomes will have larger seeds by chance, and because genomes with very unbalanced nucleotide composition have larger seeeds rich in the most abundant nucleotides. In Bacteria, Lmin ranges from 21 to 27 nucleotides [31] and from 21 to 28 in eukaryote chromosomes [4]. Since Lmin is usually not an integer, we use the closest integer to this value as the minimal significant length for seeds. Once Lmin is evaluated, the repeat detection step can be undertaken. All pairs of seeds of length equal or longer than Lmin are detected in the sequence. In this approach, we assume that, at this stringency, all seeds are significant and thus need to be further extended into repeats. It is important to note that since the filtering is done at the seed level (i.e. before repeats are computed) one takes the risk of missing some significant repeats composed of very short (and therefore non significant) seeds that are part of a large (hence possibly significant) repeat.
4
Smin
Smin
31
31
N = 1Mb
29
29
27
27
25
25
23
23
21
19
17
17
15 5
10
15
20
25
30
dGC = 05
21
N = 10kb
19
0
dGC = 30
15 1kb
35
dGC (bias in composition)
10kb
100kb
1Mb
N (sequence length)
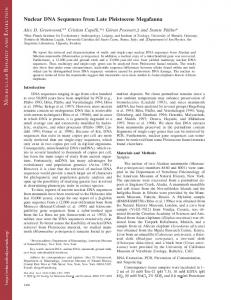
Fig. 2 – Computation of Smin using both simulation and analytical methods. This figure shows how the minimum score (Smin ) used as threshold beyond which a repeat is statistically significant varies as a function of both sequence length (N ) and sequence composition (dGC = |GC%−50|). Smin was computed from both simulated random sequences (open squares) and from analytical derivation (lines). Simulation results are issued from 10,000 random sequences. This figure also illustrates how accurate is the instantaneous analytical approximation as compared to the time-consuming randomization method.
Statistics of repeat score To compute a probability for a repeat score, we used the method proposed by Waterman and Vingron [42]. This method estimate the probability P (Sbest−repeat ≥ S) that the score of the best local alignment observed between two random sequences of size n and m is larger than a given score S. This probability can be well approximated (when the expected score tS of the scoring matrix is negative and when gap penalties are large enough) by P = e−γmne [15], where m and n are the size of both sequences and where the product mn represents the pertinent number of cells in the score matrix of size [m n]. In the context of sub-optimal local alignment within a single sequence of size N , only the upper half of the [N N ] matrix should be considered and this product becomes N ×(N −1)/2. Waterman and Vingron [42] showed that if the probability is expressed as a log(−log(P )) = log(γmn) + log(p) × S, the parameters log(γ) and log(p) can be easily estimated by linear regression. The regression is performed between the scores of the local alignment between random sequences (of same size and composition) and their frequency distribution. We estimated those two parameters for a range of sequence lengths (1kb, 10kb, 100kb and 1Mb) and compositions (dGC = |GC% − 50| ranging from 0 to 35 by step of 5%), by randomizing 10,000 random sequences for each combination of length and composition and by detecting the best repeat inside each random sequence. We then used a least-square regression to estimate log(p) and log(γ) for a given combination of log(N ) and dGC . Using a downward step method with a second degree polynomial of both dGC and log(N ), we were able to do compute robust regressions (R2 = 0.986; P � 10−4 for log(γ) and R2 = 0.901, P � 10−4 for log(p)) . Equations are the following :
5
log(γ) = −0.0029688 × d2GC + 0.0727745 × dGC − 0.0309583 × log(N )2 (1) −3 −3 −4 2 log(p) = 1.789.10 × dGC − 2.409.10 × dGC − 6.838.10 × log(N ) − 1.060 (2) Using these equations, we can compute analytically both log(p) and log(γ) for any sequence solely based on its dGC and log(N ). Hence, we are able to associate almost instantaneously a chosen probability with a minimum score Smin above which no repeats are expected to be found in random sequences. A comparison of the Smin computed from either simulated random sequences or from above analytical calculations reveals that both methods give very similar results (Figure 2).
Detection of seeds and extension to repeats Looking for all possible seeds in a sequence is not of interest since many of them will overlap (by definition, all the subwords of a given seed are themselves seeds). One should therefore focus only to ’maximal seeds’ [13] ; a maximal seeds is simply a seed which copies cannot be extended to the right or to the left (for instance in ”abcdabc”, ”abc” is a maximal seed but ”ab” or ”bc” are not). As mentioned before, Suffix trees and Suffix arrays are available for computing these maximal repeats [1, 21]. Some authors also proposed an alternate data structure called the ’factor oracle’ [7]. However the algorithm based on this structure [23] to search for seeds is a heuristic (by contrast to suffix trees, arrays or KMR which are exact algorithms). As we shall illustrate later, this heuristic appears to miss a lot of valid seeds and is therefore not applicable to our purposes. Repseek can accept as input a list of such seeds produced by any of these programs. However, for simplicty, it also provides an exact builtin seeds detection algorithm, based on the KMR algorithm [17, 22, 36] that proves to be very efficient in practice (Table 1). Given a sequence, KMR solves the two following problems : (1) find all seeds of a given length L and (2) find all seeds of largest length Lmax (where Lmax is unknown). The KMR approach relies on the observation that a seed of length L can be decomposed in two consecutive seeds of length L/2. Therefore the KMR ’doubling technique’ can be summarized as follows : first compute seeds of length 1 (i.e. nucleotides), then merge them to compute seeds of length 2, then merge them to get seeds of length 4 and so on up to L (problem 1) or up to the point where there is no more seeds (problem 2). If L or Lmax is not a power of 2 there is an additional step to reach the proper length. Each merging operation takes O(N ) operations and problem 1 is therefore solved in time O(N.logL) (and O(N ) space). In practice since L is small (see section ’statistical thresholds for seeds length’) this approach is very efficient. The only problem is that we do not want only the seeds of a given length L but all the seeds of length greater than Lmin (i.e. in the range [Lmin , Lmax ] with Lmax, the length of the unknown longest seed). This can be done by using several techniques (including KMR itself). In practice, since the number nmin of exact repeats of length Lmin is expected to be small (indeed, for random genomes nmin tends to 0), a simple enumeration and merging of pairs (running in O(nmin2 )) is sufficient to this purpose. 6
In these conditions one can use the doubling technique up to Lmin and then to increase the length one by one up to Lmax (note that the maximality condition of each seed can be efficiently tested each time the length is incremented). With this technique, the final time complexity is therefore O(N × log(Lmin )) + O(n × (Lmax − Lmin )) where n is the number of seeds found at the end of the doubling stage i.e. the number of seeds of length Lmin. In the worst case, this complexity may become quadratic, but it is important to remember that Lmin has been determined in such a way that n remains small (for random genomes n tends to 0) and the practical running times are very competitive compared to other techniques as it will be shown later. One of the main advantage of KMR is that it can be implemented in a very memory efficient way. Our current implementation requires 8N bytes (i.e. 2 integer arrays) whereas the best implementations of suffix trees usually require at least 12N [12]. The advantage over KMR is that, once constructed, it can provide immediately the seeds of all sizes. The final time complexity is therefore O(N × log(Lmax )) + O(n) (if one assumes than the result size is O(n)). We have made a further improvement over the usual KMR that has been implemented in repseek : instead of initializing the doubling technique with words of length 1, one can start with any word length providing that the seeds can be easily computed for this starting length. In our implementation, we first use a hashing step followed by a lexicographic bucket sort [6] that allows us to start KMR with seeds up to size log4 (N ) in time O(N ). In practice, this speeds up the running time by a factor two or more. Finally, as we mention before, we are interested in listing all pairs of copies before proceeding to their extension. This is obviously done in O(n2 ) operations ?for each family, we have to list all pairs ?. Again, since n remains small, this step is not time limiting. Extension of seeds by dynamic programming In this second step, all pairs of copies are extended on both sides, accepting substitutions or indels, by using a dynamic programming approach [27, 35]. The edit matrix is filled as in the classical local alignment procedure, but the optimal path is anchored at the seeds extremities and ends up at a maximum of the matrix. To reduce the time and memory complexity computation requirements, we use a heuristic similar to the one introduced in BLAST2 [8, 43]. In this heuristic only the scores close enough to the current best score are evaluated. We stop evaluating scores, when these drop below the current best score minus a chosen value Xg (default is 30). This parameter allows to tune the efficiency/accuracy tradeoff. On one hand, large values of Xg increase the time and memory requirements back to the original full dynamic programming algorithm. On the other hand, small values of Xg decrease the accuracy of the alignment. Seeds are extended at both ends and the final score of the repeat is the sum of the scores of both alignments and the seed. At this stage, we also compute the similarity between the two copies as the number of matches divided by the total length of repeat. It is important to note that a repeat may be based on more that one seed. In this case, the extension of the seeds will lead to the same final repeat. Hence, after the extension of a seed we have to discard the remaining seeds belonging to the path of the current alignment. 7
b) Local alignment
c) BLAST2-like alignment
sequence 2
sequence 1
sequence 1
sequence 2
sequence 2
sequence 1
a) Global alignment
Fig. 3 – Schematic representation of three types of alignment by dynamic programming. Each cell correspond to the score of a sub-alignment that has to be evaluated. The figure shows the scores that have been computed at the end of the algorithm : grey cells corresponds to score actually computed whereas white cells corresponds to score that have not been computed. The black thick path represents the best alignment found by the algorithm. In global alignment (a), all scores are evaluated and the path of interest is going from the upper-left to the lower-right cells. In local alignment (b), all scores are evaluated but the location of the best path is unknown before the entire matrix has been filled. In the BLAST2-like heuristic used in repseek, only a small fraction of the scores are actually evaluated. The resulting path always starts from the upper-left cell.
Finally, if two or more repeats are located at the same positions, only the one with the highest score is kept. By default, we chose to consider two repeats to be the same if 0.9 (90%) of the lengths of each of their copies are located at the same chromosomal position. If this value is set to 1, only repeats having exactly the same positions are filtered whereas if this value is set to 0, an overlap of 1bp on both copies is enough. A matrix to correct for nucleotide composition bias As mentioned in previous studies [5, 2], the use of a simple identity substitution matrix creates biases for sequences where the relative frequency of each nucleotide is not 1/4. In highly biased sequences, this results in longer alignments, composed of the most abundant nucleotides. Therefore, it appears important to design specific substitution matrices which correct for the nucleotide composition bias. To this purpose, we took several genomes with very different G+C contents and generated for each of them 10 random chromosomes of the same length and nucleotide composition. We then compared the effect of two different substitution matrices upon the mean length of approximate repetitions (Figure 4). The identity matrix (label ”identity” in Figure 4) applies no correction ; it gives a score of +1 for matches and -1 for mismatches and a score of +1/4 for a match between N and any other nucleotide : – Subst(i, j) = σ(i, j), where σ(i, j) = +1 if i = j or σ(i, j) = −1 if i 6= j – Subst(N, i) = 1/4 The other matrix (labeled ”log” in Figure 4) take into account the frequency of each 8
100 mean for matrix id
mean (or stderr) of repeats length
mean for matrix log stderr for matrix id
46
stderr for matrix log
22
10
4.6
2.2
1 0
5
10
15
20
25
30
dGC (bias in composition)
Fig. 4 – Bias in repeats length due to the sequence composition. The mean (continuous lines) and the standard error (dashed lines) of repeats length is given as a function of sequence composition. For each composition (dGC = |GC% − 50| in x-axis), we constructed 10 random sequences of 1 Mb and computed their repeats using the strategy repseek with an Lmin of 15. The alignments (to extent seed into repeats) were done either using an identity matrix (black lines) or a matrix based on the log of the frequency of nucleotides (grey lines).
nucleotide : – Subst(i, j) = 1/2 × σ(i, j) × log4 (pi × pj ), where σ(i, j) = −1 if i = j and σ = +1 if i 6= j. – Subst(N, i) = pi × Subst(i, i) = pi × log4 (pi ) The gap opening and extension weights default to : – GapOpen = -4 – GapExt = -1 In order to test the power of correction of the log matrix, we devised artificial random chromosomes of size 1 Mb with different bias in GC content (dGC = |GC% − 50| ranging from 0 to 30). Results (Figure 4) show that for any bias, the log matrix has less variance than the identity matrix. This effect becomes very strong for large biases in GC content (dGC > 15). We then retained the log matrix in the current implementation of repseek. We would like to emphasize that we pre-computed the repeats probabilities in random sequences using this scoring system. Hence, all statistics associated with repeats should not be trusted whilst using a different scoring system than the log matrix and the default 9
gap opening and extension penalties. On the contrary, statistics on seeds do not depend upon the scoring system and can be used whatever the chosen scoring system is.
3
Repseek output options
The ”type” of the repeat Each repeat is characterized by the relative orientation of the two copies, i.e. direct or inverted, and the distance between the two copies (often referred to as the spacer length). Direct repeats can be overlapping (spacer length < 0), tandem (spacer length = 0), close (spacer length < 1 kb) or distant (spacer length > 1 kb). Inverted repeats can be palindromic, close or distant. Distance between repeats in only meaningful for repeats in the same chromosome. For repeats in different chromosomes, the difference between the distances to the closest extremity of the chromosome has been shown to be of some importance [10] and we output this value.
Repeat families and R-values An important characteristic of a repeat is the size of the potential family it belongs to. For example, it may be important to know if a repeat belongs to a very large family (e.g. Alu retro-elements in the human genome) or is just a unique pair. We compute the degree of redundancy of repeats, which we will call the R-value, at each position in the sequence. The R-value is defined as the number of times a position appears in the repeats dataset. The R-table is simply the sequence of R-values for all positions and can be printed as an option. This table is computed as it is done in PILER [11]. The mean-R (or mode-R) is simply the average (mode) R-value for each sequence position involved in a repeat. Repseek offers the possibility to keep only repeats within a given range of R-values.
Removing low complexity overlapping seeds Low-complexity regions often give rise to many highly similar repeats. Those repeats are all overlapping but may be different in size or in position. If the user is not interested in those repeats, there is no need to keep them for further alignment. Repseek thus offer an option to filter out such overlapping seeds. This option removes all but the longest seed in each overlapping group.
Masking regions We propose two options to mask parts of the sequence. One consists in replacing parts of the sequence (indicated in a table) by X’s. Those masked regions will not be further considered neither for seeds detection nor for repeats extension. Another option masks some regions for seed detection, but not for repeats extension. This latter option can be
10
used for example to mask some overabundant transposable elements in ”higher” eukaryote genomes if users want to exclude them from the analysis but want to keep a repeat that would encompass them.
4
Performance
In the following, we first report the time and memory consumptions of the program repseek. We then explore the pertinence of similarity searching in DNA sequences. Finally, we evaluate the practical performances of the approach on biologically relevant sequences and further discuss the program’s behavior to help the user at choosing the proper parameters. Chromosome name1 size Lmin (Mb) (bp) Myge 0.58 23 Esco 4.6 24 Melo 7.0 26 Cael 3 13.8 27 Cael 5 20.9 28
FORRepeats mem cpu n (Mby) (d+i) 100bp) I 15.08 297 II 15.28 300 III 13.78 275 IV 17.49 301 V 20.92 328 X 17.72 260
Lmin 27 27 27 28 28 28
statistics on seeds1 detected families ≥ 50% elts ≥ 80% elts 0.70 0.39 0.66 0.40 0.67 0.40 0.61 0.36 0.66 0.33 0.58 0.25
Smin 33.07 33.05 32.96 33.36 33.51 33.32
statistics on repeats1 detected families ≥ 50% elts ≥ 80% elts 0.89 0.70 0.86 0.65 0.88 0.74 0.88 0.66 0.91 0.70 0.82 0.56
Tab. 4 – Ability to retrieve large annotated repeated elements. This table shows the fraction of the families of so-called ’repeated elements’ (as defined by Repeat Masker) that is detected by repseek. The fraction is given for the families where 21 (or 54 ) of all elements are detected and related by a two-by-two relationship to the other elements of the families. 1 Same than in previous Tables.
As a biological control, we used the sequences annotated as ”repeated” by RepeatMasker [34] in the genome of C. elegans (wormbase version WS132). For each chromosome, we computed the number and the localization of all repeats using both statistics. To check whether repseek was able to retrieve the so-called repeated elements families, we used the output of repseek to construct families of repeated elements by a transitive naive approach. 14
If two pairs of repeats (remember that repseek only output maximal pairs) overlap for at least 50% of their copies, they are pooled together in the same family. At the end, we compared our families with the families of CeRep elements annotated by RepeatMasker (of at least 100bp and with more than one copy on the same chromosome). Results (Table 4) show that, if repeats statistics is used, we were able to retrieve most of the families of repeated elements. We considered a CeRep family to be retrieved when 80% of its elements were located in sequences belonging a same repseek family. We also report results when a CeRep family was completed at 50%. Results confirm the intuition that the lower the minimum seed length, the higher of the number of reconstructed families (compare results from both statistics). C. elegans chromosome
I II III IV V X
size 15.08 15.28 13.78 17.49 20.92 17.72
Lmin 27 27 27 28 28 28
Smin 34.44 34.38 34.34 34.87 34.94 34.76
statistics on seeds1 CeRep No annotation repeated single repeated single 0.12 0.03 0.10 0.75 0.10 0.02 0.12 0.76 0.12 0.03 0.09 0.76 0.09 0.03 0.11 0.77 0.11 0.02 0.14 0.73 0.06 0.03 0.05 0.86
statistics on repeats1 CeRep No annotation repeated single repeated single 0.14 0.01 0.15 0.70 0.11 0.01 0.17 0.71 0.14 0.01 0.13 0.72 0.11 0.01 0.16 0.72 0.13 0.01 0.20 0.66 0.08 0.01 0.08 0.83
Tab. 5 – Ability to retrieve large annotated repeated elements. This table displays how the chromosomal sequence is distributed between the annotated repeated elements (CeRep defined by RepeatM asker) and the sequences that can be label as repeated using repseek. This Table highlights that half of the repeated elements are not detected using a method based on known repeated elements (i.e. RepeatMasker). 1 Same than in previous Tables.
C. elegans chr. I II III IV V X
Non-repeated region intergenic intronic exonic 0.394 0.304 0.302 0.456 0.258 0.288 0.415 0.286 0.299 0.491 0.269 0.24 0.494 0.233 0.274 0.538 0.253 0.209
annotated repeats (CeRep ) intergenic intronic exonic 0.436 0.557 0.007 0.551 0.436 0.013 0.442 0.54 0.017 0.581 0.414 0.005 0.553 0.436 0.011 0.662 0.316 0.022
repeats found by repseek only intergenic intronic exonic 0.355 0.422 0.224 0.391 0.295 0.314 0.372 0.447 0.182 0.475 0.272 0.253 0.381 0.233 0.386 0.548 0.216 0.236
Tab. 6 – Localization of repeated sequences relative to genes. This table displays where are located i) non-repeated sequences, ii) sequences annotated as repeated by RepeatMasker or iii) by repseek only (see Table 5).
Interestingly, we also computed the fraction of the different chromosomes that were spanned by the repseek repeats in relation with the fraction of the chromosomes spanned by annotated repeated elements (CeRep as defined by RepeatMasker). Results (Table 5) shows that not only most of the annotated elements are located in sequences characterized as repeated by repseek, but that only a half of the sequences we found repeated are annotated by RepeatMasker. This shows that we are able to unravel previously uncharacterized repeated regions solely based on their redundancy on the same chromosome. To further characterized where those newly detected repeats are located, we compared their position to the exonic, intronic and intergenic region. Results (Table 6) shows that whereas repeats 15
already characterized by RepeatMasker are almost excluded from coding sequence, those previously uncharacterized repeats span the whole chromosome sequence. ”Exonic” repeats may be related to duplicated genes, but ”intergenic” and ”intronic” ones are certainly new repeated elements that can be further investigated –although low-copy generic repeats in eukaryotes have been previously studied (see for example [4, 38])–.
5
Concluding remarks
We propose a simple and fast method to detect seeds and repeats within or between two large DNA sequences. The major interest of the program is its capacity to find large degenerate repeats on a meaningful statistical framework. As for approximate repeats, we show that the memory consumption remains modest, therefore allowing large sequences to be processed. The computation times do not simply depend upon the length of the sequences but also upon their internal redundancy. Nevertheless they remain acceptable even for long sequences. The most important parameter of the method is the minimum seed length used in the first step. The value of this parameter depends upon the kind of repeats (old or recent) that are searched for. In order to help the user setting this parameter properly, we performed several simulations and comparisons to biologically relevant repeats. These results indicate that the default minimum length, as defined by the Karlin-Ost statistics, is acceptable for recent repeats but not for older (more divergent) repeats. In this latter case, a shorter seed length should be used and the statistics proposed by KarlinAltschul is more appropriate. This statistics has, in theory, not the drawback of a minimum seed size algorithm, though to stay in acceptable computation time, one need to choose a not too small seed size. All the C sources of repseek are publicly available and users are more than welcome to improve them or add new options that could be incorporated in forthcoming releases.
R´ ef´ erences [1] M. I. Abouelhoda, S. Kurtz, and E. Ohlebusch. The enhanced suffix array and its applications to genome analysis. In Second Workshop on Algorithms in Bioinformatics, pages 449–463. Lecture Notes in Computer Science 2452, Springer-Verlag, 2002. [2] G. Achaz, E. Coissac, P. Netter, and E. P. Rocha. Associations between inverted repeats and the structural evolution of bacterial genomes. Genetics, 164(4) :1279–89, 2003. [3] G Achaz, E Coissac, A Viari, and P Netter. Analysis of intrachromosomal duplications in yeast saccharomyces cerevisiae : a possible model for their origin. Mol Biol Evol, 17(8) :1268–1275, Aug 2000. [4] G. Achaz, P. Netter, and E. Coissac. Study of intrachromosomal duplications among the eukaryote genomes. Mol Biol Evol, 18(12) :2280–8, 2001.
16
[5] G. Achaz, E. P. Rocha, P. Netter, and E. Coissac. Origin and fate of repeats in bacteria. Nucleic Acids Res, 30(13) :2987–94, 2002. [6] A. V. Aho, J. E. Hopcroft, and J. D. Ullman. The Design and Analysis of Computer Algorithms. Addison-Wesley, 1974. [7] C. Allauzen, M. Crochemore, and M. Raffinot. Factor oracle : A new structure for pattern matching. In 26th Conference on Current Trends in Theory and Practice of Informatics on Theory and Practice of Informatics, pages 295–310. Springer-Verlag, 1999. [8] S. F. Altschul, T. L. Madden, A. A. Schaffer, J. Zhang, Z. Zhang, W. Miller, and D. J. Lipman. Gapped blast and psi-blast : a new generation of protein database search programs. Nucleic Acids Res, 25(17) :3389–402, 1997. [9] Z. Bao and S. R. Eddy. Automated de novo identification of repeat sequence families in sequenced genomes. Genome Res, 12(8) :1269–76, 2002. [10] E. Coissac, E. Maillier, and P. Netter. A comparative study of duplications in bacteria and eukaryotes : the importance of telomeres. Mol Biol Evol, 14(10) :1062–1074, 1997. [11] R C Edgar and E W Myers. Piler : identification and classification of genomic repeats. Bioinformatics, 21 Suppl 1 :152–158, Jun 2005. [12] R. Giegerich, S. Kurtz, and J. Stoye. Efficient implementation of lazy suffix trees. In Third Workshop on Algorithmic Engineering (WAE99), pages 30–42. Lecture Notes in Computer Science 1668, 1999. [13] D. Gusfield. Algorithms on Strings, Trees, and Sequences : Computer Science and Computational Biology. Cambridge University Press, 1997. [14] J. Karkkainen and P. Sanders. Simple linear work suffix array construction. In Internat. Colloq. Automata, Languages and Programming, pages 943–955, 2003. [15] S Karlin and S F Altschul. Applications and statistics for multiple high-scoring segments in molecular sequences. Proc Natl Acad Sci U S A, 90(12) :5873–5877, Jun 1993. [16] S. Karlin and F. Ost. Maximal segmental match length among random sequences from a finite alphabet. In L. M. L. Cam and R. A. Olshen, editors, Berkeley conference in honor of Jerzy Neyman and Jack Kiefer, volume 1, pages 225–243, New-York, 1985. Association for Computing Machinery. [17] R. M. Karp, R. E. Miller, and A. L. Rosenberg. Rapid identification of repeated patterns in strings, trees and array. In 4th annual ACM symposium theory of computing, pages 125–136. ACM, 1972. [18] D. K. Kim, J. S. Sim, H. Park, and K. Park. Linear-time construction of suffix arrays. In Fourteenth Annual Symp. Combinatorial Pattern Matching, pages 186–199, 2003. [19] P. Ko and A. Srinivas. Space efficient linear time construction of suffix arrays. In Fourteenth Annual Symp. Combinatorial Pattern Matching, pages 200–210, 2003.
17
[20] S. Kurtz, E. Ohlebusch, C. Schleiermacher, J. Stoye, and R. Giegerich. Computation and visualization of degenerate repeats in complete genomes. In Int Conf Intell Syst Mol Biol, volume 8, pages 228–38, 2000. [21] S. Kurtz and C. Schleiermacher. Reputer : fast computation of maximal repeats in complete genomes. Bioinformatics, 15(5) :426–427, 1999. [22] A. M. Landraud, J. F. Avril, and P. Chretienne. An algorithm for finding a common structure shared by a family of strings. In IEEE transactions on pattern analysis and machine intelligence, volume 11, pages 890–895, 1989. [23] A. Lefebvre, T. Lecroq, H. Dauchel, and J. Alexandre. Forrepeats : detects repeats on entire chromosomes and between genomes. Bioinformatics, 19(3) :319–26, 2003. [24] J. R. Lupski. Genomic disorders : structural features of the genome can lead to dna rearrangements and human disease traits. Trends Genet, 14(10) :417–22, 1998. [25] U. Manber and G. Myers. Suffix arrays : a new method for on-line string searches. SIAM Jounal Comput., 22(5) :935–948, 1993. [26] R. Mazzarella and D. Schlessinger. Duplication and distribution of repetitive elements and non-unique regions in the human genome. Gene, 205(1-2) :29–38, 1997. [27] S. B. Needleman and C. D. Wunsch. A general method applicable to the search for similarities in the amino acid sequence of two proteins. J Mol Biol, 48(3) :443–53, 1970. [28] S. Ohno. Evolution by gene duplication. Springer-Verlag, Heidelberg, 1970. [29] P. A. Pevzner, H. Tang, and G. Tesler. De novo repeat classification and fragment assembly. Genome Res, 14(9) :1786–96, 2004. [30] A.L. Price, N.C. Jones, and P.A. Pevzner. De novo identification of repeat families in large genomes. In Proceedings of the 13 Annual International conference on Intelligent Systems for Molecular Biology, 2005. [31] E. P. Rocha, A. Danchin, and A. Viari. Analysis of long repeats in bacterial genomes reveals alternative evolutionary mechanisms in bacillus subtilis and other competent prokaryotes. Mol Biol Evol, 16(9) :1219–30, 1999. [32] D. Romero, J. Martinez-Salazar, E. Ortiz, C. Rodriguez, and E. Valencia-Morales. Repeated sequences in bacterial chromosomes and plasmids : a glimpse from sequenced genomes. Res Microbiol, 150(9-10) :735–43., 1999. [33] P. Shen and H. V. Huang. Homologous recombination in escherichia coli : dependence on substrate length and homology. Genetics, 112(3) :441–57, 1986. [34] A.F.A. Smit, R. Hubley, and P. Green. Repeatmasker open-3.0, 1996-2004. [35] T. F. Smith and M. S. Waterman. Identification of common molecular subsequences. J Mol Biol, 147(1) :195–7, 1981. [36] H. Soldano, A. Viari, and M. Champesme. Searching flexible repeated patterns using a non transitive relation. Pattern recognition letters, 16(3) :233–246, 1995. 18
[37] J S Taylor and J Raes. Duplication and divergence : the evolution of new genes and old ideas. Annu Rev Genet, 38 :615–643, 2004. [38] E E Thomas, N Srebro, J Sebat, N Navin, J Healy, B Mishra, and M Wigler. Distribution of short paired duplications in mammalian genomes. Proc Natl Acad Sci U S A, 101(28) :10349–10354, Jul 2004. [39] P. Vincens, L. Buffat, C. Andre, J. P. Chevrolat, J. F. Boisvieux, and S. Hazout. A strategy for finding regions of similarity in complete genome sequences. Bioinformatics, 14(8) :715–25, 1998. [40] N. Volfovsky, B. J. Haas, and S. L. Salzberg. A clustering method for repeat analysis in dna sequences. Genome Biol, 2(8) :RESEARCH0027, 2001. [41] M. S. Waterman and M. Eggert. A new algorithm for best subsequence alignments with application to trna-rrna comparisons. J Mol Biol, 197(4) :723–8, 1987. [42] M S Waterman and M Vingron. Rapid and accurate estimates of statistical significance for sequence data base searches. Proc Natl Acad Sci U S A, 91(11) :4625–4628, May 1994. [43] Z. Zhang, P. Berman, and W. Miller. Alignments without low-scoring regions. J Comput Biol, 5(2) :197–210, 1998.
19