Hindawi Publishing Corporation Journal of Polymers Volume 2014, Article ID 376754, 12 pages http://dx.doi.org/10.1155/2014/376754
Research Article New Semi-IPN Hydrogels Based on Cellulose for Biomedical Application S. K. Bajpai1 and M. P. Swarnkar2 1
Polymer Research Laboratory, Department of Chemistry, Government Model Science College, Jabalpur, Madhya Pradesh 482001, India 2 Department of Chemistry, Kymore Science College, Kymore, Katni, Madhya Pradesh 483880, India Correspondence should be addressed to S. K. Bajpai;
[email protected] Received 20 December 2013; Revised 20 February 2014; Accepted 6 March 2014; Published 22 April 2014 Academic Editor: Dirk Kuckling Copyright © 2014 S. K. Bajpai and M. P. Swarnkar. This is an open access article distributed under the Creative Commons Attribution License, which permits unrestricted use, distribution, and reproduction in any medium, provided the original work is properly cited. Cellulose pulp, obtained from a paper industry, has been dissolved in PEG/NaOH system and the resulting solution has been polymerized in the presence of monomer acrylic acid (AA) and crosslinker N,N methylene bisacrylamide via free radical polymerization. The Cell/PEG/poly (SA) ternary semi-IPN hydrogel, so prepared, was characterized by FTIR and TG analysis. The dynamic water uptake of various hydrogels, having different compositions, was investigated in the physiological buffer of pH 7.4 at 37∘ C. The various hydrogels exhibited chain-relaxation controlled swelling behavior. The uptake data was best interpreted by Schott kinetic model. The various diffusion coefficients, that is, initial (𝐷𝑖 ), average (𝐷ave ), and late time (𝐷𝐿 ), were also calculated using the dynamic water uptake data. The hydrogels showed fair pH and salt-dependent swelling behavior.
1. Introduction Cellulose is one of the most abundant renewable organic materials with annual production of about 5 × 10¹¹ metric tons [1]. Cellulose is a linear syndiotactic homopolymer composed of D-anhydroglucopyranose units, which are linked by 𝛽-(1 → 4)-glycosidic bonds. This biopolymer exhibits some excellent properties such as mechanical robustness, biodegradability, hydrophilicity, and biocompatibility [2]. These properties are mainly responsible for extensive use of cellulose in a wide spectrum of applications that include pharmacy, agriculture, medical science, industries, and so many other related branches. Some of the major applications include water reservoirs in agriculture [3], body water retainers [4], ocular bandages [5], artificial cartilage [6], controlled drug delivery [7, 8], scaffolds for regenerative medicine [9], stomach bulking agents [10], and wound dressings [11]. Most of the applications of cellulose-based hydrogels, mentioned above, exploit water absorption property of cellulose and so it is essential to have full control on the swellability of this biopolymer in these applications. But insolubility of cellulose in water (due to extensive inter- and intramolecular
H-bonding between O and H atoms of cellulose) and lack of ionizable functional groups in cellulose backbone are the major barriers that must be crossed to make this polymer useful in various fields. In recent past, several solvent systems have been used for dissolution of cellulose in effective manners. These include NaOH-urea/thiourea system [12] and ionic liquids [13], which are limited to laboratory use only due to volatility, toxicity, and high cost. In addition, the introduction of desired functionality into cellulose backbone is usually achieved by its chemical modification, which is carried out on alcoholic hydroxyls in each of its AGUs under practical relevance. This sometimes compromises with the basic properties of cellulose. Recently, a new solvent system consisting of aqueous solution of poly (ethylene glycol) (PEG) and NaOH has been reported for dissolution of cotton linters to prepare cellulose fibers [14]. This newly developed solvent system enabled us to think that addition of a suitable monomer into dissolved cellulose in PEG/NaOH system, followed by free radical induced polymerization, could yield a ternary polymeric hydrogel system with desirable properties like pH and salt sensitivity. Poly (ethylene glycol) is a water soluble
2 biocompatible polymer and has been used extensively in biomedical fields [15]. The Food and Drug Administration (FDA), USA, has approved PEGylated agents for parenteral or topical administration and as a component of various foods, cosmetics, and drug delivery systems, such as liposomes and nasal sprays [16]. In the light of the above-mentioned facts, we hereby report synthesis and water absorption behavior of semiIPN hydrogel system, comprising of Cell, PEG, and sodium acrylate (SA). The system is not only biocompatible but it also exhibits fair pH and salt sensitive water absorption behavior. Moreover, the presence of three polymers could make a better control over the swelling responses of this hydrogel system.
2. Experimental 2.1. Materials. Cellulose pulp was obtained from a local paper industry (Orient Paper Mill, Amlai, Shahdol, Madhya Pradesh). The monomer acrylic acid (AAc), crosslinker N,N methylene bisacrylamide (MB), and initiator potassium per sulphate (KPS) were obtained from Merck Chemical Industry, Mumbai, India, and were analytical grade. Poly ethylene glycol l (PEG) with molar masses of 200, 4000, and 6000 were supplied from Research Lab (Pune, India). The other chemicals such as H2 SO4 , NaOH, sodium dihydrogen phosphate, and acetic acid were obtained from Hi Media Chemicals, Mumbai, India. 2.2. Methods 2.2.1. Preparation of Microcrystalline Cellulose (MCC) from Pulp. The cellulose pulp (CP) was acid hydrolyzed using H2 SO4 solution (64% wt/vol) to yield microcrystalline cellulose (MCC) powder following the method given elsewhere [17]. 2.2.2. Dissolution of MCC in PEG/NaOH Solvent System. A precalculated quantity of MCC powder was mixed into 100 mL of aqueous solution, containing PEG (6% wt/vol) and NaOH (8% wt/vol). The dispersion was allowed to be put in Deep Freezer (Voltas, India) at −5∘ C for a period of 24 h. The solid frozen mass, so obtained, was kept at room temperature under vigorous stirring for a period of 2 h. The resulting transparent solution was filtered with ordinary filter paper and was used to prepare hydrogels. 2.2.3. Preparation of Cell/PEG/Poly (SA) Semi-IPN Hydrogels. The solution, obtained in the above step, was used to prepare ternary hydrogel system. In brief, preparation of a representative sample may be described as follows: to 5 mL of cellulose solution, 10.63 m mol of monomer AAc, 260 𝜇mol of crosslinker MB, and 200 𝜇mol of initiator KPS were added and the mixture was stirred vigorously to ensure complete dissolution of all the components. The reaction solution was now transferred into test tubes (id 12.5 mm) and kept in electric oven (Tempstar, India) at 60∘ C for 2 h. After the polymerization was over, the resulting semitransparent hydrogels were taken out of test tubes, cut
Journal of Polymers into slices (thickness 2.6 mm), and then placed in distilled water for 4 h to remove unreacted salts left within the polymers. Finally, the hydrogel discs were taken out and dried in a dust-free chamber until they showed constant weights. In all eight hydrogels, samples were prepared with varying contents of cellulose, sodium acrylate, and crosslinker MB. Moreover, hydrogels with PEG of varying molecular masses were also prepared. The composition of various semi-IPN hydrogels, prepared, is given in Table 1. 2.2.4. Characterization. The MCC obtained by acid hydrolysis of cellulose pulpand the ternary hydrogel synthesized were characterized by thermogravimetric (TG) analysis. In addition, surface morphology of MCC was also investigated by FE-SEM analysis. The thermogravimetric analysis was performed using a thermogravimetric analyzer (Mettler, Toledo TGA/SDTA 851, Switzerland). A definite quantity of grinded sample was placed in a ceramic crucible and analyzed over the temperature range of 30 to 800∘ C, at the heating rate of 10∘ C min−1 under the constant flow of N2 at the rate of 30 mL min−1 . The morphology of the obtained MCC was investigated using a JEOL 6400F microscope operated with an accelerating voltage of 2 kV and a working distance of 4.4 mm. 50 𝜇L sediment suspensions (0.01 wt%) was dropped onto clean silicon wafers followed by air drying for 24 h and then sputtered with an approximately 6 nm layer of gold/palladium. The FTIR spectrum of synthesized polymer was recorded on FTIR-spectrophotometer (Shimadzu, 8400S) using KBr. For this, dry polymer was grinded and mixed with KBr. The scans recorded were the average of 100 scans and spectral range selected was 400 to 4000 cm−1 . 2.2.5. Swelling Studies. The water absorption behavior of hydrogels was studied gravimetrically [18]. The preweighed hydrogel sample was placed in phosphate buffer solution of pH 7.4 under sink conditions at 37∘ C. The sample was taken out at regular time intervals, wiped superficially to remove loosely bound surface water, weighed accurately, and then again put in the swelling medium. The mass measurement process continued until the swollen hydrogel attained constant weight. The percent swelling (PS) was determined using the following expression:
PS =
(𝑀𝑡 − 𝑀0 ) × 100, 𝑀0
(1)
where 𝑀0 and 𝑀𝑡 are the initial dry mass and mass at time “𝑡,” respectively. The equilibrium percent swelling (EPS) was determined by replacing 𝑀𝑡 in the above expression by 𝑀∞ , the mass of swollen hydrogel at equilibrium. All the experiments were carried out in triplicate and average values are reported in the data.
Journal of Polymers
3 Table 1: Composition of various semi-IPN hydrogel synthesizeda .
Sample code A B C D E F G H I
Cell (g) 0.2 0.2 0.2 0.2 0.2 0.4 0.6 0.2 0.2
PEG∗ (g) 0.4 0.4 0.4 0.4 0.4 0.4 0.4 0.4 0.4
SA (mili mol) 10.63 10.63 10.63 6.36 14.88 10.63 10.63 10.63 10.63
MB (𝜇mol) 260 390 520 390 390 390 390 390 390
KPS (𝜇mol) 200 200 200 200 200 200 200 200 200
a
Volume of feed mixture = 5.0 mL. Samples A, B, C, D, E, F, and G were prepared with PEG of molar mass 6000. ∗∗ Samples H and I were prepared with PEG of molar masses 4000 and 200, respectively. ∗
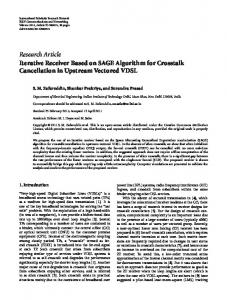
3. Results and Discussion 3.1. Rationale for the Semi-IPN Hydrogel System. The basic idea, lying behind the selection of appropriate polymers to prepare hydrogel, was based on the following considerations. (1) The cellulose pulp, after acid hydrolysis, yields cellulose microparticles (CMP) that can be conveniently dissolved in PEG/NaOH system. (2) The aqueous solution of cellulose, so obtained, contains another biocompatible polymer PEG in the dissolved state. Therefore, the solution has now two biopolymers in the dissolved state. (3) The addition of ionizable groups containing monomer, that is, acrylic acid, into the above aqueous solution and subsequent polymerization could render the salt and pH sensitivity to the resulting ternary polymeric hydrogel system. In addition, the presence of NaOH in the solvent system would also transform AAc into sodium acrylate (SA) which imparts greater water absorption property to the resulting hydrogel system. In this way, the system Cell/PEG/poly(SA) could come out with a fair overall biocompatibility, pH and salt sensitivity, and, finally, excellent swelling property. The swelling of this system could be better controlled by variation in contents of these components. 3.2. Synthesis of Cell/PEG/Poly (SA) Semi-IPN Hydrogels. The hydrogels were prepared by free radical induced aqueous polymerization of monomer sodium acrylate (SA) in the presence of crosslinker MB and dissolved polymers cellulose and PEG. The interpenetrating polymer network, so formed, consists of covalently crosslinked poly(sodium acrylate) chains that are physically entangled with cellulose and PEG macromolecular segments. The possibility of H-bonding interactions between O and H atoms associated with cellulose and PEG molecules cannot be ruled out. The overall scheme of formation of ternary hydrogel system is shown in Figure 1.
3.3. Thermogravimetric Analysis (TGA). The thermograms of cellulose microparticles (CMP) and Cell/PEG/poly (SA) ternary hydrogel sample B are shown in Figures 2(a) and 2(b), respectively. It is clear that initial weight loss of nearly 5% is observed from 20 to 120∘ C, probably due to moisture evaporation (phase I). Later on, the CMP undergo a sharp thermal degradation in the temperature range of 210∘ C to 440∘ C, where all cellulose is pyrolyzed. The drastic weight loss is attributable to the liberation of volatile hydrocarbon from rapid thermal decomposition of cellulose. The total weight of CMP is now reduced to 30%. Therefore, in phase II, the weight loss is approximately 65%. Finally, in phase III, there is and observed gradual weight loss, probably due to the steady decomposition of the remaining heavy components mainly from lignin [19]. In this phase there is almost 8% weight loss. The thermogram of ternary hydrogel system as depicted in Figure 2(B) shows a different behavior due to presence of other polymers, namely, poly (SA) and PEG. Out of the three polymers, namely, CMP, poly (SA), and PEG, present in the hydrogel, the highest content is of poly (SA) and so its thermal stability is expected to govern the overall stability of the thermogram. It can be seen that below 350∘ C there is weight loss of almost 31%, which is attributable to the loss of water molecules bound to the polar groups of polymeric constituents, and decarboxylation of –COO groups associated with poly (SA) chains [20]. Beyond 350∘ C, the weight loss of polymer continues up to 433∘ C due to presence of small amount of PEG in the sample. It has been reported by Manson et al. [21] that in the pure PEG the weight loss occurs in the range of 300 to 450∘ C. Finally, the second sharp weight loss occurs in the temperature range of 415∘ C to 510∘ C which is attributable to decomposition of both the polymer constituents with the elimination of CO and CO2 by the way of abundant backbone scission and formation of small concentration of unsaturation. The slow and gradual weight loss beyond 510∘ C is associated with the carbonization of the degraded product or ash. If we compare the overall stability of the ternary hydrogel sample with cellulose microparticles then it is seen that CMP exhibit a total weight loss of 80% while the polymer sample B exhibits a total loss of 60% up to 600∘ C.
4
Journal of Polymers
64%
Conc. H2 SO4
NaOH/PEG −5∘ C
Δ
Cellulose pulp
Cellulose microparticles SA + MB + KPS Δ
Cut
60∘ C Polymer disc
100
100
95
60
80 75
40
70
20 0
85
0
200
400 600 Temperature
800
1000
Figure 2: TGA of the semi-IPN sample B.
3.4. FTIR Spectral Analysis. The FTIR spectrum of terpolymer, Cellulose/poly(SA)/PEG, is shown in Figure 3. The presence of poly (sodium acrylate) is indicated by the appearance of sharp peaks at 1411 cm−1 and 1546 cm−1 due to symmetric and asymmetric stretchings of carboxylate anion. In addition, methylene deformation at 1456 cm−1 also appears in the spectrum. Finally –OH stretching vibration in the range of 2400–3400 also appears. There are sufficient spectral evidences about the presence of cellulose in the polymer. The characteristic region of anomeric carbons identifies where a band appears at 856 cm−1 , thus confirming the presence of 𝛽,1 → 4 linkage. The C–OH out of plane bending mode around 670 cm−1 also supports cellulose. Also C–H inplane bending at 1323 cm−1 also confirms cellulose. Finally, a sharp bend at 3628 cm−1 corresponds to O–H stretching
2953.12 .224 2841.24
T (%)
Weight (%)
B
3728.53 3728. 2 533 222 3628.22
90
80
856.42 686.68 686.6 68 671.25 579.63 579 9.663 451.38
120
1683.91 683 83.911 83 1546.00 .000 1456.30 1410.98 1323.21
Figure 1: Scheme showing formation of Cell/PEG/poly (SA) semi-IPN hydrogel.
65 4000 3500 3000 2500 2000 1750 1500 1250 1000 750 500 1 (cm−1 ) skb pwcF(B)
Figure 3: FTIR spectrum of semi-IPN hydrogel sample B.
of alcoholic OH groups from cellulose and poly (ethylene glycol).
3.5. Swelling Behavior of Hydrogels. The polymeric hydrogels, intended to be used for biomedical applications such as drug delivery devices and wound dressings, require a detailed investigation of their swelling capacity, which, in majority of cases, regulate the release of bioactive ingredient from the device. In the present work, the ternary hydrogel systems with varying compositions were investigated for their dynamic water uptake behavior in the swelling media of pH 7.4 at the physiological temperature of 37∘ C. The results of swelling experiments are discussed below.
Journal of Polymers
5 1600
1200
1400
1000
1200
1000 PS
PS
800 600
800 600
400
400 200
200
0 0
0
100 Sample A Sample B
200
300 Time (min)
400
500
0
100
600
Sample C
Figure 4: Dynamic water uptake for samples A, B, and C in pH 7.4 at 37∘ C.
The dynamic water uptake data for hydrogel samples, having varying contents of crosslinker MB (see Table 1), is shown in Figure 4. It is clear that for all the three samples, namely, A, B, and C, the percent swelling (PS) increases with time and at a given time it decreases with the increase in MB content in the hydrogel. The total PS, exhibited by samples A, B, and C, was 1143, 1003, and 741, respectively. The decrease in PS with MB content is simply because the increased concentration of crosslinker results in an increase in the number of crosslinks junctions between polymeric chains, thus reducing the free space available for accommodation of incoming solvent. In addition, the increased number of crosslinks between polymeric segments renders more rigidity to the chains, thus restricting their relaxation. These two factors ultimately cause a decrease in water uptake [22]. In the present ternary hydrogel system, the three components, namely, Cell, PEG, and poly (SA), are hydrophilic and hence their concentrations in the feed mixture play a crucial role in governing the water absorption behavior of hydrogels. However, the situation is not so simple. Sometimes, the increase in concentration of one or more components results in an uncommon finding. The results of kinetic water uptake for samples D, B, and E that contain increasing amounts of monomer SA in the feed mixture are shown in Figure 5. The three samples demonstrated total percent swelling of 1235, 1003, and 1443, respectively. It is clear that swelling trend is unusual. As the SA content increases from 6.36 to 10.63 mmol, the percent equilibrium swelling decreases from 1235 to 1003. However, as the SA content is further increased to 14.88 mmol, the equilibrium PS increases to 1443. The observed findings may be explained as follows: initially, when the SA content is increased, the mutual entanglements of poly (SA) chains with those of cellulose and PEG increase, thus producing additional physical crosslinks within the polymer
Sample D Sample B
200
300 Time (min)
400
500
600
Sample E
Figure 5: Dynamic water uptake for samples B, D, and E in pH 7.4 at 37∘ C.
matrix. This lowers the percent swelling of hydrogel. However, as the SA content is increased further to 14.88 mmol, the presence of higher concentration of –COO− groups along poly (SA) chains not only provides more hydrophilic character to the resulting gel but also promotes chain relaxation process between similar charges. In sample E, the Cell and PEG contents are relatively low as compared to those of SA, and they are not able to produce additional crosslinks with poly (SA) chains via H-bonding interactions (see Table 1). Almost similar types of results have also been reported by Povea et al. [23] who studied swelling behavior of chitosan/poly (acrylic acid-co-acrylamide) hydrogels as a function of initial AAc concentration in the feed mixture. The results were explained based on intersalt complexation between positively charged chitosan molecules and negatively charged –COO− groups along the copolymeric chains. Moreover, chain relaxation between carboxylate groups was also taken into account. It may be noteworthy to mention here that almost opposite swelling trend is reported by Hosseinzadeh et al. [24] for the carrageenan-g-poly(acrylic acid)/bentonite superabsorbent. In their study percent swelling increased with AAc content, attained a maximum value, and then began to decrease. The amount of cellulose present in the polymerization mixture also affected the degree of swelling of hydrogels. The results of dynamic uptake of water for samples, B, F, and G containing increasing amounts of cellulose in the feed mixture are shown in Figure 6. The samples showed equilibrium percent swelling of 1003, 2534, and 3062, respectively. The observed finding may be attributable to the fact that as the cellulose content increases, the number of –OH groups also increases, thus imparting more hydrophilic character to the hydrogels. Thus, cellulose content is a significant parameter to regulate the water absorption behavior of cellulose-based hydrogels. However, in the present case it appears that PEG/NaOH system was
6
Journal of Polymers 3000
2500
PS
2000 1500 1000 500 0
0
100
200
300
400
500
600
Time (min) Sample F Sample B
Sample G
Figure 6: Dynamic water uptake for samples B, F, and G in pH 7.4 at 37∘ C. 1800
1400 1200
PS
3.6. Interpretation of Water Uptake Data. When a glassy polymeric hydrogel is placed in water, the hydrogel undergoes swelling owing to the diffusion of water into hydrogel. This process involves the following steps: (1) the solvent molecules migrate into preexisting or dynamically formed spaces between polymeric chains within the hydrogel matrix;
1600
(2) the polymeric segments are plasticized if the solvent (usually water) has affinity towards functional groups present along polymeric chains. This results in unfolding of chains. This creates bigger separation between chains, followed by accommodation of water molecules;
1000 800 600 400 200 0
However, as the molar mass further decreases to 200, the EPS shows a decreasing trend. This may be explained as follows: initially, as the molar mass decreases from 6000 to 4000, the lengths of the PEG chains decrease and this may be associated with decrease in the degree of entanglements with other polymeric chains, namely, those of cellulose and poly (SA). In other words, the extent of mutual entanglements within the polymeric chains decreases. This, in fact, reduces the number of physical crosslinks within the hydrogel and causes an increase in the EPS. However, as the molar mass of PEG is further reduced to 200, there is further decrease in the water absorption of hydrogel. It may be attributed to the fact that with low molar mass of PEG, the average length of polymeric chains is small and therefore chain relaxation process due to invasion of water molecules into the matrix is not so pronounced. In other words, smaller polymeric chains do not relax to a great extent and this results in relatively less equilibrium percent swelling.
0
100 Sample H Sample B
200
300 Time (min)
400
500
600
Sample I
Figure 7: Dynamic water uptake for samples B, H, and I in pH 7.4 at 37∘ C.
quite effective in the breaking of H-bonding interactions of cellulose even at higher cellulose concentrations. The molar mass of PEG, used as a component of solvent system to dissolve cellulose microparticles (CMP), also affected the equilibrium PS of resulting hydrogels. Samples 𝐵, 𝐻, and 𝐼, prepared by dissolving cellulose in PEG with molar masses of 6000, 4000, and 200, were investigated for their dynamic water uptake behavior at 37∘ C. The results, as shown in Figure 7, reveal an interesting observation. The samples exhibited equilibrium percent swelling (EPS) of 1003, 1733, and 1565, respectively. This indicates that as the molar mass decreases from 6000 to 4000, the EPS increases.
(3) if the polymeric chains contain ionizable groups, then the charged groups along the polymeric chains repel each other and enhance the chain relaxation process [25]. This, finally results in extensive swelling of hydrogel. The fundamental equation used to describe the water penetration mechanism for initial 60% data is 𝐹=
𝑀𝑡 = 𝑘𝑡𝑛 , 𝑀∞
(2)
where 𝐹 is the fractional water uptake at time 𝑡, 𝑘 is gel characteristic constant, and 𝑛 is swelling exponent, which indicates Fickian or non-Fickian behavior of the swelling device. Based on the relative rates of diffusion of solvent into hydrogels and relaxation of polymeric chains, the following three types of water sorption mechanisms have been proposed: (1) Fickian diffusion in which the rate of diffusion is much slower than the rate of chain relaxation (𝑛 = 0.5), (2) Case II diffusion in which rate of relaxation is much slower than the rate of diffusion of solvent (𝑛 > 0.5), and finally (3) anomalous transport in which the two rates, namely, rate of diffusion and rate of chain relaxation, are comparable (0.5 < 𝑛 < 1.0).
Journal of Polymers
7
𝑀 ln 𝐹 ( 𝑡 ) = ln 𝑘 + 𝑛 ln 𝑡. 𝑀∞
(3)
The dynamic water uptake data, obtained for various hydrogel samples and displayed in Figures 4, 5, 6, and 7, were used to draw linear plots between ln 𝑡 and ln 𝐹 (data not shown). The intercept and slopes of linear plots were used to calculate values of “𝑛” and “𝑘” as given in Table 2. A close look at the various values of “𝑛” given indicates that except for sample A, all the remaining samples exhibit “𝑛” values in the range of 0.45 to 0.65 thus indicating that swelling of all these hydrogel samples follows non-Fickian water transport behavior. This may simply be attributed to the fact that presence of ionized –COO− groups along the poly (SA) chains causes them to relax owing to the repulsion among similar charges. This is a most commonly observed phenomenon in the case of polymeric hydrogels that contain ionizable groups along their networks, and as far as sample A is concerned, it contains minimum amount of crosslinkers and therefore the polymeric chains are loosely crosslinked. In the swelling medium of pH 7.4, the ionized –COO− groups repel each other and chains continue to get unfolded or relaxed throughout the swelling process. As a result the mechanism is totally relaxation controlled and this is the case of case II or anomalous transport. Almost similar type of behavior has also been reported by Kim et al. [26] for poly(methacrylic acid-g-polyethylene glycol) hydrogels. It has been reported that (3) is applicable only for the fractional water uptake value of 0.6. Therefore, some kinetic model is needed to have a complete quantitative interpretation of the swelling data. It has been suggested that for the hydrogels with relatively long duration of swelling process, swelling rate at any time is directly proportional to the quadratic of the swelling capacity before the attainment of equilibrium state. Therefore, the second order equation, proposed by Schott, may be given as [27]: 𝑑𝑀𝑡 2 = 𝑘2 (𝑀∞ − 𝑀𝑡 ) , 𝑑𝑡
(4)
where 𝑀𝑡 is the water uptake at time “𝑡” and “𝑘2 ” is the second order rate constant for water absorption process. On integrating the above equation within the limits 𝑡 = 0 𝑀𝑡 = 0 and 𝑡 = ∞ 𝑀 = 𝑀∞ , the following equation is obtained: 1 𝑡 𝑡 = + 2 𝑀𝑡 𝑘2 𝑀∞ 𝑀∞
(5)
Table 2: Values of swelling exponent “n” and gel characteristic constant “k” for various samples studied. Sample code A B C D E F G H I
n 0.923 0.609 0.517 0.465 0.573 0.633 0.656 0.455 0.472
(6)
where 𝐴 and 𝐵 are two coefficients whose physical meaning is interpreted as follows: at a long retention time 𝐵𝑡 ≫ 𝐴 and therefore 𝐵 = 1/𝑀∞ ; that is, 𝐵 is reciprocal of the maximum
𝑅2 0.975 0.986 0.978 0.987 0.988 0.974 0.988 0.992 0.985
400
600
70 60 50 40 30 20 10 0
0
200 Time (min) Sample A Sample B Sample C
Linear (sample A) Linear (sample B) Linear (sample C)
Figure 8: Schott kinetic model for samples A, B, and C.
water uptake. On the contrast, at a very short time interval 𝐵𝑡 ≪ 𝐴 and so 𝐿𝑡 (
𝑑𝑀𝑡 1 )= 𝑑𝑡 𝐴
(7)
𝑡 → 0. Therefore, the intercept 𝐴 is reciprocal of initial swelling rate. Finally the Schott kinetic rate constant of swelling, 𝑘2 , can be calculated as
or 𝑡 = 𝐴 + 𝐵𝑡, 𝑀𝑡
k × 103 10.6 38.9 60.1 33.0 24.6 28.0 87.7 71.1 65.6
80
t/Mt (min g/g)
In order to determine the mode of water penetration into hydrogels logarithmic form of (2) was used:
𝑘2 =
slope2 𝐵2 = . Intercept 𝐴
(8)
In order to apply second order model on the kinetic data obtained for all the nine samples, in the medium of pH 7.4, plots were obtained between 𝑡/𝑀𝑡 and 𝑡 as shown in Figures 8, 9, 10, and 11, respectively.
Journal of Polymers 60
60
50
50 t/Mt (min g/g)
t/Mt (min g/g)
8
40 30 20
30 20 10
10 0
40
0 0
100
200
300 Time (min)
400
500
600
Sample E
Sample B Sample D
0
100
200
300 Time (min)
400
500
600
Sample I
Sample B Sample H
Figure 11: Schott kinetic model for samples B, H, and I.
Figure 9: Schott kinetic model for samples B, D, and E.
The initial diffusion coefficient 𝐷𝐼 gives an idea about the water penetration into hydrogel matrix in the initial stage of swelling. In order to determine 𝐷𝐼 , the following equation was employed [29]:
60 50
1/2
4(𝐷𝐼 𝑡/𝑙2 ) 𝑀𝑡 = 𝐹= 𝑀∞ 𝜋1/2
t/Mt (min g/g)
40
(9)
where 𝐹 is fractional uptake and 𝐷𝐼 is initial diffusion coefficient. The above equation can be rearranged as
30 20
𝐹=
10 0
,
4𝐷1/2 𝐼 . 𝑙1/2 ⋅ 𝑡1/2
(10)
The slope of linear plot between 𝐹 and 𝑡1/2 was used to calculate 𝐷𝑖 as 0
200
400
600
Time (min) Sample B Sample F Sample G
Linear (sample B) Linear (sample F) Linear (sample G)
Figure 10: Schott kinetic model for samples B, F, and G.
The slopes and intercepts of linear plots obtained yielded the rate constant 𝑘2 , initial swelling rate (i.e., 𝑟ini = 1/𝐴), theoretical equilibrium water uptake 𝑀∞(theor) , and experimental equilibrium PS 𝑀∞(exp) . All the values are displayed in Table 3. It can be seen that for all the linear plots obtained using Schott model, the regression values are large, thus indicating the suitability of this model. In addition, the theoretical and experimental equilibrium water uptakes (expressed as g water/g gel) are quite close to each other. Similar types of results have also been reported elsewhere [28]. 3.7. Diffusion Coefficients. Most of the diffusion processes are best interpreted by the Ficks first and second laws of diffusion.
𝐷𝐼 =
slope2 ⋅ 𝑙2 𝜋 . 16
(11)
The initial 60% of the dynamic swelling data, shown in Figures 4, 5, 6, and 7, were used to draw linear plots between ln 𝐹 and 𝑡1/2 . The slopes of the linear plots were used to calculate initial diffusion coefficients 𝐷𝑖 . In order to calculate the average diffusion coefficient 𝐷ave , 𝐹 = 0.5 and 𝑡 = 𝑡1/2 were substituted in (11), presuming that 50% of the total swelling, attained by hydrogel, can enable us to evaluate 𝐷ave . The above substitutions yielded the following expression: 𝐷ave =
0.049𝑙2 . 𝑡1/2
(12)
To calculate 𝐷ave , the dynamic swelling data were used to evaluate the time required for the attainment of 50% of the total swelling of various hydrogel samples. When a hydrogel disc is placed in swelling medium, the solvent molecules penetrate from all sides into the outer
Journal of Polymers
9
Table 3: Parameters associated with Schott kinetic model for swelling of various hydrogel samples in phosphate buffer of pH 7.4 at 37∘ C. Sample code A B C D E F G H I
𝑅2 0.9769 0.9908 0.9908 0.9791 0.9860 0.9263 0.9824 0.9963 0.9954
𝑘2 × 10³ 1.384 2.651 3.880 1.641 1.292 0.228 0.494 2.501 1.942
𝑟ini = (1/A) (g water/g gel min) 0.215 0.278 0.214 0.269 0.311 0.220 0.431 0.778 0.469 0
Table 4: Various diffusion coefficients obtained for swelling of hydrogels with different compositions in buffer media of pH 7.4 at 37∘ C.
A B C D E F G H I
𝐷𝐼 × 106 (cm2 min−1 )
𝐷𝐿 × 106 (cm2 min−1 )
𝐷ave × 106 (cm2 min−1 )
235.4 107.5 1553.2 1611.4 3365.8 8658.7 8682.8 7137.2 7179.8
9.8 14.6 7.9 11.5 25.5 105.2 89.9 120.4 413.4
237.2 69.5 64.1 57.0 274.6 306.2 253.4 554.8 745.8
𝐷𝐿 = −
𝜋2
.
100
200
300
400
−0.2 −0.3 −0.4 −0.5 −0.6 −0.7 −0.8 Time (min)
circumference of the disc and cause the outer part to swell. A sharp division between the relaxed, swollen region and interior dry region can be observed. In relation to this phenomenon, an interesting observation was made by Shankar [30], who claimed that a plot between the ln (1 − 𝑀𝑡 /𝑀∞ ) and “𝑡” gives a linear plot but with a distinct break in the slope. This is observed experimentally too for both Fickian and nonFickian diffusions. The break in the slope corresponds to the time when the two advancing boundaries meet each other. Using the slope of the later part, it is possible to calculate 𝐷𝐿 . The late time diffusion coefficient 𝐷𝐿 was determined using later 60% of the total equilibrium swelling data for various samples using the dynamic swelling data; the ln (1−𝑀𝑡 /𝑀∞ ) values were plotted against 𝑡 for various samples. The plots obtained were biphasic linear plots as discussed above (for illustration, the ln (1 − 𝑀𝑡 /𝑀∞ ) versus 𝑡 plots for samples A, B, and C are shown in Figure 12). The slope, obtained for the later part of the swelling process, was used to calculate 𝐷𝐿 using the following expression [31]: (slope × 𝑙2 )
0
𝑀∞(exp) (g water/g gel) 11.435 10.031 7.414 12.352 14.431 25.34 30.62 17.332 15.650
−0.1
ln (1 − Mt /M∞ )
Sample code
𝑀∞(theor) (g water/g gel) 12.484 10.245 7.434 12.820 15.527 31.055 29.449 17.636 15.552
(13)
The various types of diffusion coefficients for all the samples, discussed above, are given in Table 4. All the values are expressed in the order of 10−6 so that a clear-cut
Sample A Sample B
Sample C
Figure 12: ln (1 − 𝑀𝑡 /𝑀∞ ) versus 𝑡 plots for samples A, B, and C.
comparison can be made. A close look at the values of various diffusion coefficients, given, reveal that for all the samples the values of 𝐷𝐼 are ten to hundred times greater than those for late time diffusion coefficients 𝐷𝐿 . This indicates that solvent penetrates into the hydrogel matrices at a very fast rate in the beginning of the swelling process, and the rate slows down in the later part of the swelling. The various dynamic water uptake data, displayed for different types of hydrogels, also support these findings. In addition, from the ln (1 − 𝑀𝑡 /𝑀∞ ) versus “𝑡” plots (shown in Figure 12) also indicate the steep slope in the initial stage of swelling. 3.8. pH- and Salt-Dependent Swelling Behavior. The presence of ionizable groups within the hydrogel network renders pH-dependent swelling property to hydrogels. The pHresponsive swelling of such hydrogel systems has been exploited mainly for the targeted delivery of drugs via oral administration [32]. In this work, the representative sample B was equilibrated in buffer solutions of varying pH, in the range of 1 to 11, at 37∘ C. The results of swelling experiment are displayed in Figure 13.
Journal of Polymers 1200
600
1000
500
800
400 EPS
EPS
10
600
200
400
100
200 0
300
0 0
2
4
6
8
10
12
pH Sample B
Figure 13: Percent equilibrium swelling as a function of pH of the media.
It can be seen that hydrogel sample B attains a minimum swelling of 77 percent in the buffer medium of pH 1.0. As the pH of the swelling media increases, the PS also continues to increase and attains a maximum value of 965 at pH 6.0. However, as the pH is further increased the percent swelling shows a slight decreasing trend, attaining 644 percent swelling in the medium of pH 11. The observed findings may be explained as follows. When the pH is quite low, that is, 1.0, the –COOH groups present along the poly (sodium acrylate) chains remain as unionized –COOH groups and produce intermolecular H-bonding interactions, thus imparting compactness to the hydrogel matrix. In addition, the absence of ionization also minimizes the ion osmotic swelling pressure [33] which is also a key factor to enhance the swelling of hydrogel. Thus, hydrogel swells to minimum. When the pH is increased, there starts ionization of –COOH groups to give –COO− groups along the polymeric chains of poly (SA). These groups begin to repel each other thus causing the polymeric chains to relax or unfold. At the same time, the ionization within the hydrogel matrix also increases ion osmotic swelling pressure. Because of these two factors, the PS continues to increase and attains a maximum value in the range of pH 6-7. In this pH range there is almost complete ionization of –COOH groups, thus resulting in maximum water uptake. However, as the pH is increased further, the PS starts to decrease slightly. This is probably due to the “charge screening effect” of Na+ ions that are present in excess in the external solution at higher pH. These excess Na+ ions shield the –COO− ions and reduce the anion-anion repulsion along the macromolecular chains. Similar types of results are also reported elsewhere [34]. The excellent pH-dependent volume-phase transition opens up the possibilities of using this system for colon targeted drug delivery. The salt responsiveness of the representative sample B was also investigated by placing preweighed sample B in distilled water and salt solutions of NaCl, BaCl2 , and AlCl3 , each having a concentration of 1 M. The results, as shown in Figure 14, reveal that there is drastic decrease in the EPS of hydrogels as water is replaced by 1 M salt solutions as swelling media.
1 M NaCl
1 M BaCl2 Molarity
1 M AlCl3
Sample B
Figure 14: Effect of types of salts in swelling media on equilibrium swelling.
The decrease in PES is much more pronounced as the valence of cation increases. The maximum lowering of PES is observed in the case of salt solution of Al+++ ions. The observed finding may be attributable to the fact that when salt solutions are taken as swelling media in place of water, there is decrease in the ion osmotic swelling pressure; that is, 𝜋 = ∑ RT(𝐶gel − 𝐶sol ), where 𝐶gel and 𝐶sol are concentrations of mobile ions in the gel and solution phase, respectively [35]. The decrease in 𝜋 lowers the equilibrium PS. Moreover, the extent of decrease in EPS increases with the valence of counter or mobile ions. This is simply due to facts that as the valence of counter ion increases, the number of ions coming out of gel phase increases. In other words, for entrance of one Al+++ ion into the gel phase, expulsion of three monovalent Na+ ions from the gel phase into swelling medium is required. Therefore, 𝐶sol increases in the above expression, thus decreasing the value of 𝜋. The present of high valence cations in the gel phase may also produce additional crosslinks between negatively charged –COO− groups and cations.
4. Conclusion From the above study, it may be concluded that cellulose pulp can be conveniently dissolved in PEG/NaOH solvent system. When monomer AAc is added in precalculated quantity into cellulose solution and is allowed to undergo free radical polymerization, a semi-IPN hydrogel Cell/PEG/poly (SA) is formed. The swelling property of this hydrogel is governed by parameters like concentration of cellulose, acrylic acid, and crosslinker MB and molecular weight of PEG. The hydrogel exhibits excellent pH-dependent swelling behavior. The presence of salt in the swelling medium also affects the equilibrium percent swelling of hydrogels. The present hydrogel system opens up new possibilities to use it in various biomedical applications including drug delivery and wound healing management.
Conflict of Interests The authors declare that there is no conflict of interests regarding the publication of this paper.
Journal of Polymers
References [1] X. Qiu and S. Hu, “’Smart’ materials based on cellulose: a review of the preparations, properties, and applications,” Materials, vol. 6, no. 3, pp. 738–781, 2013. [2] J. F. Kadla and R. D. Gilbert, “Cellulose structure: a review,” Cellulose Chemistry and Technology, vol. 34, no. 3-4, pp. 197–216, 2000. [3] M. Sarvaˇs, P. Pavlenda, and E. Tak´acov´a, “Effect of hydrogel application on survival and growth of pine seedlings in reclamations,” Journal of Forest Science, vol. 53, no. 5, pp. 204–209, 2007. [4] A. Sannino, A. Esposito, L. Nicolais et al., “Cellulose-based hydrogels as body water retainers,” Journal of Materials Science: Materials in Medicine, vol. 11, no. 4, pp. 247–253, 2000. [5] M. Patchan, J. L. Graham, Z. Xia et al., “Synthesis and properties of regenerated cellulose-based hydrogels with high strength and transparency for potential use as an ocular bandage,” Materials Science and Engineering C, vol. 33, no. 5, pp. 3069–3076, 2013. [6] A. L. Buvanov, I. V. Hofman, A. K. Khripunov, A. A. Tkachenko, and E. E. Ushakova, “High-strength biocompatible hydrogels based on poly(acrylamide) and cellulose: synthesis, mechanical properties and perspectives for use as artificial cartilage,” Polymer Science A, vol. 55, no. 5, pp. 302–312, 2013. [7] Z. Sklenar, Z. Vitkova, P. Herdova, K. Horackova, and V. Simunkova, “Formulation and release of alaptide from cellulose-based hydrogels,” Acta Veterinaria, vol. 81, no. 3, pp. 301–306, 2012. [8] S. S. Bhattacharya, S. Shukla, Banerjee, S. Choudhary P, and Chakraborty, “Tailored IPN hydrogel bead of sodium carboxymethyl cellulose and sodium carboxymethyl xanthan gum for controlled delivery of diclofenac sodium,” Polymer-Plastics Technology and Engineering, vol. 52, no. 8, pp. 795–805, 2013. [9] D. Seliktar, “Extracellular stimulation in tissue engineering,” Annals of the New York Academy of Sciences, vol. 1047, no. 1, pp. 386–394, 2005. [10] M. H. Pittler and E. Ernst, “Dietary supplements for bodyweight reduction: a systematic review,” The American Journal of Clinical Nutrition, vol. 79, no. 4, pp. 529–536, 2004. [11] W. K. Czaja, D. J. Young, M. Kawecki, and R. M. Brown Jr., “The future prospects of microbial cellulose in biomedical applications,” Biomacromolecules, vol. 8, no. 1, pp. 1–12, 2007. [12] L. Zhang, D. Ruan, and S. Gao, “Dissolution and regeneration of cellulose in NaOH/Thiourea aqueous solution,” Journal of Polymer Science B: Polymer Physics, vol. 40, no. 14, pp. 1521–1529, 2002. [13] R. P. Swatloski, S. K. Spear, J. D. Holbrey, and R. D. Rogers, “Dissolution of cellose with ionic liquids,” Journal of the American Chemical Society, vol. 124, no. 18, pp. 4974–4975, 2002. [14] S. Zhang, F.-X. Li, and J.-Y. Yu, “Structure and properties of novel cellulose fibres produced from NaOH/PEG-treated cotton linters,” Iranian Polymer Journal, vol. 19, no. 12, pp. 949– 957, 2010. [15] F. M. Veronese and G. Pasut, “PEGylation, successful approach to drug delivery,” Drug Discovery Today, vol. 10, no. 21, pp. 1451– 1458, 2005. [16] X. W. Tan, L. Hartman, K. P. Tan et al., “In vivo biocompatibility of two PEG/PAA interpenetrating polymer networks as corneal inlays following deep stromal pocket implantation,” Journal of Materials Science: Materials in Medicine, vol. 24, no. 4, pp. 967– 977, 2013.
11 [17] W. Li, R. Wang, and S. Liu, “Nanocrystalline cellulose prepared from softwood kraft pulp via ultrasonic-assisted acid hydrolysis,” BioResources, vol. 6, no. 4, pp. 4271–4281, 2011. [18] M. C. I. Mohd Amin, N. Ahmad, N. Halib, and I. Ahmad, “Synthesis and characterization of thermo- and pH-responsive bacterial cellulose/acrylic acid hydrogels for drug delivery,” Carbohydrate Polymers, vol. 88, no. 2, pp. 465–473, 2012. [19] A. Zabaniotou, O. Ioannidou, E. Antonakou, and A. Lappas, “Experimental study of pyrolysis for potential energy, hydrogen and carbon material production from lignocellulosic biomass,” International Journal of Hydrogen Energy, vol. 33, no. 10, pp. 2433–2444, 2008. [20] A. E. Mucientes, F. Santiago, A. M. Carrero, and B. Talavera, “Superabsorbent hydrogels of poly(sodium acrylate) with crude and exfoliated vermiculites,” Journal of Polymer Engineering, vol. 33, no. 1, pp. 61–69. [21] J. Manson, D. Kumar, B. J. Meenan, and D. Dixon, “Polyethylene glycol functionalized gold nanoparticles: the influence of capping density on stability in various media,” Gold Bulletin, vol. 44, no. 2, pp. 99–105, 2011. [22] J. N. Hiremath and B. Vishalakshi, “Effect of crosslinking on swelling behaviour of IPN hydrogels of Guar Gum & Polyacrylamide,” Der Pharma Chemica, vol. 4, no. 3, pp. 946– 955, 2012. [23] M. B. Povea, W. A. Monal, J. V. C. Rodr´ıguez, A. M. Pat, N. B. Rivero, and C. P. Covas, “Interpenetrated chitosan-poly(acrylic acid-co-acrylamide) hydrogels. Synthesis, characterization and sustained protein release studies,” Materials Sciences and Applications, vol. 2, no. 6, pp. 509–520, 2011. [24] H. Hosseinzadeh, M. Sadeghzadeh, and M. Badazadeh, “Preparation and properties of carrageenan-g-poly(acrylic acid)/bentonite superabsorbent composite,” Journal of Biomaterials and Nanobiotechnology, vol. 2, pp. 311–317, 2011. [25] N. M. Franson and N. A. Peppas, “Influence of copolymer composition on non-fickian water transport through glassy copolymers,” Journal of Applied Polymer Science, vol. 28, no. 4, pp. 1299–1310, 1983. [26] B. Kim, K. La Flamme, and N. A. Peppas, “Dynamic swelling behavior of pH-sensitive anionic hydrogels used for protein delivery,” Journal of Applied Polymer Science, vol. 89, no. 6, pp. 1606–1613, 2003. [27] H. Schott, “Swelling kinetics of polymers,” Journal of Macromolecular Science: Physics, vol. 31, no. 1, 1992. [28] W. Wang and A. Wang, “Synthesis and swelling properties of guar gum-g-poly(sodium acrylate)/Na-montmorillonite superabsorbent nanocomposite,” Journal of Composite Materials, vol. 43, no. 23, pp. 2805–2819, 2009. [29] E. Karadag and D. Saraydin, “Influence of some crosslinkers on the swelling of acrylamide-crotonic acid hydrogels,” Turkish Journal of Chemistry, vol. 21, pp. 151–161, 1997. [30] V. Shankar, “Calculation of diffusion coefficients of organic vapours from short and longtime sorption data,” Polymer, vol. 20, no. 2, pp. 254–257, 1979. [31] P. M. Smith and M. M. Fisher, “Non-Fickian diffusion of water in melamine-formaldehyde resins,” Polymer, vol. 25, no. 1, pp. 84–90, 1984. [32] Y. Qiu and K. Park, “Environment-sensitive hydrogels for drug delivery,” Advanced Drug Delivery Reviews, vol. 53, no. 3, pp. 321–339, 2001. [33] F. Horkay, I. Tasaki, and P. J. Basser, “Osmotic swelling of polyacrylate hydrogels in physiological salt solutions,” Biomacromolecules, vol. 1, no. 1, pp. 84–90, 2000.
12 [34] H. Hosseinzadeh, “Controlled release of diclofenac sodium from pH-responsive carrageenan-g-poly(acrylic acid) superabsorbent hydrogel,” Journal of Chemical Sciences, vol. 122, no. 4, pp. 651–659, 2010. [35] O. Okay and S. B. Sariisik, “Swelling behavior of poly(acrylamide-co-sodium acrylate) hydrogels in aqueous salt solutions: theory versus experiments,” European Polymer Journal, vol. 36, no. 2, pp. 393–399, 2000.
Journal of Polymers
Journal of
Nanotechnology Hindawi Publishing Corporation http://www.hindawi.com
Volume 2014
BioMed Research International Hindawi Publishing Corporation http://www.hindawi.com
Volume 2014
Smart Materials Research
International Journal of
Corrosion Hindawi Publishing Corporation http://www.hindawi.com
Volume 2014
Hindawi Publishing Corporation http://www.hindawi.com
Journal of
Composites Volume 2014
Volume 2014
Journal of
International Journal of
Metallurgy
Polymer Science
Hindawi Publishing Corporation http://www.hindawi.com
Volume 2014
Nanomaterials
Hindawi Publishing Corporation http://www.hindawi.com
Hindawi Publishing Corporation http://www.hindawi.com
Volume 2014
Submit your manuscripts at http://www.hindawi.com Journal of
Textiles Hindawi Publishing Corporation http://www.hindawi.com
Volume 2014
Journal of
Nanoparticles Hindawi Publishing Corporation http://www.hindawi.com
Volume 2014
Nanomaterials Journal of
Advances in
Materials Science and Engineering Hindawi Publishing Corporation http://www.hindawi.com
Volume 2014
Hindawi Publishing Corporation http://www.hindawi.com
Volume 2014
Journal of
Journal of
Volume 2014
Hindawi Publishing Corporation http://www.hindawi.com
Hindawi Publishing Corporation http://www.hindawi.com
Volume 2014
Journal of
Materials
Coatings Hindawi Publishing Corporation http://www.hindawi.com
Scientifica
Crystallography Volume 2014
Hindawi Publishing Corporation http://www.hindawi.com
Volume 2014
The Scientific World Journal Hindawi Publishing Corporation http://www.hindawi.com
Volume 2014
Journal of
Hindawi Publishing Corporation http://www.hindawi.com
Volume 2014
Journal of
Ceramics Hindawi Publishing Corporation http://www.hindawi.com
International Journal of
Biomaterials
Nanoscience Volume 2014
Hindawi Publishing Corporation http://www.hindawi.com
Volume 2014