Hindawi Shock and Vibration Volume 2018, Article ID 2153506, 9 pages https://doi.org/10.1155/2018/2153506
Research Article Sparse Representation Based on Tunable Q-Factor Wavelet Transform for Whale Click and Whistle Extraction Hailan Chen ,1,2 Jiaquan Yan ,1 Naveed Ur Rehman Junejo ,1 Jie Qi ,1 and Haixin Sun 1 1 2
School of Information Science and Engineering, Xiamen University, Xiamen 361005, China School of Science, Jimei University, Xiamen 361021, China
Correspondence should be addressed to Haixin Sun;
[email protected] Received 25 May 2018; Revised 27 August 2018; Accepted 24 September 2018; Published 4 November 2018 Academic Editor: Cristina Castej´on Copyright © 2018 Hailan Chen et al. This is an open access article distributed under the Creative Commons Attribution License, which permits unrestricted use, distribution, and reproduction in any medium, provided the original work is properly cited. Whale sounds may mix several elements including whistle, click, and creak in the same vocalization, which may overlap in time and frequency, so it leads to conventional signal separation techniques challenging to be applied for the signal extraction. Unlike conventional signal separation techniques which are based on the frequency bands, such as WT and EMD, tunable-Q wavelet transform (TQWT) can separate the objected signal into particular components with different structures according to its oscillation property and eliminate in-band noise using the basis pursuit method. Considering the characteristics of oscillatory and transient impulse, we propose a novel signal separation method for whale whistle and click extraction. The proposed method is performed by the following two steps: first, TQWT is used to construct the dictionary for sparse representation. Secondly, the whale click and whistle construction are performed by designing the basis pursuit denoising (BPD) algorithm. The proposed method has been compared with one of the popular signal decomposition techniques, i.e., the EMD method. The experimental results show that the proposed method has a better performance of click and whistle signal separation in comparison with the EMD algorithm.
1. Introduction Whale sounds are combined of several elements (whistle, regular click, and rapid-click buzzes (creak)) in the same vocalization [1]. In general, whales utilize frequencymodulated pure tones (whistles) to communicate with each other. Meanwhile, they emit transient impulses (clicks) to echolocate the targets and explore the environment. Besides, they vocalize creak voice when they are in danger or emergency. However, most of the existing methods in the field of whale signal processing have been only analyzed for the single whistle or click signals, such as in [2–10]. Rather than extracting useful information from the multicomponent signals for further processing, some methods directly extract contours from whale whistle using image processing techniques, as described in [2–5]. Besides, for the automated analysis of whale click, various methods have been presented based on the statistical computation of
whale click spectrogram through different transforms in [6–10] with only presence of click. To further cognition of whale communication pattern and echolocation pattern, we need to separately extract whistles and clicks from the composite signal. Abundant methods have been presented to decompose multicomponent signals such as blind source separation [11], dual-tree complex wavelet transform [12], wavelet denoising, empirical mode decomposition (EMD) [13], ensemble empirical mode decomposition (EEMD), multiwavelet packet [14], and independent component analysis (ICA) [15–18]. The above methods are managed to decompose the objected signals in the frequency domain. However, each component of the whale sounds may occupy the same frequency band and overlap in the frequency domain. Thus, the above methods cannot exactly extract each component from the whale sounds. Unlike frequency-based methods, a sparse signal representation method using the tunable Q factor wavelet
2 transform (TQWT) can be used to decompose multicomponent signal according to the oscillatory behavior, where the oscillation is defined and reflected by theQ factor. Sparse signal representation has been applied to signal separation. An approach using biorthogonal RADWTs for signal separation was presented in [19]. A method using a signal sparse representation for signal separation has been proposed to address the mitigation of wind turbine clutter (WTC) in weather radar data [20]. Since the whistle and click signals have oscillatory and transient impulse characteristics, respectively, we proposed a sparse signal representation method with TQWT to extract click components with low Q factor and whistle components with high Q factor, respectively. The method is verified by the oceanic audio recording, and the results show effective extraction of click and whistle components from whale vocalization. The main contribution of this paper lies in (1) a new method that extracts click and whistle effectively and efficiently from multicomponents sound, (2) the selection of appropriate algorithm parameters in the actual application, and (3) the proposed method that can also be used for other mammals to extract interesting component from the composite signal. The rest of the paper is organized as follows: in Section 2, the TQWT algorithm and the basis pursuit denoising method are introduced. Section 3 compares the capabilities of the proposed approach and the EMD algorithm using click and whistle components extraction from a recorded whale composite sound signal. Section 4 discusses the conclusion.
2. Methodology The proposed approach consists of two parts: TQWT and BPD. TQWT offers an excellent flexibility for representing a signal of different temporal and spectral characteristics, achieved by tuning the transform parameters. TQWT is a discrete-time wavelet transform (DWT) [21] which provides a suitable tool for the analysis of oscillatory and nonoscillatory components of a signal. Besides, BPD is applied to obtain a sparse representation of each component which has different oscillatory behaviors. A brief introduction of the TQWT, its oscillation characteristic, and the transform operation are discussed in the following section. 2.1. TQWT. Our aim is to separate click and whistle components from the composite signal. From the perspective of the oscillation nature, the click components are composed of instantaneous pulses which have low oscillation property, and the whistle components are constituted of multiharmonics which have high oscillation property. To deal with such signals, Selesnick et al. developed the tunable Q factor wavelet transform (TQWT) which the Q factor is flexibly tunable [22]. TQWT can be used to decompose the objected signal into high-oscillatory, low-oscillatory, and residual components according to the values of high Q and low Q factors [23]. The Q factor reflects the oscillatory properties of one signal. The Q factor is defined as follows [24]:
Shock and Vibration
Q�
fc , BW
(1)
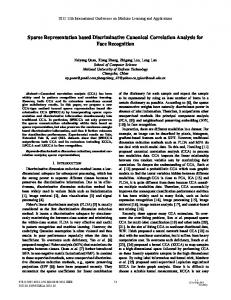
where fc is the center frequency and BW is the bandwidth. The signal oscillatory property can be described with the Q factor. As shown in Figures 1(a)–1(d), it is evident that a higher Q signal has a higher oscillatory intensity in the time domain and a higher degree of frequency aggregation in the frequency domain at the same time, and vice versa [24]. Hence, the difference between the low and high Q wavelet functions highlights the idea of oscillation of a signal, which is exploited for the component extraction problem discussed in this paper. The TQWT algorithm which decomposes an N-point discrete-time signal into J-level subbands is demonstrated in Figure 2. The structure of TQWT employs two channel analysis and synthesis filter banks. The implementation of the analysis filter banks is performed on its low-pass channel iteratively and then further processed by the low- and high-pass scaling, and α and β are the corresponding scaling parameters [25]. The synthesis filter bands execute the same steps. For each level, two-channel filters are composed of low- and high-pass filter, and the corresponding frequency responses are defined in the following equations [23]: 1, |ω| ≤ (1 − β)π, ⎪ ⎧ ⎪ ⎪ ⎪ ⎪ ⎪ ⎪ ⎪ ⎪ ⎨ ω +(β − 1)π Hl (ω) � ⎪ θ (1 − β)π < |ω| < απ, , ⎪ α + β−1 ⎪ ⎪ ⎪ ⎪ ⎪ ⎪ ⎪ ⎩ 0, απ ≤ |ω| ≤ π, 0, ⎪ ⎧ ⎪ ⎪ ⎪ ⎪ ⎪ ⎪ ⎪ ⎪ ⎨ απ − ω Hh (ω) � ⎪ θ , ⎪ α + β−1 ⎪ ⎪ ⎪ ⎪ ⎪ ⎪ ⎪ ⎩ 1,
|ω| ≤ (1 − β)π,
(1 − β) < |ω| < απ, απ ≤ |ω| ≤ π, (2)
where the parameters must satisfy 0 < α < 1, 0 < β ≤ 1, α + √������� β > 1, and θ(ω) � 0.5(1 + cos ω) 2 − cos ω, |ω| ≤ π. The most significant parameters of the TQWT algorithm are Q factor, redundancy factor r, and decomposition level J. The Q factor describes the degree of signal oscillation. For a high Q factor, the wavelets have more intense oscillatory cycles, which are suitable for the extraction of oscillatory components. Meanwhile, for a low Q factor, the wavelets consist of nonoscillatory elements, which are fit for the extraction of the transient components. The redundancy factor r controls the overlapping rate among the frequency responses of the adjacent wavelets. Increasing the r value in the case of a fixed Q value enhances the overlapping rate of frequency responses and the computational cost. Note that r must be greater than 1, and r ≥ 3 is recommended for the perfect reconstruction and sparsity. The value of the decomposition level J affects the frequency coverage of the wavelets. Greater J value makes the wavelets cover a wider
Shock and Vibration
3 Frequency responses: Q = 1.00, R = 3.00
Wavelets: subbands 1 through 6 1
Subband
1 2
0.8
3
0.6
4
0.4
5 0.2
6 0
50
100 150 Time (samples)
200
0
250
0
(a) Wavelets: subbands 1 through 6
0.2 0.3 Normalized frequency (Hz)
0.4
0.5
(b)
Frequency responses: Q = 3.00, R = 3.00 1
1
Subband
0.1
2
0.8
3
0.6
4 0.4 5 0.2
6 0
50
100 150 Time (samples)
200
0
250
0
0.1
0.2 0.3 Normalized frequency (Hz)
(c)
0.4
0.5
(d)
Figure 1: Wavelet waveform and the corresponding frequency response spectrum with different parameters: (a) waveform with Q � 1 and r � 3, (b) spectrum with Q � 1 and r � 3, (c) waveform with Q � 3 and r � 3, and (d) spectrum with Q � 3 and r � 3.
x (n)
Hh(ω)
HPS-β
Hl(ω)
LPS-α
ω11
Level 1
Hh(ω)
HPS-β
Hl(ω)
LPS-α ... ω2l
Level 2
ωhJ
HPS 1/β
Hh∗(ω)
ωJl
LPS 1/α
H∗l (ω)
...
HPS-β
Hl(ω)
LPS-α
ωJl
Level J
ωh1 ωh2
Hh(ω)
ω1h ω2h ωhJ
HPS 1/β
Hh∗(ω)
LPS 1/α
H∗l (ω)
HPS 1/β
Hh∗(ω)
LPS 1/α
Hl∗(ω)
x (n)
Level 1
Level 2
Level J
Figure 2: The filter banks of TQWT. (a) The analysis filter banks. (b) The synthetic filter banks.
frequency range which even reach 0 Hz. The value of J should be selected as large as possible to include the lower frequency to the utmost extent. The maximum number of decomposing level Jmax is set to
Jmax �
log(βN/8) log(N/4(Q + 1)) � , (3) log(1/α) log((Q + 1)r/(Q + 1)r − 2)
where N is the length of the input signal x(n).
4
Shock and Vibration
In the practical applications, we calculated the value of Jmax according to Equation (3). Moreover, the computational cost of the TQWT algorithm is O(3rN log2 (4N/(Q + 1))) [23], and we discuss the computational complexity with the change of parameters. We can properly get the conclusion that the computational complexity increases with the enlargement of Q and J values, but increasing the Q value reduces the computational cost in the case of J � Jmax . Although sometimes we must select big enough Q value to match the high oscillatory intensity of the objected signal and set J � Jmax , but the computational cost is not huge according to the above discussion. In essence, the TQWT algorithm can provide one set of overcomplete basis to estimate high- and low-resonance components. We need to select three parameters Q, r, and J to establish the basis. The selection guides of the above parameters are mentioned in Table 1 [26]. 2.2. Basis Pursuit Denoising (BPD) with TQWT. Sparsity can be used in signal processing problems. By considering an observed signal y(n) which has been corrupted by additive noise, the received signal can be represented as y(n) � x(n) + i(n),
(4)
where x(n) is the useful signal and i(n) is the additive noise. The problem is to estimate x(n) which has a sparse representation from the observed signal y(n). The technique of BPD [27] provides an excellent platform for the optimization of the sparse representation of the signal x(n). To obtain a sparse representation of the signal x(n) concerning TQWT, we construct the objection function based on BPD technique as �� ��2 arg min��y − TQWT−1 (ω)��2 + η‖λ ⊙ ω‖1 , ω (5) such that x � TQWT−1 (ω). where ‖ · ‖1 and ‖ · ‖2 denote l1 and l2 norms, respectively. The coefficient ω � [ω(1) , . . . , ω(J+1) ] is the wavelet coefficient computed by TQWT. ω(j) denotes the wavelet coefficient of the subband j, η is a “regularization” parameter, ⊙ denotes the Hadamard (elementwise) multiplication, and λ � (λ1 , . . . , λJ+1 ) is the compensation vector. Several different algorithms have been developed for solving basis pursuit (BP) and BPD problems, such as iterative shrinkage/threshold algorithm (ISTA) [28, 29], fast ISTA (FISTA) [30], and split variable augmented Lagrangian shrinkage algorithm (SALSA) [31, 32]. The main idea of SALSA method is summarized in Algorithm 1, where μ represents the penalty parameter which affects the algorithm convergence speed and P is the iteration number. Considering the length of the article, the details of SALSA algorithm can be referred to [31].
3. Experimental Results and Analysis In the experiment, we adopted a real oceanic audio recording of a Beluga whale which consists of chick and whistle components. This recording was acquired at the
Table 1: The selection guides of the parameters related to the TQWT algorithm [26]. Overlapping extent of frequency responses
Computational cost
Q
No direct effect
↓if Q ↑, when J � Jmax
r
No direct effect
↑ if r ↑, when J � Jmax
J
↑ if r ↑
↑ if J ↑
Parameter
Selection guide Ql � Qmin � 1; Qh � oscillatory level of the signal r � trade-off between overlapping intensity of frequency responses and computational cost J � Jmax
(1) Procedure basis pursuit denoising w � BPD(x, TQWT, TQWT−1 , η, λ, μ) (2) Initialization T � ηλ/(2μ), u � 0, C � 1/(μ + 1), d � 0, w � TQWT(x) (3) for iteration k � 1 : P do (4) u � soft(w + d, T) − d (5) d � TQWT(Cx − CTQWT−1 (u)) (6) w�d+u (7) end for (8) end procedure (9) procedure soft thresholding y � soft(x, T) (10) y � max(|x| − T, 0) (11) y � yx/(y + T) (12) end procedure ALGORITHM 1: SALSA algorithm.
Oceanographic Valencia, using the instruments such as a computer with a Roland (Edirol) FA-101 sound acquisition system, a Bruel and Kjaer 8103 hydrophone, and a Bruel and Kjaer 2692 Nexus amplifier, as described in [1]. The waveform, spectrum, and time-frequency signature representation of the raw signal are plotted in Figures 3, 4(a), and 5(a), respectively. In Figure 3, there are 8192 samples in total under the sampling frequency fs � 96 kHz for the test. It is evident that the wave exists several transient impulses which denote click components. Meanwhile, we can observe from the subfigure of Figure 3 at t � 0.0601 ∼ 0.0611s that they have oscillatory components. Both click components and whistle components are clearly visualized in the spectrum as demonstrated in Figure 5(a): clicks are broadband components in the whole frequency domain. On the contrast, whistles are impulsive components which are distributed from 8 kHz to 26 kHz. We can clearly see from Figure 4(a) that whistles and click components intersect in the timefrequency signature. Meanwhile, whistles are line spectrum in the frequency axis, and clicks are also discrete distribution in the time axis.
Shock and Vibration
5
0.08
0.04 0.02 0 –0.02 –0.04
Click components
0.06
Amplitude
0.04
T1
T2
T3
T4
0.0602 0.0604 0.0606 0.0608 0.061
0.02 0 –0.02 –0.04
0
0.005 0.01 0.015 0.02 0.025 0.03 0.035 0.04 0.045 0.05 0.055 0.06 0.065 0.07 0.075 0.08 0.085 0.09 Time (seconds)
Figure 3: The waveform of the raw signal. ×104
×104
4.5
4
–20
3.5
–30
3
–40
2.5 2
–50
1.5 0.5 0
–40
3.5
–60
1
–20
4 Frequency (Hz)
Frequency (Hz)
4.5
3
–60
2.5
–80
2
–100
1.5
–120
1
–140
0.5
–70
0
0.01 0.02 0.03 0.04 0.05 0.06 0.07 0.08 Time (seconds)
0.01
0.02
(a)
0.03 0.04 0.05 0.06 Time (seconds)
0.07
0.08
–160
(b)
Frequency (Hz)
×104 4.5
–40
4
–60
3.5
–80
3
–100
2.5
–120 –140
2
–160
1.5
–180
1
–200
0.5 0
–220 0.01 0.02 0.03 0.04 0.05 0.06 0.07 0.08 Time (seconds) (c)
Figure 4: (a) Time-frequency signature of the raw signal. (b) Time-frequency signature of the whistle components extracted by the proposed method. (c) Time-frequency signature of the click components extracted by the proposed method.
3.1. Case Study of Whale Click Extraction. According to the nonoscillatory characteristic nature of click signal and the selection criteria of the TQWT approach, we set Q � 1, r � 3,
and J � 17 for click extraction. After obtaining the wavelet coefficients by the TQWT method, the BPD algorithm is performed to reconstruct the click signal. To solve the basis
6
Shock and Vibration 1 0.9
Whistle components Click components
0.8
Amplitude
0.7 0.6 0.5 0.4 0.3 0.2 0.1 0
0
0.5
1
1.5
2
2.5 3 Frequency (Hz)
3.5
4
4.5
5 ×10⁴
3.5
4
4.5
5 ×10⁴
3.5
4
4.5
5 ×10⁴
(a)
0.9 0.8 0.7 Amplitude
0.6 0.5 0.4 0.3 0.2 0.1 0
0
0.5
1
1.5
2
2.5 3 Frequency (Hz)
The raw signal Extracted whistle components Extracted click components (b)
1 0.9 0.8
Amplitude
0.7 0.6 0.5 0.4 0.3 0.2 0.1 0
0
0.5
1
1.5
2
2.5 3 Frequency (Hz)
The raw signal IMF1 of the EMD
IMF2 of the EMD IMF3 of the EMD (c)
Figure 5: Comparison of the effectiveness of whistle and click components separation by the proposed method and the EMD algorithm. (a) The raw signal. (b) The proposed method. (c) The EMD algorithm.
Shock and Vibration
7
0.08
0.02 0.01 0 0.06 –0.01 0.05 –0.02 0.04 –0.03 0.034 0.03
Amplitude
0.07
0.0342 0.0344 0.0346 0.0348
0.035
0.03 0.02 0.01 0 –0.01 –0.02 0.0545 0.0547 0.0549 0.0551 0.0553 0.0555
0.02 0.01 0 –0.01 –0.02 –0.03 –0.04
0
0.005 0.01 0.015 0.02 0.025 0.03 0.035 0.04 0.045 0.05 0.055 0.06 0.065 0.07 0.075 0.08 0.085 0.09 Time (seconds) The raw signal Extracted whistle components Extracted click components
Figure 6: The waveform of the raw signal and the extracted whistle and click components by the proposed method.
pursuit problem, we used the SALSA algorithm with parameters μ � 2, η � 0.06, and P � 100. After implementing two above-mentioned methods, we obtain the sparse representation of extracted click components. The time-frequency signature of the extracted click components is shown in Figure 4(c). Compared with Figure 4(a), it is obvious that all the click components of Figures 4(a) and 4(c) are spread at the same position in the time domain, and their shapes are also identical. In addition, the resolution of Figure 4(c) is much purer than Figure 4(a), because the BPD algorithm can eliminate the noise. However, we have marked weak and strong waveforms of the click signal with ellipse and rectangle, respectively, as seen in Figure 6. As compared with the two subfigures in Figure 6, the weak click signal has low energy, which is almost as harmonics, so, it cannot be extracted effectively. Further, to verify the effectiveness of the click extraction, the waveform and the spectra of the raw and extracted signals are drawn in Figures 5(b) and 6, respectively. We concluded that the performance of extracting the click is quite remarkable, and the proposed method has a good effect on noise reduction.
in Figures 5(b) and 5(c). It is obvious that the spectra of the whistle and click components separated by the proposed method are identical to the spectra of the raw signal. Furthermore, we can draw the conclusions that the proposed method can separate the whistle and click components from the raw signal effectively and the proposed method has the function of noise reduction to some extent. In this paper, the EMD algorithm was selected as a comparison due to its advantage of analyzing the nonlinear and nonstationary signals. EMD method can separate the objected signal into different intrinsic mode functions (IMFs). As exhibited in Figure 5(b), the first three IMFs are drawn to visualize its spectra where most of the harmonic waves can be extracted by the EMD algorithm, which represent the whistle components. However, click components cannot be extorted by EMD method. In addition, the noise components with the relative higher amplitude are distributed all over the frequency domain. In conclusion, the proposed method has the better performance of signal separation of the whistle and click components from the raw signal and the stronger ability of noise suppression.
3.2. Case Study of Whale Whistle Extraction. Similarly, considering the oscillatory nature of whistle signal, we set Q � 320, r � 3, and J � 891. To obtain whistle component sparse representation concerning TQWT, the BPD approach based on the SALSA algorithm is utilized with parameters μ � 2, η � 0.045, and P � 100. The time-frequency signature of the whistle components extracted by the proposed method is drawn in Figure 4(b). We can find that whistle components of Figures 4(a) and 4(b) are distributed at the same spot and their shapes are horizontal lines. We compare the effect of whistle and click signal separation by the proposed method and the EMD algorithm
4. Conclusion In this paper, we have proposed a sparse representation with TQWT method to extort the click and whistle components from the raw whale signal according to the oscillatory behavior of these two components. Considering the disparate oscillatory intensity of click and whistle signals, the TQWT algorithm with high Q factor was operated to extract whistle component. On the other hand, click extraction is realized under the condition of low Q factor when we perform TQWT method. Besides, BPD is used as an alternative to LTI filters for noise reduction. The
8 proposed method and the EMD algorithm are applied to the same real whale vocalization. Our proposed method appears to be superior to EMD for the extraction of the precise frequency variation of the whistle. In conclusion, the proposed method has the prominent performance of extracting the click and whistle components and removing noise.
Data Availability The data used to support the findings of this study are available from the corresponding author upon request.
Conflicts of Interest The authors declare that there are no conflicts of interest regarding the publication of this paper.
Acknowledgments This work was supported by the National Natural Science Foundation of China (Nos. 61671394 and 61471308), the Young and Middle-aged Teachers Educational Scientific Research Project of Fujian Province in 2016 (No. JAT160268), the Fundamental Research Funds for the Central Universities (No. 20720170044), and the Science and Technology Program of Shenzhen (JSGG20170414090428464).
References [1] R. Miralles, G. Lara, J. Esteban, and A. Rodriguez, “The pulsed to tonal strength parameter and its importance in characterizing and classifying Beluga whale sounds,” Journal of Acoustical Society of America, vol. 131, no. 3, pp. 2173–2179, 2012. [2] H. A. Ou, W. L. Whitlow, M. Z. Lisa, and M. O. Lammers, “Automated extraction and classification of time-frequency contours in humpback vocalizations,” Journal of Acoustical Society of America, vol. 133, no. 1, pp. 301–310, 2013. [3] A. R. Marie, B. T. Scott, B. Patel et al., “Automated extraction of odontocete whistle contours,” Journal of Acoustical Society of America, vol. 130, no. 4, pp. 2212–2223, 2011. [4] K. M. David, S. W. Martin, R. P. Morrissey, L. Thomas, and J. J. Yosco, “A method for detecting whistles, moans, and other frequency contour sounds,” Journal of Acoustical Society of America, vol. 129, no. 6, pp. 4055–4061, 2011. [5] K. Arik and M. A. Roch, “An image processing based paradigm for the extraction of tonal sounds in cetacean communications,” Journal of Acoustical Society of America, vol. 134, no. 6, pp. 4435–4445, 2013. [6] A. Sanchez-Garcia, A. Bueno-Crespo, and J. L. SanchoGomez, “An efficient statistics-based method for the automated detection of sperm whale clicks,” Applied Acoustics, vol. 71, no. 5, pp. 451–459, 2010. [7] R. Morrissey, S. Jarvis, N. DiMarzio, J. Ward, and D. Moretti, “North Atlantic right whale (Eubalaena glacialis) detection and localization in the Bay of Fundy using widely spaced, bottom mounted sensors,” in Proceedings of Oceans 2006 Conference, vol. 1–4, p. 1349, Durham, NH, USA, September 2006.
Shock and Vibration [8] O. Adam, “Advantages of the Hilbert Huang transform for marine mammals signals analysis,” Journal of Acoustical Society of America, vol. 120, no. 5, pp. 2965–2973, 2006. [9] O. Adam, “The use of the Hilbert-Huang transform to analyze transient signals emitted by sperm whales,” Applied Acoustics, vol. 67, no. 11-12, pp. 1134–1143, 2006. [10] A. Frantzis, J. C. Goold, E. K. Skarsoulis, M. I. Taroudakis, and V. Kandia, “Clicks from Cuvier’s beaked whales, Ziphius cavirostris,” Journal of Acoustical Society of America, vol. 112, no. 1, pp. 34–37, 2002. [11] J. P. Jing and G. Meng, “A novel method for multi-fault diagnosis of rotor system,” Mechanism and Machine Theory, vol. 44, no. 4, pp. 697–709, 2009. [12] Y. Wang, Z. He, and Y. Zi, “Enhancement of signal denoising and multiple fault signatures detecting in rotating machinery using dual-tree complex wavelet transform,” Mechanical Systems and Signal Processing, vol. 24, no. 1, pp. 119–137, 2010. [13] R. Shao, W. Hu, and J. Li, “Multi-fault feature extraction and diagnosis of gear transmission system using time-frequency analysis and wavelet threshold denoising based on EMD,” Shock and Vibration, vol. 20, no. 4, pp. 763–780, 2013. [14] R. G. Baraniuk, E. Candes, M. Elad, and Y. Ma, “Applications of sparse representation and compressive sensing [scanning the issue],” Proceedings of the IEEE, vol. 98, no. 6, pp. 906–909, 2010. [15] B. Patil, S. Rajveer, and A. Das, “Wavelet denoising with ICA for the segmentation of bio-acoustic sources in a noisy underwater environment,” in Proceedings of 3rd International Conference on Communications and Signal Processing (ICCSP), Melmaruvathur, India, April 2014. [16] S. Seramani, E. A. Taylor, and P. J. Seekings, “Wavelet denoising with independent component analysis for segmentation of dolphin whistles in noisy underwater environment,” in Proceedings of Oceans 2006-Asia Pacific Conference, Singapore, May 2006. [17] J. R. Wessel, “Testing multiple psychological processes for common neural mechanisms using EEG and independent component analysis,” Brain Topography, vol. 31, no. 1, pp. 90–100, 2018. [18] B. Liu, W. J. Dai, and N. Liu, “Extracting seasonal deformations of the Nepal Himalaya region from vertical GPS position time series using independent component analysis,” Advances in Space Research, vol. 60, no. 12, pp. 2910–2917, 2017. [19] S. T. N. Nguyen and B. W.-H. Ng, “Bi-orthogonal rational discrete wavelet transform with multiple regularity orders and application experiments,” Signal Processing, vol. 93, no. 11, pp. 3014–3026, 2013. [20] F. Uysal, I. Selesnick, and B. M. Ison, “Mitigation of wind turbine clutter for weather radar by signal separation,” IEEE Transactions on Geoscience and Remote Sensing, vol. 54, no. 5, pp. 2925–2934, 2016. [21] J. Gubner and W. Chang, “Wavelet transforms for discretetime periodic signals,” Signal Processing, vol. 42, no. 2, pp. 167–180, 1995. [22] I. W. Selesnick, “Wavelet transform with tunable Q-factor,” IEEE Transactions on Signal Processings, vol. 59, no. 8, pp. 3560–3575, 2011. [23] W. He, Y. Zi, and B. Chen, “Automatic fault feature extraction of mechanical anomaly on induction motor bearing using ensemble super-wavelet transform,” Mechanical Systems Signal Processing, vol. 54-55, pp. 457–480, 2015.
Shock and Vibration [24] D. Zhang and D. Yu, “Multi-fault diagnosis of gearbox based on resonance-based signal sparse decomposition and comb filter,” Measurement, vol. 103, pp. 361–369, 2017. [25] H. Wang, J. Chen, and G. Dong, “Feature extraction of rolling bearing’s early weak fault based on EEMD and tunable Qfactor wavelet transform,” Mechanical Systems and Signal Processing, vol. 48, no. 1-2, pp. 103–119, 2014. [26] H. Huang, N. Baddour, and M. Liang, “Auto-OBSD: automatic parameter selection for reliable oscillatory behaviorbased signal decomposition with an application to bearing fault signature extraction,” Mechanical Systems and Signal Processing, vol. 86, pp. 237–259, 2017. [27] S. Chen, D. L. Donoho, and M. A. Saunders, “Atomic decomposition by basis pursuit,” SIAM Journal on Scientific Computing, vol. 20, no. 1, pp. 33–61, 1998. [28] I. Daubechies, M. Defriese, and C. D. Mol, “An iterative thresholding algorithm for linear inverse problems with a sparsity constraint,” Communications on Pure and Applied Mathematics, vol. 57, no. 11, pp. 1413–1457, 2004. [29] M. Figueiredo and R. Nowak, “An EM algorithm for waveletbased image restoration,” IEEE Transaction Image Processing, vol. 12, no. 8, pp. 906–916, 2003. [30] A. Beck and M. Teboulle, “A fast iterative shrinkagethresholding algorithm for linear inverse problems,” SIAM Journal on Imaging Sciences, vol. 2, no. 1, pp. 183–202, 2009. [31] M. V. Afonso, J. M. Bioucal-Dias, and M. A. T. Figueiredo, “Fast image recovery using variable splitting and constrained optimization,” IEEE Transaction Image Processing, vol. 19, no. 9, pp. 2345–2356, 2010. [32] M. V. Afonso, J. M. Bioucas-Dias, and M. A. T. Figueiredo, “An augmented lagrangian approach to the constrained optimization formulation of imaging inverse problems,” IEEE Transaction Image Processing, vol. 20, no. 3, pp. 681–695, 2011.
9
International Journal of
Advances in
Rotating Machinery
Engineering Journal of
Hindawi www.hindawi.com
Volume 2018
The Scientific World Journal Hindawi Publishing Corporation http://www.hindawi.com www.hindawi.com
Volume 2018 2013
Multimedia
Journal of
Sensors Hindawi www.hindawi.com
Volume 2018
Hindawi www.hindawi.com
Volume 2018
Hindawi www.hindawi.com
Volume 2018
Journal of
Control Science and Engineering
Advances in
Civil Engineering Hindawi www.hindawi.com
Hindawi www.hindawi.com
Volume 2018
Volume 2018
Submit your manuscripts at www.hindawi.com Journal of
Journal of
Electrical and Computer Engineering
Robotics Hindawi www.hindawi.com
Hindawi www.hindawi.com
Volume 2018
Volume 2018
VLSI Design Advances in OptoElectronics International Journal of
Navigation and Observation Hindawi www.hindawi.com
Volume 2018
Hindawi www.hindawi.com
Hindawi www.hindawi.com
Chemical Engineering Hindawi www.hindawi.com
Volume 2018
Volume 2018
Active and Passive Electronic Components
Antennas and Propagation Hindawi www.hindawi.com
Aerospace Engineering
Hindawi www.hindawi.com
Volume 2018
Hindawi www.hindawi.com
Volume 2018
Volume 2018
International Journal of
International Journal of
International Journal of
Modelling & Simulation in Engineering
Volume 2018
Hindawi www.hindawi.com
Volume 2018
Shock and Vibration Hindawi www.hindawi.com
Volume 2018
Advances in
Acoustics and Vibration Hindawi www.hindawi.com
Volume 2018