Hindawi Publishing Corporation Scientific Programming Volume 2016, Article ID 5612039, 11 pages http://dx.doi.org/10.1155/2016/5612039
Research Article Virtual Machine Placement Algorithm for Both Energy-Awareness and SLA Violation Reduction in Cloud Data Centers Zhou Zhou,1 Zhigang Hu,1 and Keqin Li2 1
School of Software, Central South University, Changsha 410083, China Department of Computer Science, State University of New York, New Paltz, NY 12561, USA
2
Correspondence should be addressed to Zhou Zhou;
[email protected] Received 7 February 2016; Accepted 10 March 2016 Academic Editor: Laurence T. Yang Copyright © 2016 Zhou Zhou et al. This is an open access article distributed under the Creative Commons Attribution License, which permits unrestricted use, distribution, and reproduction in any medium, provided the original work is properly cited. The problem of high energy consumption is becoming more and more serious due to the construction of large-scale cloud data centers. In order to reduce the energy consumption and SLA violation, a new virtual machine (VM) placement algorithm named ATEA (adaptive three-threshold energy-aware algorithm), which takes good use of the historical data from resource usage by VMs, is presented. In ATEA, according to the load handled, data center hosts are divided into four classes: hosts with little load, hosts with light load, hosts with moderate load, and hosts with heavy load. ATEA migrates VMs on heavily loaded or little-loaded hosts to lightly loaded hosts, while the VMs on lightly loaded and moderately loaded hosts remain unchanged. Then, on the basis of ATEA, two kinds of adaptive three-threshold algorithm and three kinds of VMs selection policies are proposed. Finally, we verify the effectiveness of the proposed algorithms by CloudSim toolkit utilizing real-world workload. The experimental results show that the proposed algorithms efficiently reduce energy consumption and SLA violation.
1. Introduction Cloud computing [1, 2] is derived from grid computing. At present, cloud computing is receiving more and more attention, through which people can access resources in a simple way. In contrast to previous paradigms, cloud computing provides infrastructure as a service (IaaS), platform as a service (PaaS), and software as a service (SaaS). On one hand, the construction of a large-scale virtualized data centers meets the demand of computational power; on the other hand, such data centers consume a great many of electrical energy resources, leading to high energy consumption and carbon dioxide emissions. It has been reported that [3], in 2013, the total electricity consumption of global data center was more than 4.35 gigawatts, and annual growth rate was by 15%. The high energy consumption problem of virtualized data centers causes a series of problems, including energy wastes, low Return on the Investment (ROI), system instability, and more carbon dioxide emissions [4].
However, most hosts in data centers are in a state of low CPU utilization. Barroso and H¨olzle [5] took a survey over half a year and found that most hosts in data centers operate at lower than 50% CPU utilization. Bohrer et al. [6] investigated the problem of high energy consumption and came to the same conclusion. Therefore, it is extremely necessary to reduce the energy consumption of data centers while keeping low SLA (Service Level Agreement) violation [7]. In this paper, we put forward a new VM deployment algorithm (ATEA), two kinds of adaptive three-threshold algorithm (KAM and KAI), and three kinds of VM selection policies to reduce energy consumption and SLA violation. We verify the effectiveness of the proposed algorithms through using the CloudSim toolkit. The main contributions of the paper are summarized as follows: (i) Proposing a novel VM deployment algorithm (ATEA). In ATEA, hosts in a data center are divided
2
Scientific Programming into four classes according to their load. ATEA migrates VMs on heavily loaded or little-loaded hosts to lightly loaded hosts, while the VMs on lightly loaded and moderately loaded hosts remain unchanged. (ii) Presenting two kinds of adaptive three-threshold algorithm to determine the three thresholds. (iii) Putting forward three kinds of VMs selection policies and making three paired 𝑡-tests. (iv) Evaluating the proposed algorithms by extensive simulation using the CloudSim toolkit.
The rest of this paper is organized as follows. In Section 2, the related work is discussed. Section 3 presents the power model, cost of VM migration, SLA violation metrics, and energy efficiency metrics. Section 4 proposes ATEA, two kinds of adaptive three-threshold algorithm, VM selection policy, and VM deployment algorithm. Experiments and performance evaluation are presented in Section 5. Section 6 concludes the paper.
2. Related Work At present, there are various studies focusing on energy efficient resource management in cloud data centers. Constraint energy consumption algorithm [8–10] and energy efficiency algorithm [11–15] are two main types of algorithms for solving the problem of high energy consumption in data centers. The main idea of the constraint energy consumption algorithm is to reduce the energy consumption in data centers, but this type of algorithm focuses a little on (does not consider) the SLA violation. For example, Lee and Zomaya [8] proposed two heuristic algorithms (ECS, ECS + idle) to decrease the energy consumption, but the two algorithms are easy to fall into local optimum and do not consider the SLA violation. Hanson et al. [9] presented Dynamic Voltage and Frequency Scaling (DVFS) policy to save power in data centers. When the task number is large, DVFS policy raises the voltage of the processor in order to deal with the task in time; when the task number is small, DVFS policy decreases the voltage of processor for the purpose of saving power. Kang and Ranka [10] put forward an energy-saving algorithm, and they supposed that overestimated or underestimated execution time of tasks is bad for energy-saving algorithm. For overestimation, the extra available time should be assigned to other tasks in order to reduce energy consumption. Similarly, this energy-saving algorithm does not consider the SLA violation. Therefore, the constraint energy consumption algorithm does not meet the requirement of users because of focusing a little on (not considering) the SLA violation. The goal of the energy efficiency (energy consumption and SLA violation) algorithm is to decrease the energy consumption and SLA violation in data centers. For example, Buyya et al. [11] raised a virtual machine (VM) placement algorithm (called Single Threshold (ST)) based on the combination of VM selection policies. ST algorithm sets a unified value for all servers’ CPU utilization to make sure all servers are below this value. Obviously, ST algorithm can save energy consumption and decrease the SLA violation, but the SLA
violation remains at a high level. Beloglazov and Buyya [12] proposed an energy efficient resource management system, which includes the dispatcher, global manager, local manager, and VMM (VM Monitor). In order to improve the energy efficiency, Beloglazov et al. put forward a new VM migration algorithm called Double Threshold (DT) [13]; DT sets two thresholds to keep all hosts’ CPU utilization between the two thresholds. However, the energy consumption and SLA violation for DT algorithm need to be further decreased. Later, Beloglazov and Buyya [14, 15] proposed an adaptive doublethreshold VM placement algorithm to improve energy efficiency in data centers. However, the energy consumption in data centers remains at a high level. In our previous study [16], we proposed a three-threshold energy-aware algorithm named MIMT to deal with the energy consumption and SLA violation. However, the three thresholds for controlling host’s CPU utilization are fixed. Therefore, MIMT is not suitable for varying workload. Therefore, it is necessary to put forward a novel VM placement algorithm to deal with energy consumption and SLA violation in cloud data centers.
3. The Power Model, Cost of VM Migration, SLA Violation Metrics, and Energy Efficiency Metrics 3.1. The Power Model. Energy consumption by servers in data centers is connected with its CPU, memory, disk, and bandwidth. Recent studies [17, 18] have illustrated that the energy consumption by servers has a linear relationship with its CPU utilization; even DVFS policy is applied. However, with the decrease of hardware price, multicore CPUs and memory with large-capacity are widely equipped in servers, leading to the traditional linear model not being able to accurately describe energy consumption of servers. In order to deal with this problem, we use the real data of energy consumption offered by SPECpower benchmark (http://www.spec.org/power ssj2008/). We have chosen two servers equipped with dual-core CPUs. The main configuration of the two servers is as follows: one is HP ProLiant G4 equipped with 1.86 GHz (dual-core), 4 GB RAM; the other is HP ProLiant G5 equipped with 2.66 GHz (dual-core), 4 GB RAM. The energy consumption for the two servers at different load levels is listed in Table 1 [15]. 3.2. Cost of VM Migration. Proper VM migration between servers can reduce energy consumption and SLA violation in data centers. However, excessive VM migration could bring negative impact on performance of application which runs on the VMs. Voorsluys et al. [19] investigated the cost problem of VM migration, and the performance degradation caused by VM can be described in 𝐶=𝑘⋅∫
𝑡0 +𝑇𝑚𝑗
𝑡0
𝑇𝑚𝑗 =
𝑀𝑗 𝐵𝑗
,
𝑢𝑗 (𝑡) 𝑑𝑡, (1)
Scientific Programming
3 Table 1: Power consumption by the two servers at different load levels in Watts.
Server HP G4 HP G5
0% 86 93.7
10% 89.4 97
20% 92.6 101
30% 96 105
40% 99.5 110
50% 102 116
60% 106 121
70% 108 125
80% 112 129
90% 114 133
100% 117 135
where parameter 𝐶 represents total performance degradation caused by VM 𝑗, parameter 𝑘 is the coefficient of average performance degradation caused by VMs (in terms of the class of web-applications, the value of 𝑘 could be estimated as approximately 0.1 (10%) of the CPU utilization [19]), function 𝑢𝑗 (𝑡) corresponds to the CPU utilization of VM 𝑗, parameter 𝑡0 represents start time of migration, 𝑇𝑚𝑗 is completion time, 𝑀𝑗 corresponds to the total memory used by VM 𝑗, and 𝐵𝑗 represents the available bandwidth.
in data centers. Therefore, the metric of energy efficiency is defined as in 1 (5) , 𝐸= 𝑃 × SLA
3.3. SLA Violation Metrics. SLA violation is extremely important factor for any VM migration algorithm. At present, there are two ways to describe the SLA violations.
4. ATEA, Two Kinds of Adaptive Three-Threshold Algorithm, VM Selection Policy, and VM Deployment Algorithm
(1) PDM [15] (Overall Performance Degradation Caused by VM Migration). It is indicated in
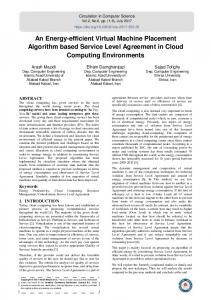
4.1. ATEA. VM migration is an effective method to improve the energy efficiency in data centers. However, there are several key problems which should be dealt with: (1) when a host is supposed to be heavily loaded, where some VMs from the host should be migrated to another host; (2) when a host is believed to be moderately loaded or lightly loaded, resulting in a decision to keep all VMs on this host unchanged; (3) when a host is believed to be little-loaded, where all VMs on the host must be migrated to another host; (4) selecting a VM or more VMs that should be migrated from the heavily loaded; (5) finding a new host to accommodate VMs migrated from heavily loaded or little-loaded hosts. In order to solve the above problems, ATEA (adaptive three-threshold energy-aware algorithm) is proposed. ATEA automatically sets three thresholds 𝑇𝑙 , 𝑇𝑚 , and 𝑇ℎ (0 ≤ 𝑇𝑙 < 𝑇𝑚 < 𝑇ℎ ≤ 1), leading to the data center hosts to be divided into four classes: hosts with little load, hosts with light load, hosts with moderate load, and hosts with heavy load. When CPU utilization of a host is less than or equal to 𝑇𝑙 , the host is believed to be little-loaded. In order to save energy consumption, all VMs on little-loaded host must be migrated to another host with light load and the host is switched to sleep mode; when CPU utilization of a host is between 𝑇𝑙 and 𝑇𝑚 , the host is considered as being lightly loaded. In order to avoid high SLA violations, all VMs on lightly loaded host have to be kept unchanged; the reason is that excessive VMs migration leads to the performance degradation and high SLA violations; when CPU utilization of a host is between 𝑇𝑚 and 𝑇ℎ , the host is believed to be moderately loaded; all VMs on moderately loaded host have to be kept unchanged for the reason that excessive VMs migration leads to the performance degradation and high SLA violations; when CPU utilization of a host is greater than 𝑇ℎ , the host is considered as being heavily loaded; in order to reduce the SLA violations, some VMs on heavily loaded host must be migrated to another host with light load. Figure 1 shows the flow chart of algorithm ATEA.
PDM =
1 𝑀 𝐶𝑑𝑗 , ∑ 𝑀 𝑗=1 𝐶𝑟𝑗
(2)
where parameter 𝑀 represents the number of VMs in data center, 𝐶𝑑𝑗 means the estimate of the performance degradation caused by VM 𝑗 migration, and 𝐶𝑟𝑗 corresponds to the total CPU capacity requested by VM 𝑗 during its lifetime. (2) SLATAH [15] (SLA Violation Time per Active Host). It means the percentage of total SLA violation time, during which active host’s CPU utilization has experienced 100%, as indicated in SLATAH =
1 𝑁 𝑇𝑠𝑖 ∑ , 𝑁 𝑖=1 𝑇𝑎𝑖
(3)
where 𝑁 represents the number of hosts in data center, 𝑇𝑠𝑖 corresponds to the total time, during which the CPU utilization of host 𝑖 has experienced 100% utilization resulting in the SLA violations, 𝑇𝑎𝑖 corresponds to the total time of host 𝑖 being in active state. The reasoning behind the SLATAH is that the active host’s CPU utilization has experienced 100% utilization, the VMs on the host could not be provided with the requested CPU capacity. Both PDM and SLATAH are two effective methods to independently evaluate the SLA violation. Therefore, the SLA violation is defined as in [15] SLA = PDM × SLATAH.
(4)
3.4. Energy Efficiency Metric. Energy efficiency includes energy consumption and SLA violation. Improving the energy efficiency means less energy consumption and SLA violation
where 𝐸 corresponds to the energy efficiency of a data center, 𝑃 means the energy consumption of a data center, and SLA represents the SLA violation of a data center. Equation (5) shows that the higher the 𝐸, the more the energy efficiency.
4
Scientific Programming
Begin
Obtain the value of Tl , Tm , and Th
Get value of hosts’ CPU utilization (u)
No
All VMs on the host are migrated to another host with light load
Yes
u > Tl
No
u > Tm
VMs on the host are kept
No
Yes
u > Th
unchanged Yes VMs on the host are kept
Some VMs on the host are migrated to
unchanged
another host with light load
End
Figure 1: Flow chart of ATEA.
Different from out previous study [16], where the thresholds are fixed, in this paper, the three thresholds 𝑇𝑙 , 𝑇𝑚 , and 𝑇ℎ in ATEA are not fixed and these values can be autoadjusted according to workload. ATEA migrates VMs that must be migrated to other hosts, while keeping some VMs unchanged. In doing so, ATEA improves the migration efficiency of VMs. Therefore, ATEA is a fine-grained algorithm. However, two problems should be solved as for ATEA. Firstly, what are the threshold values of 𝑇𝑙 , 𝑇𝑚 , and 𝑇ℎ ? This problem will be discussed in Section 4.2. Secondly, as mentioned above, some VMs on heavily loaded host must be migrated to another host with light load. Which VM should be migrated? This issue will be discussed in Section 4.3. The VM placement optimization of ATEA is illustrated in Algorithm 1. In the first stage, the algorithm inspects each host in host list and decides which host is heavily loaded. If the host is heavily loaded (corresponding to Line 2 in Algorithm 1), the algorithm uses the VM selection policy to choose VMs which must be migrated from the host (corresponding to Line 6 in Algorithm 1). Once VMs list that should be migrated from the heavily loaded is created, the VM deployment algorithm is invoked for the purpose of finding a new host to accommodate the VM (corresponding to Line 7 in Algorithm 1). Function “getNewVmPlacement(vmsToMigrate)” means to find a new host to accommodate the VM. In the second stage, the
algorithm inspects each host in host list and decides which host is little-loaded. If the host is little-loaded (corresponding to Line 11 in Algorithm 1), the algorithm chooses all VMs from the host to migrate and finds a placement of the VMs (corresponding to Line 15-Line 16 in Algorithm 1). At last, the algorithm returns the migration map. 4.2. Two Kinds of Adaptive Three-Threshold Algorithm. As discussed in Section 4.1, what are the threshold values of 𝑇𝑙 , 𝑇𝑚 , and 𝑇ℎ ? To solve this problem, two adaptive threethreshold algorithms (KAM and KAI) are proposed. 4.2.1. KAM (𝐾-Means Clustering Algorithm-Average-Median Absolute Deviation). For a univariate data set 𝑉1 , 𝑉2 , 𝑉3 , . . ., 𝑉𝑛 (𝑉𝑖 is a host’s CPU utilization at time 𝑖, and the size of 𝑛 could be determined by empirical value), the KAM algorithm firstly uses the 𝐾-means clustering algorithm to divide the data set (𝑉1 , 𝑉2 , 𝑉3 , . . . , 𝑉𝑛 ) into 𝑚 groups (𝐺1 , 𝐺2 , . . . , 𝐺𝑚 ) (the size of 𝑚 could be obtained by empirical value, and in this paper, 𝑚 = 5), where 𝐺𝑘 = (𝑉𝑗𝑘−1 +1 , 𝑉𝑗𝑘−1 +2 , . . . , 𝑉𝑗𝑘 ), for all 1 ≤ 𝑘 ≤ 5, and 0 = 𝑗0 < 𝑗1 < 𝑗2 < ⋅ ⋅ ⋅ < 𝑗5 = 𝑛. Then, KAM gets the average value of each group, formalized as follows:
𝐺𝐴𝑘 =
(𝑉𝑗𝑘−1 +1 + 𝑉𝑗𝑘−1 +2 + ⋅ ⋅ ⋅ + 𝑉𝑗𝑘 ) (𝑗𝑘 − 𝑗𝑘−1 )
,
(6)
Scientific Programming
5
Require: hostlist // hostlist is the set of all hosts Ensure: migrationMap (1) for each host in hostlist do (2) if isHostHeavilyLoaded(host) then (3) HeavilyLoadedHosts.add(host); // host is heavily-loaded (4) end if (5) end for (6) vmsToMigrate = getVmsFromHeavilyLoadedHosts(HeavilyLoadedHosts); (7) migrationMap.addAll(getNewVmPlacement(vmsToMigrate)); (8) HeavilyLoadedHosts.clear( ); (9) vmsToMigrate.clear( ); (10) for each host in hostlist do (11) if isHostLittleLoaded(host) then (12) LittleLoadedHosts.add(host); // host is little-loaded (13) end if (14) end for (15) vmsToMigrate = getVmsToMigrateFromHosts(LittleLoadedHosts); (16) migrationMap.addAll(getNewVmPlacement(vmsToMigrate)); (17) return migrationMap Algorithm 1: Optimized allocation of VMs.
for all 1 ≤ 𝑘 ≤ 5. Then, KAM gets the Median Absolute Deviation (MAD) of 𝐺(𝐺𝐴1 , 𝐺𝐴2 , . . . , 𝐺𝐴5 ). Therefore, the MAD is defined as follows: (7) MAD = median𝐴𝑝 (𝐺𝐴𝑝 − median𝐴𝑞 (𝐺𝐴𝑞 )) , where 𝐴1 ≤ 𝐴𝑝 ≤ 𝐴5 and median𝐴𝑞 (𝐺𝐴𝑞 ) is median value of 𝐺𝐴𝑞 . Finally, the three thresholds (𝑇𝑙 , 𝑇𝑚 , and 𝑇ℎ ) in ATEA could be defined as follows: 𝑇𝑙 = 0.5 (1 − 𝑟 × MAD) ,
(8)
𝑇𝑚 = 0.9 (1 − 𝑟 × MAD) ,
(9)
𝑇ℎ = 1 − 𝑟 × MAD,
(10)
where 𝑟 ∈ 𝑅+ represents a parameter of the algorithm that defines how aggressively the system consolidates VMs. For example, the higher 𝑟, the more energy consumption, but the less SLA violations caused by VMs consolidation. The complexity of KAM is 𝑂(𝑚 × 𝑛 × 𝑡), where 𝑚 is the group number, 𝑛 denotes the data size, and 𝑡 is the iteration number. As the value of 𝑉𝑖 (𝑖 = 1, 2, 3, . . . , 𝑛) varies from time to time, the value of 𝑇𝑙 , 𝑇𝑚 , and 𝑇ℎ are also variable. Therefore, KAM is an adaptive three-threshold algorithm. When the workloads are dynamic and unpredictable, as compared with a fixed threshold algorithm, KAM generates higher energy efficiency by setting the value of 𝑇𝑙 , 𝑇𝑚 , and 𝑇ℎ . 4.2.2. KAI (𝐾-Means Clustering Algorithm-Average-Interquartile Range). KAI is another adaptive threshold algorithm. For a univariate data set 𝑉1 , 𝑉2 , 𝑉3 , . . . , 𝑉𝑛 (𝑉𝑖 is a host’s CPU utilization at time 𝑖, and the size of 𝑛 could be determined by empirical value), the KAI algorithm firstly uses the 𝐾-means clustering algorithm to divide the data set (𝑉1 , 𝑉2 , 𝑉3 , . . . , 𝑉𝑛 ) into 𝑚 groups (𝐺1 , 𝐺2 , . . . , 𝐺𝑚 ) (the size of
𝑚 could be obtained by empirical value, and in this paper, 𝑚 = 5), where 𝐺𝑘 = (𝑉𝑗𝑘−1 +1 , 𝑉𝑗𝑘−1 +2 , . . . , 𝑉𝑗𝑘 ), for all 1 ≤ 𝑘 ≤ 5, and 0 = 𝑗0 < 𝑗1 < 𝑗2 < ⋅ ⋅ ⋅ < 𝑗5 = 𝑛. Then, KAI gets the average value of each group, formalized as follows: 𝐺𝐴𝑘 =
(𝑉𝑗𝑘−1 +1 + 𝑉𝑗𝑘−1 +2 + ⋅ ⋅ ⋅ + 𝑉𝑗𝑘 ) (𝑗𝑘 − 𝑗𝑘−1 )
,
(11)
for all 1 ≤ 𝑘 ≤ 5. Then, KAI gets the Interquartile Range (IR) of 𝐺(𝐺𝐴1 , 𝐺𝐴2 , . . . , 𝐺𝐴5 ). Therefore, the IR is defined as follows: IR = 𝑄3 − 𝑄1 ,
(12)
where 𝑄3 is third quartiles of 𝐺 and 𝑄1 is first quartiles of 𝐺. Finally, the three thresholds (𝑇𝑙 , 𝑇𝑚 , and 𝑇ℎ ) in ATEA can be defined as follows: 𝑇𝑙 = 0.5 (1 − 𝑟 × IR) ,
(13)
𝑇𝑚 = 0.9 (1 − 𝑟 × IR) ,
(14)
𝑇ℎ = 1 − 𝑟 × IR,
(15)
where 𝑟 ∈ 𝑅+ represents a parameter of the algorithm that defines how aggressively the system consolidates VMs. For example, the higher 𝑟, the more energy consumption, but the less SLA violations caused by VMs consolidation. The complexity of KAI is 𝑂(𝑚 × 𝑛 × 𝑡), where 𝑚 is the group number, 𝑛 denotes the data size, and 𝑡 is the iteration number. As the value of 𝑉𝑖 (𝑖 = 1, 2, 3, . . . , 𝑛) varies from time to time, the values of 𝑇𝑙 , 𝑇𝑚 , and 𝑇ℎ are also variable. Therefore, KAI is an adaptive three-threshold algorithm. When the workloads are dynamic and unpredictable, as compared with fixed threshold algorithm, KAI generates higher energy efficiency by setting the value of 𝑇𝑙 , 𝑇𝑚 , and 𝑇ℎ .
6
Scientific Programming
4.3. VM Selection Policies. As described earlier in Section 4.1, some VMs on heavily loaded host must be migrated to another host with light load. Which VM should be migrated? In general, a host’s CPU utilization and memory size affect its energy efficiency. Therefore, to solve this problem, three kinds of VM selection policies (MMS, LCU, and MPCM) are proposed in this section. 4.3.1. MMS (Minimum Memory Size) Policy. The migration time of a VM will change, depending on its different memory size. A VM with less memory size means less migration time under the same spare network bandwidth. For example, a VM with 16 GB memory may take 16 times’ longer migration time than a VM with 1 GB memory. Clearly, selecting the VM with 16 GB memory or the VM with 1 GB memory greatly affects energy efficiency of data centers. Therefore, if a host is being heavily loaded, MMS policy selects a VM with the minimum memory size to migrate compared with the other VMs allocated to the host. MMS policy chooses a VM 𝑢 that satisfies the following condition: RAM (𝑢) ≤ RAM (V) , ∀V ∈ VM𝑖 ,
(16)
where VM𝑖 means the set of VMs allocated to host 𝑖 and RAM(𝑢) is the memory size currently utilized by the VM 𝑢. 4.3.2. LCU (Lowest CPU Utilization) Policy. As for energy efficiency in data center, the CPU utilization of a host is also another important factor. Therefore, if a host is being heavily loaded, LCU policy chooses a VM with the lowest CPU utilization to migrate compared with the other VMs allocated to the host. LCU policy chooses a VM 𝑢 that satisfies the following condition: Utilization (𝑢) ≤ Utilization (V) , ∀V ∈ VM𝑖 ,
(17)
where VM𝑖 means the set of VMs allocated to host 𝑖 and Utilization(𝑢) is the CPU utilization of VM 𝑢 allocated to host 𝑖. 4.3.3. MPCM (Minimum Product of Both CPU Utilization and Memory Size) Policy. As host’s CPU utilization and memory size are two important factors for energy efficiency in data center, if a host is being heavily loaded, MPCM policy selects a VM with the minimum product of both CPU utilization and memory size to migrate compared with the other VMs allocated to the host. MPCM policy chooses a VM 𝑢 that satisfies the following condition: (𝑢CPU × 𝑢memory ) ≤ (VCPU × Vmemory ) , ∀V ∈ VM𝑖 ,
(18)
where VM𝑖 means the set of VMs allocated to host 𝑖 and 𝑢CPU and 𝑢memory , respectively, represent CPU utilization and memory size currently utilized by the VM 𝑢. 4.4. VM Deployment Algorithm. VM deployment can be considered as a bin packing problem. In order to tackle the problem, a modification of the Best Fit Decreasing algorithm denoted by Energy-Aware Best Fit Decreasing (EBFD) could
be used to deal with it. As described earlier in Section 4.1, VMs on heavily loaded host or VMs on little-loaded host must be migrated to another host with light load (CPU utilization of a host at 𝑇𝑙 -𝑇𝑚 interval); VMs on lightly loaded host or VMs on moderately loaded host are kept unchanged. Algorithm 2 shows the pseudocode of EBFD, where 𝑇𝑙 , 𝑇𝑚 , and 𝑇ℎ are three thresholds in ATEA (the definition of the three thresholds in Section 4.2). “vmlist” is the set of all VMs. “hostlist” represents all hosts in the data centers. Line 1 (see Algorithm 2) means to sort all VM by CPU utilization in descending order. Line 3 represents that parameter “minimumPower” is assigned a maximum value. Line 6 is to check whether the host is suitable to accommodate the VM (e.g., host’s CPU capacity, memory size, and bandwidth). Function getUtilizationAfterAllocation means to obtain host’s CPU utilization after allocating a VM. Line 7 to Line 9 (see Algorithm 2) are to keep a host with light load (CPU utilization of a host at 𝑇𝑙 -𝑇𝑚 interval). Function getPowerAfterVM is to obtain the increasing of host’s energy consumption after allocating a VM. Line 11 to Line 15 are to find the host which owns the least increasing of power consumption caused by VM allocation. Line 19 is to return the destination hosts for accommodating VMs. The complexity of the EBFD is 𝑂(𝑚 × 𝑛); parameter 𝑚 represents the number of hosts, whereas parameter 𝑛 corresponds to the number of VMs which should be allocated.
5. Experiments and Performance Evaluation 5.1. Experiment Setup. Due to the advantages of CloudSim toolkit [20, 21] such as supporting on demand dynamic resource provisioning and modeling of virtualized environments and so on, we choose it as the simulation toolkit for our experiments. We have simulated a data center which includes 800 heterogeneous physical nodes, half of which consists of HP ProLiant G4 (Intel Xeon 3040, 2 cores 1860 MHz, 4 GB), and the other half are HP ProLiant G5 (Intel Xeon 3075, 2 cores 2660 MHz, 4 GB). There are 1052 VMs and four kinds of VM types (High-CPU Medium Instance (2500 MIPS, 0.85 GB); Extra Large Instance (2000 MIPS, 3.75 GB); Small Instance (1000 MIPS, 1.7 GB); and Micro Instance (500 MIPS, 613 MB)) in the data center. The characteristics of the VMs correspond to Amazon EC2 instance types. 5.2. Workload Data. Using real workload to do experiments is extremely significant for VM placement. In this paper, we utilize the workload coming from a CoMon project, which mainly monitors infrastructure for PlanetLab [22]. We obtain the data derived from more than a thousand VMs’ CPU utilization and the VMs placed at more than 500 places across the world. Table 2 [15] shows the characteristics of the data. 5.3. Experimental Results and Analysis. By using the workload data (described in Section 5.2), two kinds of adaptive three-threshold algorithm (KAM and KAI) and three kinds of VM selection policies (MMS, LCU, and MPCM) are simulated. In addition, for the two adaptive three-threshold
Scientific Programming
7
Require: 𝑇𝑙 , 𝑇𝑚 , 𝑇ℎ , vmlist, hostlist Ensure: migrationMap (1) vmList.sortByCpuUtilization( ); // sorted by CPU utilizatioin in descending order (2) for each vm in vmlist do (3) minimumPower = maximum; // minimunPower is assigned a maximum value (4) allocatedHost = null; (5) for each host in hostlist do (6) if (host is Suitable for Vm (vm)) then (7) utilization = getUtilizationAfterAllocation(host, vm); (8) if ((utilization < 𝑇𝑙 ) || (utilization > 𝑇𝑚 )) then (9) continue; (10) end if (11) EnergyConsumption = getPowerAfterVM(host, vm); (12) if (EnergyConsumption < minimumPower) then (13) minimumPower = EnergyConsumption; (14) allocatedHost = host; (15) end if (16) end if (17) end for (18) end for (19) return allocationHost. Algorithm 2: Energy-Aware Best Fit Decreasing (EBFD).
Table 2: Workload data characteristics (CPU utilization). Number of VMs 1052
Mean 12.31%
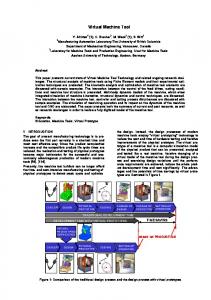
algorithm we have varied the parameters (𝑟 (7)–(9)) and ((11)–(13)) form 0.5 to 3.0 increasing by 0.5. Therefore, these variations have led to 36 combinations of the algorithms and parameters. For example, for KAM, there are three VM selection policies (MMS, LCU, and MPCM) denoted by KAM-MMS, KAM-LCU, and KAM-MPCM, respectively. Similarly, for KAI, there are also three VM selection policies (MMS, LCU, and MPCM) denoted by KAI-MMS, KAI-LCU, and KAI-MPCM, respectively. In the following section, we will discuss the energy consumption, SLATAH, PDM, SLA violations, and energy efficiency for the algorithms with different parameter. (1) Energy Consumption. For the six algorithms (KAM-MMS, KAM-LCU, KAM-MPCM, KAI-MMS, KAI-LCU, and KAIMPCM) with different parameter (0.5 to 3.0 increasing by 0.5), the energy consumption is shown in Figure 2, which shows the energy consumption for the six algorithms. As for KAM-MMS, KAM-LCU, and KAM-MPCM, KAM-MPCM leads to the least energy consumption, KAM-LCU the second energy consumption, and KAM-MMS the most energy consumption. The reason is that KAM-MPCM considers both CPU utilization and memory size when a host is with heavy load. Compared with KAM-MMS, KAM-LCU leads to less energy consumption. This can be explained by the fact that the processor (CPU) of a host consumes much more energy than its memory. Similarly, as for KAI-MMS, KAI-LCU,
St. dev. 17.09%
Quartile 1 2%
Median 6%
Quartile 3 15%
250 Energy consumption (kWh)
Date 03/03/2011
200 150 100 50 0 0.5
1.0
1.5
2.0
2.5
3.0
r
KAM-MMS KAM-LCU KAM-MPCM
KAI-MMS KAI-LCU KAI-MPCM
Figure 2: The energy consumption of the six algorithms.
and KAI-MPCM, KAI-MPCM leads to the least energy consumption, KAI-LCU the second energy consumption, and KAI-MMS the most energy consumption. The reason is that KAI-MPCM considers both CPU utilization and memory size when a host is with heavy load. Compared with
8
Scientific Programming 6
0.010
4 PDM (%)
SLATAH (%)
5
3
0.005
2 1 0.000
0 0.0
0.5
1.0
1.5
2.0
2.5
0.0
3.0
0.5
1.0
1.5
2.5
3.0
r
r
KAM-MMS KAM-LCU KAM-MPCM
2.0
KAM-MMS KAM-LCU KAM-MPCM
KAI-MMS KAI-LCU KAI-MPCM
Figure 4: The PDM of the six algorithms.
Figure 3: The SLATAH of the six algorithms.
(2) SLATAH. The SLATAH is described in Section 3.3 (see (3)). For the six algorithms (KAM-MMS, KAM-LCU, KAMMPCM, KAI-MMS, KAI-LCU, and KAI-MPCM) with different parameter (0.5 to 3.0 increasing by 0.5), the SLATAH is shown in Figure 3, which shows the SLATAH for the six algorithms. In terms of KAM-MMS, KAM-LCU, and KAMMPCM, KAM-MMS contributes to the least SLATAH, KAMMPCM the second, and KAM-LCU the most. The reason is as follows: when a host is with heavy load, KAM-MMS selects a VM with the minimum memory size to migrate leading to less migration time. Therefore, KAM-MMS leads to the least SLATAH compared with KAM-LCU and KAM-MPCM. Compared with KAM-MPCM, KAM-LCU contributes to much more SLATAH. This could be explained by the fact that SLATAH mainly depends on memory size but not CPU utilization. Similarly, as for KAI-MMS, KAI-LCU, and KAIMPCM, KAI-MMS contributes to the least SLATAH, KAIMPCM the second, and KAI-LCU the most. The reason is that KAI-MMS causes the least migration time leading to the least SLATAH. Compared with KAI-MPCM, KAI-LCU leads to much more SLATAH. This could also be explained by the fact that SLATAH mainly depends on memory size but not CPU utilization. (3) PDM. The PDM is described in Section 3.3 (see (2)). For the six algorithms (KAM-MMS, KAM-LCU, KAMMPCM, KAI-MMS, KAI-LCU, and KAI-MPCM) with different parameter (0.5 to 3.0 increasing by 0.5), the PDM is shown in Figure 4, which illustrates the PDM for the six algorithms. As for KAM-MMS, KAM-LCU, and KAM-MPCM, the PDM is the same. This could be explained by the fact that the overall performance degradation caused by VMs due to migration is the same. Furthermore, when parameter 𝑟 = 0.5, 1.0, and 1.5,
50
SLA violations (10−7 )
KAI-MMS, KAI-LCU leads to less energy consumption. This can be also explained by the fact that the processor (CPU) of a host consumes much more energy than its memory.
KAI-MMS KAI-LCU KAI-MPCM
40 30 20 10 0 0.5
1.0
1.5
2.0
2.5
3.0
r
KAM-MMS KAM-LCU KAM-MPCM
KAI-MMS KAI-LCU KAI-MPCM
Figure 5: The SLA violations of the six algorithms.
respectively, the corresponding PDM of the three algorithms (KAM-MMS, KAM-LCU, and KAM-MPCM) are 0. As for KAI-MMS, KAI-LCU, and KAI-MPCM, the PDM is also the same. This could also be explained by the fact that the overall performance degradation caused by VMs due to migration is the same. At the same time, when parameter 𝑟 = 0.5, the PDM of the three algorithms (KAI-MMS, KAI-LCU, and KAI-MPCM) are 0. (4) SLA Violations. The SLA violations are described in Section 3.3 (see (4)). For the six algorithms (KAM-MMS, KAM-LCU, KAM-MPCM, KAI-MMS, KAI-LCU, and KAIMPCM) with different parameter (0.5 to 3.0 increasing by 0.5), the SLA violations are shown in Figure 5, which shows the SLA violations for the six algorithms. From (4), the SLA
Scientific Programming
9 Table 3: Comparison of the VMs select policies using paired 𝑡-tests. Policy 1 Policy 2 MMS (3579.5) LCU (2228.3) MMS (3579.5) MPCM (3109.9) MPCM (3109.9) LCU (2228.3)
Energy efficiency
8000
6000
Difference 1531.2 469.6 881.6
𝑃 value 𝑃 value < 0.05 𝑃 value > 0.05 𝑃 value < 0.05
4000
2000
0 0.5
1.0
1.5
2.0
2.5
3.0
r
KAM-MMS KAM-LCU KAM-MPCM
KAI-MMS KAI-LCU KAI-MPCM
Figure 6: The energy efficiency of the six algorithms.
violations depend on SLATAH (Figure 3) and PDM (Figure 4). As for KAM-MMS, KAM-LCU, and KAM-MPCM, the PDM is the same. Therefore, SLA violations depend on SLATAH. In terms of KAM-MMS, KAM-LCU, and KAMMPCM, KAM-MMS contributes to the least SLATAH, KAMMPCM the second, and KAM-LCU the most. So, KAM-MMS contributes to the least SLA violations, KAM-MPCM the second, and KAM-LCU the most. Furthermore, when parameter 𝑟 = 0.5, 1.0, and 1.5, respectively, the corresponding PDM of the three algorithms (KAM-MMS, KAM-LCU, and KAMMPCM) are 0. Therefore, the corresponding SLA violations of the three algorithms (KAM-MMS, KAM-LCU, and KAMMPCM) are 0. By the same way, as for KAI-MMS, KAI-LCU, and KAI-MPCM, KAI-MMS contributes to the least SLA violations, KAI-MPCM the second, and KAI-LCU the most. At the same time, when parameter 𝑟 = 0.5, the PDM of the three algorithms (KAI-MMS, KAI-LCU, and KAI-MPCM) are 0. Therefore, the SLA violations of the three algorithms (KAI-MMS, KAI-LCU, and KAI-MPCM) are 0. (5) Energy Efficiency. For the six algorithms (KAM-MMS, KAM-LCU, KAM-MPCM, KAI-MMS, KAI-LCU, and KAIMPCM) with different parameter (0.5 to 3.0 increasing by 0.5), the energy efficiency (𝐸) is shown in Figure 6, which shows the energy efficiency of the six algorithms. As discussed in Section 3.4, (5) depends on energy consumption (Figure 2) and SLA violation (Figure 5). Compared with KAM-LCU and KAM-MPCM, the energy efficiency of KAMMMS is the most. The reason is that KAM-MMS reduces the migration time of VMs. In terms of energy efficiency, KAMMPCM is better than KAM-LCU. This can be explained by the fact that KAM-MPCM considers both CPU utilization and memory size. As (5) is related to energy consumption (Figure 2) and SLA violation (Figure 5), when parameter 𝑟 = 0.5, 1.0, and 1.5, respectively, the corresponding SLA violations of the three algorithms (KAM-MMS, KAM-LCU, and KAM-MPCM) are 0. Therefore, the corresponding
energy efficiency of the three algorithms (KAM-MMS, KAMLCU, and KAM-MPCM) is 0. Similarly, compared with KAILCU and KAI-MPCM, the energy efficiency of KAI-MMS is the most; the reason is that KAI-MMS reduces the migration time of VMs. In terms of energy efficiency, KAI-MPCM is better than KAI-LCU. This can be explained by the fact that KAI-MPCM considers both CPU utilization and memory size. As (5) is related to energy consumption (Figure 2) and SLA violation (Figure 5), when parameter 𝑟 = 0.5, the corresponding SLA violations of the three algorithms (KAI-MMS, KAI-LCU, and KAI-MPCM) are 0. Therefore, the corresponding energy efficiency of the three algorithms (KAI-MMS, KAI-LCU, and KAI-MPCM) is 0. Considering energy efficiency, we choose the parameter of six algorithms to maximize the energy efficiency. Figure 6 illustrates that parameter 𝑟 = 2.0 for KAM-MMS is the best (denoted by KAM-MMS-2.0), parameter 𝑟 = 3.0 for KAMLCU is the best (denoted by KAM-LCU-3.0), parameter 𝑟 = 3.0 for KAM-MPCM is the best (denoted by KAM-MPCM3.0), parameter 𝑟 = 1.0 for KAI-MMS is the best (denoted by KAI-MMS-1.0), parameter 𝑟 = 1.0 for KAI-LCU is the best (denoted by KAI-LCU-1.0), and parameter 𝑟 = 1.0 for KAIMPCM is the best (denoted by KAI-MPCM-1.0). For the two kinds of adaptive three-threshold algorithms (KAM and KAI), there are three VMs select policies which could be provided. Does a policy that is the best compared with other two policies in regard to energy efficiency exist? If it exists, which VM select policy is the best? In order to solve this problem, we have made three paired 𝑡-tests to determine which VM policy is the best in regard to energy efficiency. Before using the three paired 𝑡-tests, according to RyanJoiner’s normality test, we verify the three VM select policies (MMS, LCU, and MPCM) with different parameter (𝑟) that maximization energy efficiency follows a normal distribution with 𝑃 value = 0.2 > 0.05. The paired 𝑡-tests results are showed in Table 3, which shows that MMS leads to a statistically significantly upper value of energy efficiency with 𝑃 value < 0.05 compared with LCU and MPCM. In other words, in terms of energy efficiency, MMS is the best VM select policy compared with LCU and MPCM. Therefore, KAM-MMS2.0 and KAI-MMS-1.0 are the best combination in regard to energy efficiency. In the following section, we use KAMMMS-2.0 and KAI-MMS-1.0 to make comparison with other energy-saving algorithms. (6) Comparison with Other Energy-Saving Algorithms. In this section, the NPA (Nonpower Aware), DVFS [9], THR-MMT1.0 [15], THR-MMT-0.8 [15], MAD-MMT-2.5 [15], IQRMMT-1.5 [15], and MIMT [16] are chosen to make comparison in regard to energy efficiency. The related experimental results are shown in Table 4.
10
Scientific Programming Table 4: The comparison of the energy-saving algorithms.
Algorithm NPA DVFS THR-MMT-1.0 THR-MMT-0.8 MAD-MMT-2.5 IQR-MMT-1.5 MIMT (0–40%–80%) MIMT (5%–45%–85%) KAM-MMS-2.0 KAI-MMS-1.0
Energy efficiency (KWh)
Energy consumption (×10−7 )
SLA violations
SLATAH (%)
PDM (%)
Number of VM migrations
— — 38 170 169 166 5420 4949 9231 6393
2410.8 803.91 99.95 119.40 114.27 117.08 108.53 112.26 83.33 104.28
— — 2613 492 518 514 17 18 13 15
— — 26.97 4.99 5.24 5.08 2.86 3.22 1.73 2.03
— — 0.10 0.10 0.10 0.10 0.01 0.01 0.01 0.01
— — 19852 26567 25923 26420 8418 8687 6808 7519
Table 4 illustrates the energy efficiency, energy consumption, and SLA violations for the energy-saving algorithms. As the NPA algorithm does not take any energy-saving policy leading to 2410.8 KWh, DVFS algorithm reduces this value to 803.91 KWh by adjusting its CPU frequency dynamically. Because NPA and DVFS algorithm have no VMs migration, the symbol “—” is used to represent the energy efficiency, SLA violations, SLATAH, PDM, and number of VMs’ migration. In terms of energy efficiency, THR-MMT-1.0 and THRMMT-0.8 algorithms are better than DVFS. The reason is that THR-MMT-1.0 and THR-MMT-0.8 algorithms set the fixed threshold to migrate VMs leading to upper energy efficiency. MAD-MMT-2.5 and IQR-MMT-1.5 are two kinds of adaptive threshold algorithm, which (MAD-MMT-2.5 and IQR-MMT-1.5) are better than THR-MMT-1.0 in regard to energy efficiency. This could be described by the fact that MAD-MMT-2.5 and IQR-MMT-1.5 dynamically set two thresholds to improve the energy efficiency. But compared with THR-MMT-0.8, the three algorithms (MAD-MMT-2.5, IQR-MMT-1.5, and THR-MMT-0.8) are at the same level in regard to energy efficiency. This could be explained by the fact that the 0.8 threshold value is a proper value for the THRMMT algorithm. KAM-MMS-2.0 and KAI-MMS-1.0 algorithms are better than MIMT (0–40%–80%) and MIMT (5%–45%–85%). This could be explained by the fact that MIMT (0–40%–80%) and MIMT (5%–45%–85%) set the fixed threshold to control the migration of VMs, while KAM-MMS-2.0 and KAI-MMS1.0 autoadjust threshold to control the migration of VMs according to the workload. Table 4 also shows that KAM-MMS-2.0 and KAI-MMS1.0 algorithms, respectively, improve the energy efficiency compared with IQR-MMT-1.5, MAD-MMT-2.5, THR-MMT0.8, and THR-MMT-1.0 and maintain the low SLA violation of 13 × 10−7 . In addition, KAM-MMS-2.0 and KAIMMS-1.0 algorithms, respectively, generate 2-3 times fewer VMs migrations than IQR-MMT-1.5, MAD-MMT-2.5, THRMMT-0.8, and THR-MMT-1.0. The reason is as follows. On one hand, KAM-MMS-2.0 and KAI-MMS-1.0 are two kinds of adaptive three-threshold algorithm, which dynamically set
three thresholds, leading to the data center hosts to be divided into four classes (hosts with little load, hosts with light load, hosts with moderate load, and hosts with heavy load), and migrate the VMs on heavily loaded and little-loaded hosts to the host with light load, while the VMs on lightly loaded and moderately loaded hosts remain unchanged. Therefore, KAM-MMS-2.0 and KAI-MMS-1.0 algorithm reduce the migration time and improve the migration efficiency compared with other energy-saving algorithms. On the other hand, KAM-MMS-2.0 and KAI-MMS-1.0, respectively, select the best VMs select policy (MMS) combination with the best parameter (𝑟) compared with other energy-saving algorithms.
6. Conclusions This paper proposes a novel VMs deployment algorithm based on the combination of adaptive three-threshold algorithm and VMs selection policies. This paper shows that dynamic thresholds are more energy efficient than fixed threshold. The proposed algorithms are expected to be applied in real-world cloud platforms, aiming at reducing the energy costs for cloud data centers.
Competing Interests The authors declare that they have no competing interests.
Acknowledgments This work was supported by the National Natural Science Foundation (nos. 61572525 and 61272148), the Ph.D. Programs Foundation of Ministry of Education of China (no. 20120162110061), the Fundamental Research Funds for the Central Universities of Central South University (no. 2014zzts044), the Hunan Provincial Innovation Foundation for Postgraduate (no. CX2014B066), and China Scholarship Council.
Scientific Programming
11
References [1] H. Khazaei, J. Miˇsi´c, V. B. Miˇsi´c, and S. Rashwand, “Analysis of a pool management scheme for cloud computing centers,” IEEE Transactions on Parallel and Distributed Systems, vol. 24, no. 5, pp. 849–861, 2013. [2] J. Carretero and J. G. Blas, “Introduction to cloud computing: platforms and solutions,” Cluster Computing, vol. 17, no. 4, pp. 1225–1229, 2014. [3] L. Wang and S. U. Khan, “Review of performance metrics for green data centers: a taxonomy study,” Journal of Supercomputing, vol. 63, no. 3, pp. 639–656, 2013. [4] D. Rinc´on, A. Agust´ı-Torra, J. F. Botero et al., “A novel collaboration paradigm for reducing energy consumption and carbon dioxide emissions in data centres,” The Computer Journal, vol. 56, no. 12, pp. 1518–1536, 2013. [5] L. A. Barroso and U. H¨olzle, “The case for energy-proportional computing,” Computer, vol. 40, no. 12, pp. 33–37, 2007. [6] P. Bohrer, E. N. Elnozahy, T. Keller et al., “The case for power management in web servers,” in Power Aware Computing, Computer Science, pp. 261–289, Springer, Berlin, Germany, 2002. [7] S. K. Garg, S. Versteeg, and R. Buyya, “A framework for ranking of cloud computing services,” Future Generation Computer Systems, vol. 29, no. 4, pp. 1012–1023, 2013. [8] Y. C. Lee and A. Y. Zomaya, “Energy conscious scheduling for distributed computing systems under different operating conditions,” IEEE Transactions on Parallel and Distributed Systems, vol. 22, no. 8, pp. 1374–1381, 2011. [9] H. Hanson, S. W. Keckler, S. Ghiasi, K. Rajamani, F. Rawson, and J. Rubio, “Thermal response to DVFS: analysis with an Intel Pentium M,” in Proceedings of the International Symposium on Low Power Electronics and Design (ISLPED ’07), pp. 219–224, August 2007. [10] J. Kang and S. Ranka, “Dynamic slack allocation algorithms for energy minimization on parallel machines,” Journal of Parallel and Distributed Computing, vol. 70, no. 5, pp. 417–430, 2010. [11] R. Buyya, R. Ranjan, and R. N. Calheiros, “Modeling and simulation of scalable cloud computing environments and the CloudSim toolkit: challenges and opportunities,” in Proceedings of the International Conference on High Performance Computing and Simulation (HPCS ’09), pp. 1–11, Leipzig, Germany, June 2009. [12] A. Beloglazov and R. Buyya, “Energy efficient resource management in virtualized cloud data centers,” in Proceedings of the 10th IEEE/ACM International Symposium on Cluster, Cloud, and Grid Computing (CCGrid ’10), pp. 826–831, IEEE, Melbourne, Australia, May 2010. [13] A. Beloglazov, J. Abawajy, and R. Buyya, “Energy-aware resource allocation heuristics for efficient management of data centers for Cloud computing,” Future Generation Computer Systems, vol. 28, no. 5, pp. 755–768, 2012. [14] A. Beloglazov and R. Buyya, “Adaptive threshold-based approach for energy-efficient consolidation of virtual machines in cloud data centers,” in Proceedings of the ACM 8th International Workshop on Middleware for Grids, Clouds and e-Science (MGC ’10), pp. 1–6, Bangalore, India, December 2010. [15] A. Beloglazov and R. Buyya, “Optimal online deterministic algorithms and adaptive heuristics for energy and performance efficient dynamic consolidation of virtual machines in cloud
[16]
[17]
[18]
[19]
[20]
[21]
[22]
data centers,” Concurrency Computation Practice and Experience, vol. 24, no. 13, pp. 1397–1420, 2012. Z. Zhou, Z.-G. Hu, T. Song, and J.-Y. Yu, “A novel virtual machine deployment algorithm with energy efficiency in cloud computing,” Journal of Central South University, vol. 22, no. 3, pp. 974–983, 2015. X. Fan, W.-D. Weber, and L. A. Barroso, “Power provisioning for a warehouse-sized computer,” in Proceedings of the 34th Annual International Symposium on Computer Architecture (ISCA ’07), pp. 13–23, ACM, June 2007. D. Kusic, J. O. Kephart, J. E. Hanson, N. Kandasamy, and G. Jiang, “Power and performance management of virtualized computing environments via lookahead control,” Cluster Computing, vol. 12, no. 1, pp. 1–15, 2009. W. Voorsluys, J. Broberg, S. Venugopal, and R. Buyya, “Cost of virtual machine live migration in clouds: a performance evaluation,” in Cloud Computing: First International Conference, CloudCom 2009, Beijing, China, December 1–4, 2009. Proceedings, vol. 5931 of Lecture Notes in Computer Science, pp. 254–265, Springer, Berlin, Germany, 2009. R. N. Calheiros, R. Ranjan, A. Beloglazov, C. A. F. De Rose, and R. Buyya, “CloudSim: a toolkit for modeling and simulation of cloud computing environments and evaluation of resource provisioning algorithms,” Software: Practice and Experience, vol. 41, no. 1, pp. 23–50, 2011. B. Wickremasinghe, R. N. Calheiros, and R. Buyya, “CloudAnalyst: a cloudsim-based visual modeller for analysing cloud computing environments and applications,” in Proceedings of the 24th IEEE International Conference on Advanced Information Networking and Applications (AINA ’10), pp. 446–452, IEEE, Perth, Australia, April 2010. K. S. Park and V. S. Pai, “CoMon: a mostly-scalable monitoring system for PlanetLab,” ACM SIGOPS Operating Systems Review, vol. 40, no. 1, pp. 65–74, 2006.
Journal of
Advances in
Industrial Engineering
Multimedia
Hindawi Publishing Corporation http://www.hindawi.com
The Scientific World Journal Volume 2014
Hindawi Publishing Corporation http://www.hindawi.com
Volume 2014
Applied Computational Intelligence and Soft Computing
International Journal of
Distributed Sensor Networks Hindawi Publishing Corporation http://www.hindawi.com
Volume 2014
Hindawi Publishing Corporation http://www.hindawi.com
Volume 2014
Hindawi Publishing Corporation http://www.hindawi.com
Volume 2014
Advances in
Fuzzy Systems Modelling & Simulation in Engineering Hindawi Publishing Corporation http://www.hindawi.com
Hindawi Publishing Corporation http://www.hindawi.com
Volume 2014
Volume 2014
Submit your manuscripts at http://www.hindawi.com
Journal of
Computer Networks and Communications
Advances in
Artificial Intelligence Hindawi Publishing Corporation http://www.hindawi.com
Hindawi Publishing Corporation http://www.hindawi.com
Volume 2014
International Journal of
Biomedical Imaging
Volume 2014
Advances in
Artificial Neural Systems
International Journal of
Computer Engineering
Computer Games Technology
Hindawi Publishing Corporation http://www.hindawi.com
Hindawi Publishing Corporation http://www.hindawi.com
Advances in
Volume 2014
Advances in
Software Engineering Volume 2014
Hindawi Publishing Corporation http://www.hindawi.com
Volume 2014
Hindawi Publishing Corporation http://www.hindawi.com
Volume 2014
Hindawi Publishing Corporation http://www.hindawi.com
Volume 2014
International Journal of
Reconfigurable Computing
Robotics Hindawi Publishing Corporation http://www.hindawi.com
Computational Intelligence and Neuroscience
Advances in
Human-Computer Interaction
Journal of
Volume 2014
Hindawi Publishing Corporation http://www.hindawi.com
Volume 2014
Hindawi Publishing Corporation http://www.hindawi.com
Journal of
Electrical and Computer Engineering Volume 2014
Hindawi Publishing Corporation http://www.hindawi.com
Volume 2014
Hindawi Publishing Corporation http://www.hindawi.com
Volume 2014