Hindawi Publishing Corporation Shock and Vibration Volume 2015, Article ID 194230, 12 pages http://dx.doi.org/10.1155/2015/194230
Research Article Research on High-Frequency Combination Coding-Based SSVEP-BCIs and Its Signal Processing Algorithms Feng Zhang, Chengcheng Han, Lili Li, Xin Zhang, Jun Xie, and Yeping Li School of Mechanical Engineering, Xi’an Jiaotong University, Xi’an 710049, China Correspondence should be addressed to Feng Zhang;
[email protected] Received 13 February 2015; Accepted 15 April 2015 Academic Editor: Yanxue Wang Copyright © 2015 Feng Zhang et al. This is an open access article distributed under the Creative Commons Attribution License, which permits unrestricted use, distribution, and reproduction in any medium, provided the original work is properly cited. This study presents a new steady-state visual evoked potential (SSVEP) paradigm for brain computer interface (BCI) systems. The new paradigm is High-Frequency Combination Coding-Based SSVEP (HFCC-SSVEP). The goal of this study is to increase the number of targets using fewer stimulation frequencies, with diminishing subject’s fatigue and reducing the risk of photosensitive epileptic seizures. This paper investigated the HFCC-SSVEP high-frequency response (beyond 25 Hz) for 3 frequencies (25 Hz, 33.33 Hz, and 40 Hz). HFCC-SSVEP produces 𝑛𝑛 with 𝑛 high stimulation frequencies through Time Series Combination Code. Furthermore, The Improved Hilbert-Huang Transform (IHHT) is adopted to extract time-frequency feature of the proposed SSVEP response. Lastly, the differentiation combination (DC) method is proposed to select the combination coding sequence in order to increase the recognition rate; as a result, IHHT algorithm and DC method for the proposed SSVEP paradigm in this study increase recognition efficiency so as to improve ITR and increase the stability of the BCI system. Furthermore, SSVEPs evoked by highfrequency stimuli (beyond 25 Hz) minimally diminish subject’s fatigue and prevent safety hazards linked to photo-induced epileptic seizures. This study tests five subjects in order to verify the feasibility of the proposed method.
1. Introduction A brain computer interface (BCI) is a direct communication pathway between a human or animal brain and an external device. Nowadays, noninvasive scalp electroencephalogram (EEG) measurements have become a popular solution in BCI research. The most commonly used signals in EEG-based BCI systems are event-related synchronization of mu and beta bands, event-related potentials, and steady-state visual evoked potential (SSVEP) [1–3]. The SSVEP is usually elicited by flickering stimulation frequency higher than 6 Hz, while the frequency for inducing FVEP (Flash Visual Evoked Potential) should be lower than 2 Hz [4]. The most common measure to assess the performance of a BCI system is Shannon’s information transfer rate (ITR) [5]. Steady-state visual evoked potential (SSVEP) has been regarded as an efficient approach to design BCI with high information transfer rate (ITR). SSVEP-based systems lead to transfer rates of 100 bits/min and beyond [2, 6], compared to about 10–25 bits/min of other BCI systems [5]. Furthermore, SSVEP-based BCI systems have the advantages
of short responding time, minimum training, and high ITR [4, 7, 8]. The visual stimulator plays an important role in an SSVEP BCI. Several visual stimulators have been used for evoking SSVEP, such as a cathode ray tube (CRT) monitor [9], liquid crystal display (LCD) monitor, and light-emitting diode (LED) array [10]. Considering stimulation parameters such as size, color, and position, LED arrays are not flexible and increase the overall system cost; presenting flickers on a computer monitor is more flexible than using stand-alone lights/LEDs [9]. Current SSVEP-based BCI system utilizes single frequency to encode each target. Hence, a large number of targets require a large number of frequencies. Increasing the number of targets then decreases the frequency resolution which in turn makes classification more difficult. This is especially problematic on computer screens. Recently, some researchers began to study how to increase the number of targets with fewer frequencies, such as stimuli flickered at the same frequency and differed only in relative phase [11], rightand-left field stimulation with two frequencies [12], and using
2
Shock and Vibration
FCz
Fz
Cz CPz
AFz F3
Fpz Ground
Pz
C3
FPz FP1
P3 F7
POz
T7 P7
Stimulate123
3.5
A1
Reference
3
O1
Oz
A1
2.5 2 1.5
BioAamplifier
1 CRT
0.5 0
f1 = 25 Hz
0 0.2 0.4 0.6 0.8 1 1.2 1.4 1.6 1.8 2
f2 = 33.33 Hz
t (s) Δt
1 f1
1 f2
A/D converter
f3 = 40 Hz
1 f3
Signal processing
Stimulate frequency: f1 , f2 , f3
Flicking sequences based on High-Frequency Combination Code
Device commands
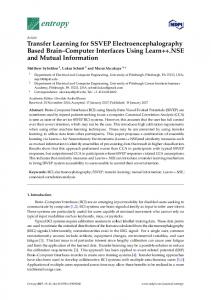
Figure 1: Block diagram of a TSCCBH-SSVEP for BCI.
dual frequency stimulation [4]. However, SSVEPs are usually evoked by low-mid frequencies in the 7–30 Hz, but the lowmid frequency band has some disadvantages [8]. First, the low frequency band covers the alpha band (8–13 Hz) which can cause a considerable amount of false positives. Second, subjective evaluations showed that frequencies between 5 and 25 Hz are more annoying than higher ones; visual fatigue would easily occur. Third, flash and pattern reversal stimuli can provoke epileptic seizures especially in the 15–25 Hz range [13]. All of these disadvantages can be avoided by using the high frequency band [14–16]. This study proposes High-Frequency Combination Coding-Based flickers for evoking SSVEP (HFCC-SSVEP). The HFCC-SSVEP is essentially based on frequency modulation. Each flicker comprises different high flickering frequencies through High-Frequency Combination Code. The High-Frequency Combination Coding-Based SSVEP (beyond 25 Hz) is induced by CRT (Cathode Ray Tube) and LED. This system uses only one Oz-A1 EEG channel for SSVEP recording. The proposed new paradigm produces 𝑛𝑛 with 𝑛 high stimulation frequencies through Time Series Combination Code. Furthermore, conventional spectral methods are not always suitable for detecting high-frequency SSVEPs. In this paper, an improved HHT- (HilbertHuang Transform-) based high-frequency-modulated SSVEP feature extraction method is proposed to extract time-frequency feature of the proposed SSVEP response.
Furthermore, SSVEPs evoked by high-frequency stimuli (beyond 25 Hz) minimally diminish subject’s fatigue and prevent safety hazards linked to photo-induced epileptic seizures.
2. Subject and Experimental Condition Three healthy volunteers (three males randomly selected from the students in the research institution), aged from 21 to 25 years old, participated in this study from Xi’an Jiaotong University. They were seated in a comfortable armchair in a dimly illuminated EEG signals testing lab, which is quiet without any distractions. All participants were 50 cm away from the stimulation unit (CRT display OR LED). EEG signals were measured from three EEG electrodes (g.USBamp, g.tec Guger Technologies, Austria) placed at Oz-A1 (Ozunilateral earlobe) and Fpz (ground) in compliance with the international EEG 10–20 system. The unilateral (left or right) earlobe was used as the recording reference, and all electrode impedances were kept below 5 kOhm. The experimental data sampling frequency is 1200 Hz.
3. Experiment Paradigm Figure 1 shows the block diagram of a HFCC-SSVEP for BCI. HFCC-SSVEPs were induced by 27 stimulus series; these stimuli were displayed by cycle flickers at the center of CRT.
3
40
40
20
20 Volt. (𝜇V)
Volt. (𝜇V)
Shock and Vibration
0
−20
−40
0
−20
5 t (s)
0
10
−40
0
40
40
20
20
0
−20
−40
10
5 t (s)
10
(b)
Volt. (𝜇V)
Volt. (𝜇V)
(a)
5 t (s)
0
−20
0
5 t (s)
10
−40
0
(c)
(d)
Figure 2: SSVEP signals of LED.
The 27 stimulus series were generated from 3 fundamental frequency elements through Time Series Combination Code. The used fundamental frequency elements were only three high frequencies, that is, 25, 33.33, and 40 Hz; the three frequencies were labeled as 1, 2, and 3. The selection of fundamental frequency elements depended on the screen refresh rate and sampling rate. Each fundamental frequency element was generated from 20 pulses. The data lengths of 27 stimulus series were variably between 1.5 s and 2.4 s. The subjects gazed each stimulus sequence and the stimulus sequence was displayed by cycle flickers at the center of CRT.
4. Data Processing and Result Figure 2 shows EEG signals of SSVEP response presented through LED with 25 Hz, 30 Hz, 40 Hz, and 75 Hz. The length of EEG data is 8 s. The frequency spectrum of EEG signals was determined using the fast Fourier transform (FFT) technique in MATLAB software. Figure 3 shows the FFT spectrum of SSVEP EEG signals of LED. The spectrum frequency
detection is usually the appropriate for frequency analysis of SSVEPs in BCI applications. Figure 4 shows FFT’s amplitude of EEG signals for LED. Figure 3 shows that SSVEP response of 25 Hz, 30 Hz, and 40 Hz is sensitive, but the 75 Hz spectral line cannot be distinguished in the FFT spectrum from Figure 3. Figure 4 shows the fitted curve of FFT spectrum energy. In this study, each Oz-A1 EEG signal was segmented into ten segments. Figure 10 shows that SCCBH-SSVEP EEG signals 6 of 27 selections. The length of EEG data is unequal between 1.5 s and 2.4 s. The frequency spectrum of averaged EEG signals was determined using the fast Fourier transform (FFT) technique in MATLAB software. The spectrum frequency detection is usually the appropriate for frequency analysis of SSVEPs in BCI applications; but the FFT spectrum cannot contain temporal information. The 27 selections represented by three high frequencies elements cannot be distinguished from each other in the FFT spectrum. Spectrum analysis is usually used to extract the frequency information in traditional evoked SSVEPs responses. The
4
Shock and Vibration 2
3
1.5 X: 25 Y: 2.237
Volt. (𝜇V)
Volt. (𝜇V)
2
X: 30 Y: 1.7
1
1 0.5
0 20
40
60
0 20
80
40
(a)
80
(b)
2
2
1.5
X: 75.22 Y: 1.055
1.5
X: 40 Y: 1.603
Volt. (𝜇V)
Volt. (𝜇V)
60 f (Hz)
f (Hz)
1
1
0.5
0.5
0
0 20
40
60
80
20
f (Hz)
40
60
80
f (Hz)
(c)
(d)
Figure 3: FFT of signals of LED.
2.5
Volt. (𝜇V)
2
1.5
1
0.5
0
20
40
60
80 f (Hz)
100
Figure 4: The fitted curve of FFT energy.
120
underlying idea is always the same: a blinking or moving visual stimulus at a constant frequency (the stimulus frequency) elicits a response in the brain at the same frequency and its even harmonics (SSVEP frequency is equal to stimulus frequency plus its even harmonics). Note that this behavior denotes a nonlinearity of the visual system [5]. The evoked SSVEP response of High-Frequency Combination Coding-Based stimulus not only contains frequency information but also contains temporal information. The frequency information consists of three frequencies through Time Series Combination Code; the length of 𝑡 evoked SSVEP response data varies between 1.5 s and 2.4 s (see Figure 2); as a result, the evoked SSVEP responses are nonstationary and nonlinear. The traditional spectrum detection method is not suited for analyzing the time series combination coding-based high-frequency evoked SSVEP response. More sophisticated nonstationary and nonlinear signal processing techniques have recently been used to analyze the evoked SSVEP response [17–19].
Shock and Vibration
5
Hilbert-Huang transforms [20], consisting of empirical mode decomposition (EMD) and Hilbert spectral analysis, is a newly developed adaptive data analysis method. The HHT is designed specifically for analyzing nonlinear and nonstationary data. The key part of HHT is EMD with which any complicated data set can be decomposed into a finite and often small number of intrinsic mode functions (IMFs). The instantaneous frequency defined using the Hilbert transform denotes the physical meaning of local phase change better for IMFs than for any other non-IMF time series. As the decomposition is based on the local characteristics of the data, it has been proved quite versatile in a broad range of applications for extracting signals from data generated in noisy nonlinear and nonstationary processes [21]. It has been widely used to analyze EEG signals [22–26]. In order to extract the time-frequency characteristics of highfrequency time series combination coding-based SSVEPs, we proposed IHHT-based high-frequency time-modulated SSVEP method. Figure 9 shows the steps of HHT-based high-frequency time-modulated SSVEP feature extraction, a local spectrum extreme target identification algorithm and differentiation combination method. The extraction method consists of synchronous averaging, band pass filtering, EMD, selection of IMF, instantaneous frequency, and Hilbert spectrum. In order to ensure that the time-frequency characteristics of high-frequency time series combination coding-based SSVEPs are efficiently extracted, we must choose and optimize the key algorithm. The specific method is as follows. The end effect and stopping criterion are the core problems of empirical mode decomposition (EMD); two methods are selected and optimized in order to overcome the shortage of end effect and stopping criterion of empirical mode decomposition (EMD) in the processing of variable frequency EEG data.
mode decomposition (EMD) in the processing of variable frequency EEG data.
(i) Optimization Selection of the EMD Endpoint Prediction. Upper and lower envelope averaging is one of the cores of the EMD algorithm; the upper and lower envelopes are attained through the extreme value point of the spline curve fitting. The EMD end effect is how to find the proper fitting curve between the last extreme value point and endpoint in the curve fitting. The boundary prediction method and traditional method are compared in order to optimize the problem for the end effect in the high-frequency timemodulated SSVEP feature extraction. Figure 5 shows the boundary prediction method. The boundary prediction method is to use the 1 order approximate point as the endpoint. Through the theoretical and real data analysis [27], it is not only to conform to the conditions of the cubic spline curve fitting but also to ensure that the fitting curve fluctuation is minimal. In Figure 6, E-Natural curve is the upper envelope curve fitting based on cubic spline curve through the boundary prediction method, Natural curve is the upper envelope curve fitting based on cubic spline curve through the traditional method. Figure 6 shows that the fluctuation of the fitting curve based on boundary prediction in the end is minimal. So the boundary predictions are used to overcome the shortage of end effect of empirical
(a) Ensure that the EMD algorithm is essentially binary half-band filter bank.
(ii) The Parameter Optimization of EMD Stopping Criterion. The EMD algorithm is essentially a process of screening; the screening mathematical formula is as follows: 𝑛
𝑥 (𝑡) = ∑𝑐𝑗 𝑗=1
𝑘
𝑘
𝑝
𝑗=1
𝑗=1
𝑗=1
(1)
= 𝑥 (𝑡) − ∑ 𝑚𝑗 + ( ∑𝑚𝑗 − ∑𝑚2𝑗 ) + . . . . In formula, 𝑥(𝑡) is the target signal, 𝑐𝑗 is the IMF that is decomposed through the EMD algorithm, 𝑛 is the number of IMF, 𝑚𝑗 , 𝑚2𝑗 is the average of the upper and lower envelope curve in the process of screening, and 𝑘, 𝑝 is the number of screening. The core problem of EMD is how to choose the end conditions in every process of screening, which is the problem of the EMD stopping criterion. The EMD algorithm is essentially binary half-band filter, which is actually binary wavelet. In order to ensure the screening results of IMF in the amplitude and that frequency has enough physical meaning, which essentially is to ensure that scale ratio of the adjacent two IMF values is close to 2, the number of screening (𝑘, 𝑝) must be limited in the process of screening. The fixed sifting (iterating) 10 times are used to overcome the shortage of stopping criterion of empirical mode decomposition (EMD) in the processing of variable frequency EEG data, That is 𝑘 = 𝑝 = 10, which can ensure that scale ratio of the adjacent two IMF values is close to 2. The advantage of this selection is as follows [28]:
(b) Ensure that the result has physical meaning. (c) The decomposition results number is limited