Research on Patterns of User Interactions and Media Popularity on Online Social Networks Renjie Zhou, Huiqiang Wang, Guangsheng Feng, Bingyang Li, Wenjin Jin, Xu Lu
Research on Patterns of User Interactions and Media Popularity on Online Social Networks 1
Renjie Zhou, 2Huiqiang Wang, 3Guangsheng Feng, 4Bingyang Li, 5Wenjin Jin, 6Xu Lu 1,2,3,4 Harbin Engineering Univeristy {renjie_zhou,wanghuiqiang, fengguangsheng, libingyang}@hrbeu.edu.cn 5 Yiwu Industrial & Commercial College
[email protected] 6 China Shipbuilding Industry Corporation,
[email protected]
Abstract In the past eight years, online social networking sites have rocketed from a niche activity into a phenomenon that engages tens of millions of internet users. The advent of online social networks (OSNs) not only provides more chances for people to enjoy entertainment and conduct business but also drives a novel way for researchers to study social interactions. In this paper, we conducted a data-driven investigation in the interactions between the Google Buzz users. We have several interesting findings from the investigation. First, we found that even though Google Buzz provides a platform for users to import posts from other online social networks like Twitter and YouTube, the majority activities happened directly on Google Buzz platform. Second, we found that the user activities are highly skewed, with a few users account for the most majority posts and comments, while the rest majority users account for a small fraction of user activities. Third, we found that the commenting on a self-posted post is of high importance, since it will promote the user interactions with more comments and longer active period. Our findings in the patterns of user interactions and media popularity on OSNs provide several key insights for promoting advertisement and business on OSNs.
Keywords: Online Social Networks, Google Buzz, Interaction Patterns, Popularity 1. Introduction Online social networking services have been experiencing a rapid development in the past decade, which enable people to establish online relationships and thereafter share news, photos, videos, interests, activities, and ideas via them. Social networking services are providing a new way for individuals to communicate digitally and many of them have gained significant popularity even among the most popular sites on the Internet according to Alexa.com. The advent of online social networks not only provides more chances for people to enjoy entertainment and conduct business but also drives a novel way for researchers to study social interactions. For example, group interactions and temporal dynamics of human communications through online social networks. Therefore, Facebook, YouTube, Twitter and other social networking tools are increasingly the object of scholarly research. Papers [1-4] have focused on characterizing various structural properties of the user friendship inferred from the snapshots data collected from OSNs. Cha et al. give an extensive analysis on the popularity distribution and popularity evolution of videos on YouTube in [5]. Models for predicting popularity of online content including YouTube videos and Digg stories are proposed in [6] and [7]. In [8], Crane et al. studied the responses of video popularity to exogenous events and endogenous events. Several recent studies also analyzed the user interaction in OSNs [9 - 12]. Authors of paper [13] analyzed the anomaly and attack patterns of social networks with data mining tools. In this paper, we choose a completely new OSN, Google Buzz, as our study object. To the best of our knowledge, there are no published studies for it yet. Launched on February 9, 2010, Buzz is still in its infancy. However, it has millions of potential users, since each of the 146 million active Gmail users tends to become a Buzz user. In addition, Buzz, as we will introduce in next section, is quite different from other online social networking services. So, it is of high interest to take a closely look at the Google Buzz, and through the study we want to answer the questions like: (1) what fraction of users actively interacts with other users in Buzz? (2) what are the properties of the interaction graph in Buzz? (3) what are the temporal properties of interactions among users?
Journal of Convergence Information Technology(JCIT) Volume7, Number2, February 2012 doi:10.4156/jcit.vol7.issue2.32
269
Research on Patterns of User Interactions and Media Popularity on Online Social Networks Renjie Zhou, Huiqiang Wang, Guangsheng Feng, Bingyang Li, Wenjin Jin, Xu Lu
2. How Google Buzz works? Google Buzz is a social integration and messaging tool that automatically brings social networking into Gmail and the rest of the Google-sphere. Buzz has several key features like: automatic friends lists, which users automatically follow the people who we email frequently in Gmail; rich fast sharing, which combines other online social networking sources like Picasa, Flickr, Google Reader, YouTube, Blogger, and Twitter into a single feed, and it includes full-sized photo browsing; inbox integration, instead of emailing you with updates, like Facebook might, Buzz features emails that update dynamically with all Buzz post content; public and private sharing, which means that Buzz allows users to share publicly with the world or privately to a group of friends each time they post on Buzz or other sites . Thus, users can share links, photos, videos, status messages and comments organized in "conversations" and visible in the user's inbox. Also, a user can write comments for any content imported from other sites or his/her friend directly posted in Buzz. All these features make Buzz different from other OSNs. In essence, Buzz users interact with one another through the posted posts. An individual user posts a post on Buzz, or some other sites that can be imported to Buzz. Some of his or her friends may view and comment on the posted post content. After receiving comments from his or her friends, the author may also post comments to the post to response friends’ comments. User-user interactions in Buzz are as shown in Figure 1. Users grouped on the left (A, B and C) share posts (grouped in the middle), and users grouped on the right (D, A and E) put comments on his/her friends’ posts.
Figure 1. User-user interaction graph
3. Data set collection Buzz provides every registered user with a profile page. Everything a user posted and comments from other users for that post can be seen from the user’s profile. The user’s profile has a fixed format of URL, like http://www.google.com/profiles/USERID#buzz, where USERID is a 21-digits string. We are able to retrieve a user’s profile page by USERID and then parse the page to obtain the posts and comments. Thereafter, USERIDs of other users who had commented on this page can be extracted and we thus have more USEIDs for crawling. We started the data set collection by selecting ten USERIDs as the seeds, and then followed the procedure described above. Our crawling lasted for one month, from April 1, 2010 to April 30, 2010. As a result, we totally collected approximately 128 thousand users, more than 1 million posts, and more than 3 millions comments for these posts. The basic statistics of the data set is given in Table 1.
Element Number
Table 1. Data set collection user post 128978 1195972
comment 3363867
270
Research on Patterns of User Interactions and Media Popularity on Online Social Networks Renjie Zhou, Huiqiang Wang, Guangsheng Feng, Bingyang Li, Wenjin Jin, Xu Lu
4. The sources of Buzz posts As introduced in section 2, Buzz can import posts from other sites. In this section, we try to figure out the major sources of Buzz posts and their respective contributions.
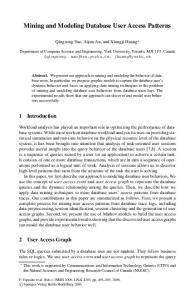
0.00% 0.37% 1.55%
21.53%
0.00% 46.11% 7.65%
1.58% 21.16%
Buzz Twitter Google Reader Flickr Picasa FriendFeed Blogger Youtube Unknown
Figure 2. Different sources statistics As can be seen in Figure 2, about 46% of posts were initialized on Buzz itself, which was the largest source. 21% of posts came from Twitter, and 7% came from Google Reader. Each of the rest well known sites contributes a small percentage of posts. Note that the sites except those we have indicated in the figure contributed approximately 21% of posts. This figure shows that Buzz users are likely to use Buzz in a direct manner. Besides Buzz, Twitter is also popular in Buzz users.
5. Social structure of Buzz users Social structure of users plays an important role in the patterns of user interactions. We suppose the friendship between any two Buzz users is a bilateral relationship, which means if user A is a friend of user B, then user B is also a friend of user A. We first investigate the distribution of degree of social graph, which indicates the number of friends a user has. As shown in Figure 3, the number of friends varies from user to user in a wide range. Some users have several hundred even tens of hundreds of friends, while the majority has only a few friends, which also shows a strong characteristic of powerlaw distribution.
Figure 3. Distribution of node degree
271
Research on Patterns of User Interactions and Media Popularity on Online Social Networks Renjie Zhou, Huiqiang Wang, Guangsheng Feng, Bingyang Li, Wenjin Jin, Xu Lu
We then examine the clustering coefficient of the social structure of Buzz users. We define the friendships between Buzz users as a graph G = (V, E), where the set of vertices V represents users, and the set of edges E represents friendships between them. An edge means user i and user j are friends. The local clustering coefficient for a user is given by the proportion of friendships between user ′ friends divided by the number of friendships that could possibly exist between them. For an undirected friendship graph, that and are considered identical. Therefore, if a user has ( )
friendships could exist among his friends. Thus, the local clustering coefficient for friends, undirected friendship graphs is given as =
2{ } : , ∈ , ∈ ( − 1)
The clustering coefficient for a whole graph is given by Watts and Strogatz in paper [13] as the average of the local clustering coefficients of all the vertices in a graph :
̅ =
1
After investigation, we obtain the average clustering coefficient of the user graph in Buzz is approximately 0.25, which is much larger than a random network. We then investigate the shortest path length between Buzz users, which is another important attribute need to measure for judging whether a network is small-world network. As shown in Figure 4, the majority of the shortest paths have a length of three to five. The average of shortest path length is 4.4, which is quite small in comparison with the network scale.
Figure 4. Distribution of shortest path length A graph is considered small-world, if its average clustering coefficient is significantly higher than a random graph constructed on the same vertex set, and if the graph has approximately the same meanshortest path length as its corresponding random graph [12]. Thus, the Google Buzz user friendship graph shows a weak small-world characteristic.
6. Patterns of user interactions on Buzz In this section, we will investigate the patterns of user interactions on Buzz, including the distribution of posts and comments, the importance of self-comment, as well as characteristics of the social structure of active users on Buzz.
272
Research on Patterns of User Interactions and Media Popularity on Online Social Networks Renjie Zhou, Huiqiang Wang, Guangsheng Feng, Bingyang Li, Wenjin Jin, Xu Lu
6.1. Distribution of user activities In this section, we first investigate the distribution of user activities on Buzz. Figure 5 shows the cumulative distribution of the number of posts per user. As shown in Figure 5, approximately 20% of users do not post anything; nearly 80% of users have less than 20 posts; and less than 20% of users have more than 25 posts. The statistics of number of posts per user tells that only a small portion of users are active. We should note that because of Buzz’s limitation, we collected at most 25 posts for a user.
Figure 5. The cumulative distribution of posts per user As the distribution of the number of posts is highly skewed, we wonder whether the distribution matches with a power law distribution. Figure 6 is the empirical plot of ranks against posts per user. As can be seen from the figure, the line can be divided into two parts. The first part is a horizontal line which is caused by the fact that we can collect at most 25 posts for a user. The second part could be approximately fit by a straight downside line, which means the distribution of the number of posts for these users approximately follow the power law.
Figure 6. Empirical plot of ranks against posts In order to understand how different posts on Buzz are in popularity. We investigate the distribution of the number of comments per post. As shown in Figure 7, the number of comments varies a lot from post to post. The minimum number of comments of a post is 0 and the maximum number of comments for a post is 500. Because of Buzz’s limitation, we at most collected 500 comments for a post. Most of posts have a few comments, 90% of posts have less than 7 comments, and only 0.3% of posts have more than 100 comments. Average number of comments per post is 2.79. We next investigate the
273
Research on Patterns of User Interactions and Media Popularity on Online Social Networks Renjie Zhou, Huiqiang Wang, Guangsheng Feng, Bingyang Li, Wenjin Jin, Xu Lu
importance of self-participation on post commenting. For the posts on which the creator never put any comments, we called them non-self-commented posts, otherwise, self-commented posts. As shown in the figure, the number of comments for non-self-commented posts is much smaller than that for selfcommented posts. The average number of comments for non-self-commented posts is 0.4, while average number of comments for self-commented posts is 11.5. Even if we ignore the comments from the creators themselves, the average number of comments for self-commented posts is 8.4, which is still much larger than that of non-self-commented posts. The big difference between the average number of comments for non-self-commented posts and that for self-commented posts demonstrates the importance of self-participation on post commenting.
Figure 7. The cumulative distribution of comments From Figure 8, we can see the distribution of the number of comments per post can also be divided into two parts. The first part is a horizontal line which is caused by the fact that we can collect at most 500 comments for a post. The second part could be approximately fit by a straight downside line with a cut off, which means the distribution of the number of comments per post can be approximately fitted by tail cutting-off power law. The distribution of the number of comments for the non-self-commented posts especially shows a strong match with power law.
Figure 8. Empirical plot of ranks against comments Figure 9 depicts the number of user interactions that are associated with the top active users. Figure 9 shows most of comments are commented for a small fraction of users. More than 80% of comments
274
Research on Patterns of User Interactions and Media Popularity on Online Social Networks Renjie Zhou, Huiqiang Wang, Guangsheng Feng, Bingyang Li, Wenjin Jin, Xu Lu
are for top 20% of users. 16% of users have posts but do not receive any comments, but the top 1 user receives 11977 comments.
(a). Comment for users
(b). Ranks against contributed comments
Figure 9. Comment for users and comment contribution of users on their rank Figure 9(b) tells us most of comments are addressed to a small fraction of users. Top 20% of users are responsible for more than 80% of comments. Top 1 user put 4109 comments, but 40% of users put no more than 2 comments.
6.2 Temporal properties of user interactions In this section, we want to figure out how the number of comments for a post changes over time. In other words, when will the comment show up after the time the post was shared? We use the time the post was shared as the starting time and gather the comment arriving time in Figure 10. 50% 45% 40% 35% 30% 25% 20% 15% 10% 5% 0%
Time (hours)
Figure 10: Comments arriving time As can be seen from the figure, more than 80% of comments arrived in 3 hours after the post is shared and only 7% of comments taken more than 24 hours to show up. This means the comments in Buzz are timely.
7. Conclusions
275
Research on Patterns of User Interactions and Media Popularity on Online Social Networks Renjie Zhou, Huiqiang Wang, Guangsheng Feng, Bingyang Li, Wenjin Jin, Xu Lu
In this paper, we studied the user interactions in Google Buzz. We found Buzz users more likely use Buzz in a direct way. And only a small fraction of Buzz users are active, for example, most of comments are commenting for a small fraction of users and a small fraction of users are responsible for most of comments. Also, we noted that comments for a post show up timely after the post was shared.
8. Acknowledgements The authors are grateful to the anonymous reviewers for their helpful comments and advice. This work was supported by the National Natural Science Foundation of China (60973027), the Fundamental Research Fund for the Central Universities (HEUCF100601), the Research Fund for the Doctoral Program of Higher Education of China (20102304120012), the Natural Science Foundation of Heilongjiang Province (F201037), the Research Fund for Scientific and Technological Innovation of Harbin (2011RFQXG007, 2011RFQXG035), and the Postdoctoral Science Foundation of Heilongjiang Province (LBH-210204).
9. References [1] A. Mislove, M. Marcon, K. P. Gummadi, P. Druschel, and B. Bhattacharjee, “Measurement and analysis of online social networks”, In Proceedings the 7th ACM SIGCOMM conference on Internet measurement, pp.29-42, 2007. [2] Y. Ahn, S. Han, H. Kwak, S. Moon, and H. Jeong, “Analysis of topological characteristics of huge online social networking services”, In Proceedings of the 16th international conference on World Wide Web, pp.835-844 2007. [3] Akshay Java, Xiaodan Song, Tim Finin, and Belle Tseng, “Why we Twitter: Understanding microblogging usage and communities”, In Proceedings of WebKDD/SNA-KDD, pp.56-65, 2007. [4] Bo Zhou, Chao Wu, "Modeling Social Ties with an Object Oriented Approach", IJACT: International Journal of Advancements in Computing Technology, Vol. 3, No. 11, pp. 259-268, 2011. [5] Meeyoung Cha, Haewoon Kwak, Pablo Rodriguez, Yong-Yeol Ahn, and Sue Moon, “Analyzing the video popularity characteristics of large-scale user generated content systems”, IEEE/ACM Transactions on Networking , Vol. 17 No. 5, pp.1357-1370, 2009 [6] K. Lerman and T. Hogg, “Using a model of social dynamics to predict popularity of news”, In Proceedings of the 19th international conference on World Wide Web, pp.621-630, 2010. [7] G. Szabo and B. Huberman, “Predicting the popularity of online content”, Communications of the ACM, Vol.53, No.8 pp.80-88, 2010. [8] Riley Crane and Didier Sornette, “Robust dynamic classes revealed by measuring the response function of a social system,” In Proceedings of the National Academy of Sciences of the United States of America, Vol.105, No.41, pp.15649–15653, 2008. [9] M. Valafar, R. Rejaie, and W. Willinger, “Beyond friendship graphs: A study of user interactions in flickr”, In Proceedings of the 2nd ACM workshop on Online Social Networks, pp.25-30, 2009. [10] H. Chun, H. Kwak, Y. H. Eom, Y. Y. Ahn, S. Moon, and H. Jeong, “Comparison of online social relations in volume vs interaction: a case study of cyworld”, In Proceedings the 8th ACM SIGCOMM conference on Internet measurement, pp.57-69, 2008. [11] B. Viswanath, A. Mislove, M. Cha, and K. P. Gummadi, “On the evolution of user interaction in Facebook”, In Proceedings of the 2nd ACM workshop on Online Social Networks, pp.37-42, 2009. [12] C. Wilson, B. Boe, A. Sala, K. P. Puttaswamy, and B. Y. Zhao, “User interactions in social networks and their implications”, In Proceedings of the 4th ACM European conference on Computer systems, pp.205-218, 2009. [13] Prajit Limsaiprom, Panjai Tantatsanawong, "Social Networks Anomaly and Attack Patterns Analysis", AISS: Advances in Information Sciences and Service Sciences, Vol. 3, No. 9, pp. 199206, 2011 [14] D. J. Watts and Steven Strogatz. “Collective dynamics of 'small-world' networks”, Nature, Vol.393 No.6684, pp.440–442, 1998.
276