Jan 14, 1980 - 'Tanomalie" bien connue (augmentation, maximum et d6croissance). .... titan]. Fig. 4. ~P/Po versus time at different T. after a DQ quench in AZ ...
Acta Metallur.qica, Vol. 28, pp. 1115 to 1122
0001 6160/80/0801-I 115502.00/0
© Pergamon Press Ltd. 1980. Printed in Great Britain
RESIDUAL RESISTIVITY D U R I N G CLUSTERING IN AI-Zn SOLID SOLUTIONS N. LUIGGIt, J, P. SIMON:~ and P. GUYOT:~ L.T.P.C.M. (L.A. 29)-Institut National Polytechnique de Grenoble, France
(Received 14 January 1980) Abstract -In the alloys A1 8 to 25 wt,~o Zn, the isothermal kinetics of clustering has been followed at different ageing temperatures by resistivity measurements. At low temperatures, the classical "anomaly" (increase, maximum and decrease) is observed. It is associated with a large density (~ 1019 cm -3) of Zn clusters of 1-2 nm of diameter. The resistivity kinetics have been calculated with the help of Hillel's diffraction model and of transmission electron microscopy and neutron small-angle-scattering structural results: the experimental behaviour is fairly well reproduced. At high ageing temperatures, a metastable state sets during an incubation period of clustering and the corresponding resistivity plateau is higher for lower temperature. A binding energy between zinc atoms of 0.04 eV has been deduced from a simulation of the equilibrium between clusters containing less than 5 atoms. At intermediate temperatures, the behaviour is composite and is not fully understood. R6sum6- Des cin6tiques isothermes de d6mixtion d'alliages A1-8 fi 15°J; poids Zn ont 6t6 suivies pour diff6rentes temperatures de vieillissement par r6sistivit6 61ectrique. A basse temp6rature on observe 'Tanomalie" bien connue (augmentation, maximum et d6croissance). Une grande densit6 (~ 1019 cm -3) d'amas de Zn de diam+tre 1-2 nm lui est associ6e. Les cin6tiques de r6sistivit6 ont 6t6 simul6es grfice au module de diffraction d'Hillel et aux donn6es structurales obtenues par microscopic 61ectronique en transmission et diffusion centrale des neutrons: on rend ainsi assez bien compte du comportement exp6rimental. A haute temp6rature il s'instaure un 6tat m6tastable correspondant fi l'incubation de la d6mixtion et le plateau de r6sistivit6 correspondant est d'autant plus 61ev6 que la temperature est plus basse. D'une simulation de l'6quilibre entre amas de moins de 5 atomes, on d6duit une 6nergie de liaison entre atomes de zinc de 0,04 eV. Enfin, fi temp6rature interm6diaire, le comportement est complexe et imparfaitement compris.
Zusammenfassung--Die isotherme Kinetik des Zusammenlagerungsprozesses wurde in den AILegierungen mit 8 bis 25 Gew.-% Zn bei verschiedenen Auslagerungstemperaturen mit Widerstandsmessungen verfolgt. Bei niedrigen Temperaturen wird die klassische 'Anomalie' (Anstieg, Maximum und Abfall des Widerstandes) beobachtet. Dieses Verhalten wird der groBen Dichte (~ 1019 cm -3) von Zn-Anh~iufungen mit einem Durchmesser yon 1-2 nm zugeschrieben. Mit dem Streuungsmodell von Hillel und den Ergebnissen yon Elektronenmikroskopie und Neutronenkleinwinkelstreuung wurde die Widerstandskinetik berechnet; das beobachtete Verhalten wird gut wiedergegeben. Bei hoben Auslagerungstemperaturen tritt nach einer Inkubationszeit beim Zusammenlagern ein metastabiler Zustand ein. Das zugehSrige Plateau des Widerstandes liegt hSher bei niedrigerer Temperatur. Von einer Simulation des Gleichgewichtes zwischen Anh~iufungen mit weniger als 5 Atomen wird eine Bindungsenergie yon 0,04 eV zwischen den Zn-Atomen abgeleitet. Bei mittleren Temperaturen ist das Verhalten der Legierungen noch nicht vollstgndig verstanden.
1. INTRODUCTION The electrical resistivity measurement is a tool commonly used by metallurgists to follow precipitation processes in supersaturated solid solutions, the decrease of the resistivity being connected with the appearance of the precipitates. Nevertheless a more basic interest was devoted to the problem once some experiments demonstrated that small scale clustering, as appears for instance in aluminium alloys in the early stages of the GuinierPreston zone formation, was able to rise and then t Permanent address: Escuela de Ciencias, Departemento de Fisica, Cumana, Venezuela. S E.N.S.E.E.G.--B.P. 44 38401 Saint Martin d'H6res, France.
decrease the resistivity level with respect to the quenched state [1~4]. This phenomenon is sometimes called resistivity "anomaly". This anomaly is explained in terms of the scattering power of a soluteatoms cluster which can be reinforced by a diffraction effect (Hillel, Edwards and Wilkes [5,6], hereafter noted HEW) i-7-9]. In order to use resistivity measurements as a characterization method of the decomposition states of a supersaturated solid solution, it is necessary to quantify the anomaly. For this, the structural states must be determined by usual experimental techniques like small angle scattering (SAS) and transmission electron microscopy (TEM). Such data can then be used to calculate the resulting residual resistivity [6]. Nevertheless SAS and standard T E M resolve clusters
1115
LUIGGI et al.: CLUSTERING IN A~Zn SOLID SOLUTIONS
1116 rC*c] 360''
A Z 15
~_.
"
SL
133 ~"
:
20 - 20
~m
structural parameters[10,11] the resistivity "anomaly" can be theoretically reproduced and a comparison with the experimental data is made and discussed. Finally, the early stages of the decomposition are analysed in terms of a cluster quasi-equilibrium state as given by a chemical reaction system.
-
2. EXPERIMENTAL RESULTS
= -196
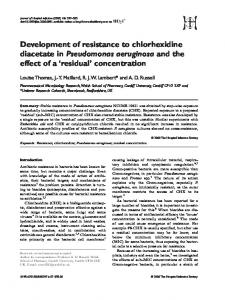
Fig. 1. Schematic representation of a TSQ quench and isothermal ageing: Tq, T, T, and T,, are respectively the quench temperature, the intermediate one, the ageing one and the temperature of resistivity measurements (drawn for AZ 15). In the direct quenches (DQ), the step at Ti is skipped over. SL, MG and RC respectively indicate the temperature levels of the solubility limit, the coherent miscibility gap and the start of a rapid clustering.
larger than about 70 atoms and consequently the very first stages of the decomposition can not be fully described. Furthermore, the experimental conditions for resistivity measurements and structural determinations are scarcely identical. As the sensitivity of the kinetics to the quench conditions is well known, it appears essential to use both techniques abreast. It is the aim of this paper which deals with the classical A1-Zn alloy. In this system, the precipitation is often considered as occurring through spherical disordered Zn clusters called Guinier-Preston zones, which transform lately into a coherent rhomboedric ~t'R phase. It has been shown that such a distinction is rather ambiguous and that G.P. zones and ct'R precipitates are probably different morphologies for different sizes of the same coherent phase [10]. SAS and TEM data are those previously obtained for AI-15 wt% Zn in the laboratory by Laslaz [10, 11] after identical quenches and thermal treatments. Experimental results on the residual resistivity of alloys during ageing at various temperatures are first presented. A special interest is devoted to the metastable states of the nucleation stage. With the use of
#~/,~
2.1. Experimental procedure The studied compositions of the A1-Zn alloy are 3.4at.%, 6.8 at.% and 12.1 at.% Zn (respectively referred as AZ 8, AZ 15 and AZ 25 weight compositions). The samples are 0.14).2 mm thick strips; their d.c. resistance is measured at the liquid-nitrogen temperature Tm by the four-points method 1"12]. For the classical isothermal ageings, the quench conditions have been chosen identical to those of the TEM work [10]: direct quench (DQ) from 260°C to brine (-20°C), two step quench (TSQ) from 260°C with an intermediate stay of ti = 30 s at Ti = 133°C (TSQ 1) or ti = 10min at Ti = 141°C (TSQ 2) (Fig. 1). These temperatures are chosen with reference to the solubility limit (SL), the Ct'Rmiscibility gap (MG) and Junqua's [13] limit of the nucleation and growth regime of clustering (R.C.). These temperatures are indicated in (°C) in the following table for the three alloys.
AZ 8 AZ 15 AZ 25
SL
MG
RC
160 220 260
116 175 235
66 128 175
Before quenching, the samples are homogenized 3.5 h at 360°C and slowly cooled to 260°C in a sliced oven. The quench device is based on the same principle as this of Kiritani [14]. The ageings are made in alcool and oil stirred baths. During the thermal cycling between ageing temperature and 77 K, a spurious effect, due to crossing the temperature range of
AZ8
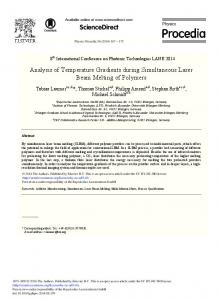
Fig. 2. Isothermal Ap/po variation of an AZ 8 alloy at different T. alter a DQ quench: • T. = 0°C, • T. = 20°C, © T. = 40°C, [] T. = 60°C, • T. = 80°C a n d . T. = 133°C.
LUIGGI et al.: CLUSTERING IN AI-Zn SOLID SOLUTIONS
1117
+
N
AZ15
10,
-5.
-10 "
!,, 1
. 1'0
~ 100
t[mn~
1000
Fig. 3. Ap/po versus time at different Ta after a DQ quench in AZ 15: • 7~ T, = ll0C'C, • Ta = 133C a n d , T, = 160"C.
rapid decomposition ( - 4 0 °, +40°C), alters very slightly the resistivity as long as enough quench-invacancies subsist, The discussion of this effect has been given by Luiggi [12]. 2.2. Resuh~ The alloys have been isothermally aged after DQ quench at various temperatures To between 20 and 180°C, Figs 2, 3, and 4. Three temperature ranges corresponding to three characteristic resistivity behaviours may be distinguished: (i) At low Ta, i.e. around 20°C for all the alloys, the resistivity anomaly appears. The amplitude of its maximum A,, and the time t,, to reach it, decrease as T, increases. At a given T., A,. is higher and t,. shorter for AZ 15 than for AZ 8. This behaviour has already been observed by Panseri and Federighi [1] for AZ 12 (AI-5.3 at.~'/o Zn) and by Smugeresky et al. [2] for AZ 8 and AZ 12. X Rays-SAS indicate also that the clustering kinetics increases rapidly with the alloy concentration. This is presumably the reason why in AZ 25, the early maximum (after 2 min ageing at 20°C)
= 20~C, O T. = 8 0 ( 7 , [ ]
has an A,, value smaller than in AZ 8 and AZ 15: clustering partially occurs during the quench itself. At low T,, after TSQ in AZ 15, the anomaly is slowered by more than an order of magnitude when, for T~ = 133°C, t i is increased from 0,5 to 5rain (Fig. 5). For an intermediate stay longer than 5 min, the kinetics differs only slightly, which means that vacancies have probably reached their equilibrium concentration at Ti. The amplitude of the maximum seems to increase with t~, but the curves are drawn relatively to the first measurement and the TSQ quench modifies the initial value. When corrected, the resistivity maxima have nearly the same height independently on t~ and T~, as already shown by Merlin et al. [4]. For long ageing times, the "reaction" stops and the resistivity reaches a plateau. This probably means that the quench-in vacancies have been eliminated, (ii) At high Ta (T, > 60°C for AZ 78; Ta > 133°C for AZ 15) but below the miscibility gap of the coherent transition phase 7'R, the resistivity curves show a plateau followed by a decrease which gradually slows down (Figs 2 and 3). The length of the plateau is
10-
AZ 25
-10 -
-20-
0
!,;
,
,
10
100
titan]
1000
Fig. 4. ~P/Po versus time at different T. after a DQ quench in AZ 25: @ To = 20~C, • T, = t33'C, • Ta = 180°C and . 7", = 260°C.
1118
LUIGGI et al.: CLUSTERING IN AI-Zn SOLID SOLUTIONS 20. ,,~
[%]
A Z 15 Ta = 20°C
Fig. 5. Isothermal Ap/po variation of AZ 15 at T, = 20°C after different TSQ quenches with an intermediate stay at 133°C of tl = • 0 min, O 0.5 min, & 1 min, • 5 min, [] 10 rain a n d . 20 rain.
shorter and its level higher as Ta is lowered, as previously observed by Junqua et al. 1-14]. In this temperature range, a cycling between two different Ta changes reversibly, during a certain time, the plateau level (Fig. 6). Thus there seems to be a metastable equilibrium for each temperature. This behaviour has already been pointed out in AZ 12 by Herman et al. [3]. (iii) In the intermediate temperature range (as for instance Ta = 110°C in AZ 15)(Fig. 3), it appears that there has been a maximum occurring in the very first stage of ageing, presently lower than a minute; the slow decrease of resistivity is afterwards followed by a plateau and a new fall: this behaviour looks like the high-temperature one. To precise the phenomena, TSQ quenches were also performed on AZ 15, in this intermediate temperature range (Fig. 7). At T, = 80°C, the alloy has a typical low-temperature behaviour. On the contrary, at l l0°C after a TSQ quench, a maximum no longer appears, but a plateau extending for more than one hour is observed. Before the final fall, it superimposes to the plateau after the DQ quench.
an increase of resistivity Apt/p~ per solute atom in a cluster of l Zn atoms can be defined [-81 and used for the resistivity calculation in the Matthiessen's approximation. For larger zones the scattering is then essentially anisotropic and the Matthiessen's rule is no longer valid. For given structural parameters, the resistivity can be ab-initio calculated l-5-8]. Edwards and Hillel I-6] gave in particular a semi phenomenological formulae fitting their full calculation: 1 -F + p = [p~--y
F pm+J+B
1-1
(t)
Where J is the isotropic contribution of the clusters, function of their size and density, B is related to the cluster scattering of electronic states lying near the Brillouin zone, and F is the associated fraction of the
~ ] 5
A Z 15 tl0
,
~
120
3. D I S C U S S I O N AND C O M P A R I S O N W I T H S T R U C T U R A L OBSERVATIONS A comparison with structural data obtained by T E M and SAS after identical thermal treatments can give some insight into the understanding of the resistivity behaviour. By introducing the structural parameters in a resistivity model a theoretical resistivity is elaborated and compared with the experimental kinetics. The resistivity models used in this work will first be briefly recalled. 3.1. Theoretical approach of the resistivity When the clustering occurs at a fine scale, the scattering power of a cluster can be reinforced by a diffraction effect. For the smallest clusters (less than 32 atoms, ~b < 0.8 nm), the resistivity stays isotropic and
150 Bo -5
AZ8
41 2' 0
80
IOO
6O ....
/-'-X-
F'--'--I t
hal
Fig. 6. Influence of a thermal cycling between the indicated temperatures (°C) upon the resistivity level in AZ 8 and AZ 15: -full lines: experiments - - dotted lines: calculations (section 3.3) . . . . with EB = 0.04eV; . . . . with E~ = 0.05 eV.
LUIGGI et al.: Ap p---~- [%]
CLUSTERING IN A1-Zn SOLID SOLUTIONS
¢
1119
AZ15
5-
O-
-5-
rt
ll
,
lb
160
' ~n~
1000
Fig. 7. Ap/po versus ageing time at intermediate temperatures (80 and I I0°C) in AZ 15:
T,, = 80°C
• after DQ O after TSQ 1 , after TSQ (t i = 0.5 mn, Ti = 141°C)
To = II0°C
Fermi surface. The details of the parameters for AI-Zn can be found elsewhere [6, 12]. The Born approximation used in Hillel's approach is valid only when the size of the inclusions and their spacing is much smaller than the electronic mean-free-path. When precipitation attains a coarse size, the average resistivity t5 of the two phase system must be evaluated. For a volume f r a c t i o n f o f macroscopic spherical inclusions of specific resistivity pp in a matrix of resistivity Pro,/3 can be written (Fricke [15]):
• after DQ US after TSQ l • after TSQ (t i = 0.5 m n ,
Ti
=
141°C)
200
f /I
too
/s 1/ •5
5o
2O I j illtll]
i
iiiiiii1
i
illllll[
i
i iiiiiii
20C
I00
5O
If the matrix solid solutions P,, and pp are thiessen's rule,
and the inclusions are both random of respective Zn composition cs and cp, then given, with the help of the Matby: P m = PT
+
PlCs(1
"1
i I
2O
I0
......
,
A__e~/.] po
- - Cs)
Pp = PT + PiCp(1 -- Cp)
i
20
(3)
where Pr is the phonon contribution and Pi is the specific impurity resistivity per unit composition. The discussion will mainly concern the AZ 15 alloy for which structural data are available. The same classification as in section 2-2 is chosen for the ageing-temperature range. 3.2. Ageing at low temperatures Laslaz's T E M results stand for the AZ 15 alloy aged after TSQ 1 and TSQ 2 at 20°C. There is a similarity in both cases but the kinetics is about one order of magnitude slower after TSQ 2 (Fig. 8). The first stage of these curves corresponds to the nucleation of G.P, zones, the diameter of which is about
-I(
-20 iO
I00
1000
I0000 tfmn]
Fig. 8. Comparison between resistivity and TEM during isothermal anneals at 20°C in AZ 15: A is the mean distance between cluster images in TEM, 05 their mean diameter and Ap/po the resistivity variation relatively to the first measure: - - and ©: following TSQ 1 (t~ = 0.5 min at Te = 133°C); - - - and D: following TSQ 2 (t~ = 10rain at T~ = 141°C).
1120
LUIGGI et aL: CLUSTERING IN AI-Zn SOLID SOLUTIONS 20
"1,
Ap o
a Ta = 2 0 ° C
10,
o
o
o
1
-10.
! vl
I
I'O
100
t Cmn3
Fig. 9. Evaluation of the isothermal resistivity variation at 20°C in AZ 15: - - full and dotted lines are the experimental curves respectively after TSQ 1 and TSQ 2: - - calculated values with HEW formulae and TEM structural data taking the two limits of the density d= of clusters: dz = 6 10~8cm-3 dz = 3 I019cm-3
• after TSQ 1 O after TSQ 2 • after TSQ 1 [] after TSQ 2 • ab initio calculated values with d= = 6.10~8 cm -3 after TSQ 1
1.5nm and their density, dz, is between 6.1018 and 3.1019 cm -3. The next step is attributed to the growth and coarsening of the zones. The decomposition finally stops after about 1000 min. There is no apparent connection between such evolutions and the resistivity kinetics shown on Fig. 8: for TSQ 1, the resistivity maximum occurs for clusters of 1.5 nm of diameter spaced of 3 nm while, for TSQ 2, it occurs for clusters of 2.5 nm spaced of 7 nm. This point introduces some doubt in the too simple interpretation of Panseri and Federighi [1] who claimed a unique correspondence at a given Ta between resistivity levels and decomposition states of the alloy. As it will be shown now from numerical calculations, different zones distributions can indeed lead to the same resistivity level: the zone distributions determined by TEM have been used to calculate the resistivity from either the HEW formulae [3] or our ab initio calculations [7] (Fig. 9). The resistivity anomalies are well reproduced. After TSQ 1, the predicted maximum appears rather lately. The amplitude of the increase is one order too low if we take a density of zones d, of 6.1018cm -a. With the upper limit of the density (d z = 3.1019 c m - 3 ) , resistivity values look compatible with experiments. On the other hand, it has been shown [8], that the anomaly can be well reproduced with the help of the Binder's theoretical clusters dynamics. Small clusters (less than 60 solute atoms) were shown to afford the main contribution to the resistivity increase. On the contrary, at the beginning of ageing, TEM faint contrasts are rather ambiguous, explaining why, before 10rain, points have not been plotted on Fig. 9. The two approaches of the "anomaly" appear quite complementary: a maximum can be reproduced either by only considering submicroscopic clusters, or by only taking into account G.P. zones observed by TEM.
The maximum is certainly the sum of those two contributions. 3.3. Ageing at high temperatures Comparison of TEM with resistivity (Fig. 10) indicates that the resistivity plateau corresponds to an incubation period of clustering, the fall to nucleation, growth and coarsening. The resistivity behaviour has been again calculated from TEM [10] and neutron SAS Ell] data with HEW and Fricke's relationships. The obtained values are gathered on the same curve (Fig, 1I): the approximation of a "macroscopic" precipitation seems to be valid for these zone sizes, namely larger than 3 nm. They lie slightly above the contribution of the solid solution alone. Nevertheless, the experimental resistivity decrease is slower: this could possibly be due to the neglect of the positive contribution of the strain field of the coherent G.P. zones and As. According to the nucleation theory, the resistivity plateau is related to an "incubation" period during which a quasi-equilibrium between isolated solute atoms and small polymers of solute atoms is set up. Lebowitz et al. 1-16] recently described the shift of the subcritical-cluster distribution towards higher size when the ageing temperature is lowered. An interpretation of the cycling experiments can then be given: at low temperature, the proportion of large size polymers is higher, giving an extra positive contribution to the resistivity. The smooth part of the curve, during rising or lowering the temperature, is due to the setting-up of the quasi equilibrium through thermal vacancies. A quantitative evaluation has been made assuming a quasi equilibrium state between mono-, di-, tri- and quadri-mers of solute atoms. This quasi-equilibrium is analyzed in terms of chemical reactions, as largely
LUIGGI et al.: CLUSTERING IN A1-Zn SOLID SOLUTIONS
1121
-io
o5
5 o
Imll
\
-5
i
I0
,,-
.......
i
. . . . . .
I00
t
I
k
....
I000
i
. . . . .
I0000
L
t[mn]
Fig. 10. Comparison between resistivity and TEM in AZ 15 during an isothermal anneal at 133°C: Cp (atomic ~o) is the depletion of the solid solution during clustering and Ap/p 133°C is the relative resistivity-variation.
used for polymers of vacancies [-16]. The equilibrium concentrations of the various clusters schematized on Fig. 12 are related by the following expressions:
tC,
(Ap)I~ = y~ t(ACl)~; P0
(5)
1=2
Po being the solid solution resistivity. When the temperature is changed, ACI is estimated from (4) for different values of EB and (5) is calculated with Apl/pi given by the Fig. 1 of reference [8]. Ap/po measured and calculated is shown for AZ 8 and AZ 15 on Fig. 6. A good fit is obtained for En = 0.04 eV, except at To = 110 or 120°C in AZ 15 (for such T~, the solid
Cz = 6 C 2 exp (En/kT) C60 = 8C 3 exp (3 EB/kT) C9o = 12 C~ exp (2En/kT) C120 = 24 C~ exp (2 En/kT ) Clao = 36 C 3 exp (2 EB/kT) C4T = 2 C~ exp (6 En/kT) C4p = 24 C 4 exp (5 En/kT)
(4)
4,
0~
with the conservation condition
' ~
Ta=133°C
%'o,=,= ,~
4
Cl = Co ; /=1
l is the number of solute atoms in a cluster and Co the total solute concentration. En is the binding energy of a pair of first neighbours of zinc and n EB is assumed to be the binding energy in a cluster containing n pairs of first neighbours. The pre-exponential term is simply the number of equivalent configurations for a given cluster. The variation of resistivity between two temperatures T~ and T2, (Ap)~-~ is directly related to the variation of the cluster concentrations (ACI)~
-10
~x°\ \ \
-20'
1," , 0
110
t ~h]
100
Fig. 11. Comparison of experimental and theoretical kinetics in AZ 15 at 133°C: Experimental curve - and calculated points: O HEW formulae and TEM structural data [10]. • Fricke's formulae and TEM data; • Fricke's formulae and neutron SAS data [11]; - - s o l i d solution term alone.
1122
LUIGGI et al.: CLUSTERING IN AI-Zn SOLID SOLUTIONS tivity decrease to the decrease of strength of the strain field of the G.P. zones. Nevertheless structural results are necessary to support this statement. C2 4. C O N C L U S I O N
C60
C90
C120
C4T
C4p
C180
Fig. 12. Various configurations of di-, tri- and quadri-mers of solute atoms used in the calculations. solution stays probably no longer in a metastable state, see section 3.4). Perry [18] deduced a En value of 0.10-0.15 eV from his analysis of the apparent formation energy of vacancies after quenching dilute AI-Zn alloys, but the procedure generally gives overestimated values [-19] which probably correspond to the binding energies of a solute atom with a cluster. Zahra [20], by calorimetric measurements, estimated to 0.08 eV the binding energy to a zinc cluster. Since this energy takes in account several (3-6) bonds and since each of them is presumably less strong in a cluster than in a dimer, our value seems in reasonable agreement with the previous ones. 3.4. Ageing at intermediate temperatures The typical case is the isothermal kinetics at 110°C in AZ 15: after TSQ 1, T E M observations and NSAS experiments reveal the growth of G.P. zones from a diameter of 2.5 n m with a density of 1.2 1018 cm -3 after 10 rain of ageing, to 5 n m with 5.1017 cm -a after 220 rain. In the latter case, the zone contribution to the resistivity is almost negligible, and a decrease of resistivity of about 20% of the initial value, corresponding to the depletion of the solid solution, should be expected. On the contrary, the observed resistivity plateau is higher than the initial value. We can first think to the influence of subcritical clusters, formed at l l0°C like at 133°C: the decomposition of the solid solution being only partial (1.3% upon 6.8%), the agglomeration of zinc should be effective. Nevertheless their contribution would have to be huge to compensate the resistivity decrease associated with G.P. zone formation. This point has not been elucidated. After 200min at li0°C, the shape of the resistivity curve looks like a new nucleation and growth process. After 240 rain at 133°C, Laslaz observed a transformation of spherical to ellipsoidal zones (or ~'R precipitates). We may suppose that the same behaviour occurs at l l 0 ° C and attribute the associated resis-
The paper emphasizes the role played by submicroscopic clusters of several solute atoms on the resistivity of a solid solution. Their contribution to the rise of resistivity, generally not taken into account in the classical "resistivity anomaly" explanation can nevertheless be significant. On an other hand, different clusters distributions can give the same resistivity level, which makes the resistivity not so easy to handle as for instance simple diffraction techniques. In the case of A1-Zn the anomaly simply indicates a large density of clusters of less than 2 nm of diameter. On the contrary, if a limited cluster nucleation leads to a further coarse precipitation, the resistivity "sees" principally the residual disordered solid solution. Finally at ageing temperatures near the equilibrium temperature, a quasi-equilibrium between clusters much smaller than a critical cluster seems to establish, with as a result, a stationary resistivity or "incubation period". The variation of this resistivity level with a temperature change is conveniently explained on the basis of a displacement of the equilibrium between polymers (l ~< 4) of Zn solute atoms.
REFERENCES 1. C. Panseri and T. Federighi, Acta Metall. 8, 217 (1960). 2. J. E. Smugeresky, H. Herman and S. R. Pollack, Acta Metall. 17, 883 (1969). 3. H. Herman, J. B. Cohen and M. E. Fine, Acta Metall. 11, 43 (1963). 4. J. Merlin, V. M. Manzioni, F. Fouquet and G. Vigier, M6m. Sci. Rev. M~tall, 75, 327 (1978). 5. A. J. Hillel, J. T. Edwards and P. Wilkes, Phil. Mag. 32, 189 (1975). 6. J. T. Edwards and A. J. Hillel, Phil. Mag. 35, 1231 (1977). 7. P. Guyot and J. P. Simon; Scripta Metall. ll, 751 (1977). 8. N. Luiggi, J. P. Simon and P. Guyot, J. Phys. F 10, 865 (1980). 9. C. Radomsky and H. L6ffler, Phys. stat. sol. (a) 50, 123 (1978). 10. G. Laslaz and P. Guyot, Acta Metall. 25, 277 (1977). 11. G. Laslaz, G. Kostorz, M. Roth, P. Guyot and R. J. Stewart, Phys. stat. sol. (a) 41, 577 (1977). 12. N. Luiggi, Thesis, Grenoble (1979). 13. A. Junqua, J. Mimault, J. Delafond and J. Grilhe, Scripta Metall. 8, 317 (1974). 14. M. Kiritani, J. Phys. Soc. Jap. 19, 618 (1964). 15. H. Fricke, Phys. Rev. 24, 577 (1924). 16. A. Sur, J. Lebowitz, J. Marro and M. Kalos, Phys. Rev. B 15, 3014 (1977). 17. M. de Jong and J. S. Koehler, Phys. Rev. 129, 40 (1963). 18. A. J. Perry, Acta Metall. 14, 719 (1968). 19. R. H. Balluffi and P. S. Ho, Report, Cornell University, Ithaca (1972). 20. A. Zahra, C. Y. Zahra and M. Latt~tte, Z. Metallk. 70, 669 (1979).