AND KERRY HOURIGAN. Department of .... the regular shedding observed by Stokes & Welsh (1986) from a rectangular plate in a duct at high Re was a result ...
c 2002 Cambridge University Press J. Fluid Mech. (2002), vol. 461, pp. 25–49. DOI: 10.1017/S0022112002008534 Printed in the United Kingdom
25
Response of base suction and vortex shedding from rectangular prisms to transverse forcing By R I C H A R D M I L L S, J O H N S H E R I D A N AND K E R R Y H O U R I G A N Department of Mechanical Engineering, Monash University 3800, Australia (Received 21 June 2001 and in revised form 19 December 2001)
In previous experiments, the vortex-shedding frequency in the flow around rectangular prisms has been found to follow a stepwise variation with chord-to-thickness ratio for two different situations: the natural shedding at low Reynolds number and the excitation of a resonant transverse acoustic mode of a duct for flows at moderate Reynolds numbers. This stepwise variation disappears for natural shedding at Reynolds number higher than approximately 2000; however, it is present at the higher Reynolds numbers for the acoustically perturbed case. The present experimental study shows that if the flow is forced by small transverse oscillations, similar in form to the resonant transverse acoustic mode, the leading-edge and trailing-edge vortex shedding are locked over a wide range of forcing frequencies. However, a stepwise variation in the frequency at which peak base drag occurs is found even at these higher Reynolds numbers. The stepwise frequency variation of vortex shedding in the natural shedding case and the acoustic resonance case are then explained in terms of preference of the flow to shed trailing-edge vortices at peak base drag.
1. Introduction Rectangular prisms or similar geometries can be found in many engineering applications, ranging from high-rise office buildings and bridge decks, to the trash racks used to prevent rubbish from entering waterways. Many factors can affect the flow around rectangular profiles of chord c and thickness t. These include Reynolds number (Re), chord to thickness ratio (c/t), free-stream turbulence, not to mention the complicated effects due to plate vibrations. Much progress has been made in recent times to further our understanding of how these factors can influence the flow, although most recent reviews on bluff-body flows concentrate on the flow about circular cylinders. A distinguishing feature of flows around rectangular prisms, compared to flows around circular cylinders, is the fixed separation point at the sharp leading-edge corners. Naudascher & Rockwell (1994) provide one of the most comprehensive reviews of flow about rectangular profiles. Fage & Johansen (1927) appear to have been the first to measure the drag coefficient (Cd ) for flow around a thin flat plate (c/t = 0.028) placed normal to the oncoming air stream, and found that the drag coefficient was approximately 2.0. By the late 1960s it was well known that for square cylinders (c/t = 1), Cd is also approximately 2.0, so it was assumed that for intermediate c/t values Cd would remain constant at about 2.0. Nakaguchi, Hashimoto & Muto (1968) showed this assumption to be incorrect when they found that a maximum Cd of about 2.8 occurred when c/t = 0.62. For values of c/t > 1.0, Cd steadily decreases to a value of about 1.0 for Cd = 5.
26
R. Mills, J. Sheridan and K. Hourigan
Bearman (1965) showed that the further downstream vortices form from the base of a bluff body, the lower the base suction and, hence, the lower the Cd . Bearman & Trueman (1972) used this argument to explain the cause of the high Cd associated with the c/t = 0.62 geometry. Essentially, as c/t is increased from zero, the shear-layer curvature is initially unaffected by the presence of the afterbody so that the vortex formation position remains in the same location relative to the leading-edge corners. However, the base of the body moves closer to the formation region, and this explains the increase in base suction up to c/t = 0.62. At this stage, the shear layers start to impinge on the trailing-edge corners of the body. As c/t is increased further, a complex equilibrium state is set up where the curvature of the shear layers increases owing to the position of the trailing-edge corners. As a result of this, the high base suction can no longer be maintained and it is observed that the Cd steadily decreases towards a value of about 1.0 as c/t approaches 5.0. ´ an ´ shedding, Vortex shedding from short bluff bodies is characterized by Karm which results from the direct interaction of the two separated shear layers. Vortex shedding from rectangular prisms over a wide range of chord-to-thickness ratios at high Re (i.e. Re > 10 000 based on t) has been grouped into four regimes by Parker & Welsh (1983), depending on plate chord to thickness ratio (c/t). Regime (a) On short plates with c/t < 3.2, flow separation occurs at the leadingedge corners and the shear layers interact directly without reattaching to the plate surface, to form a vortex street. Regime (b) On longer plates (3.2 < c/t < 7.6), the shear layers reattach to the trailing-edge surface periodically in time. After reattachment the separation bubble grows, enveloping the trailing edge and permitting fluid from within the bubble to pass into the vortex formation region, initiating a new vortex. Regime (c) For still longer plates (7.6 < c/t < 16), the shear layers are always reattached upstream of the trailing edge and form a separation bubble which grows and divides in a random manner. This generates a boundary layer with discrete concentrations of vorticity (vortices) which move along the plate surface towards the vortex street formation region. The vortices are distributed randomly throughout the boundary layers and consequently produce irregular vortex shedding and no clear regular vortex street. Regime (d ) For plates with c/t > 16, the separation bubble fluctuates in length in the same manner as described in (c) but the vortices, which are distributed randomly in the boundary layers, diffuse before reaching the trailing edge. The characteristics of the boundary layers on each side of the plate approach those of the fully developed turbulent state and interact to form a regular vortex street not directly related to the formation of leading-edge separation bubbles. For plates with 0 < c/t < 1.0, the Strouhal number St is approximately constant and equal to about 0.13 based on plate thickness. As c/t is increased further, St decreased until it reaches a minimum value of 0.065 when c/t = 3.2. A sudden jump in St occurs as c/t is increased beyond 3.2, indicating shedding in regime (b). For the shortest plates in regime (b), the shedding St is about 0.15, and steadily decreases to a value of only 0.07 for the longest plate (c/t = 7.6). No regular vortex shedding was observed for plates in regime (c), but for longer plates in regime (d ), the vortex shedding St approaches that of an aerofoil leading-edge plate of similar length, indicating that vortex shedding is taking place at the trailing edge of the model, independently of the random fluctuations of the separation bubble at the leading edge. Nakamura, Ohya & Tsuruta (1991) investigated vortex shedding from rectangular
Response of base suction and vortex shedding to transverse forcing
27
plates of various c/t ratios. The studies were all performed at Re = 1000, based on plate thickness t. They observed an interesting feature that the Strouhal number based on plate length (Stc ) was approximately equal to 0.6n, where n is an integer. As plate length was increased, Stc increased in a stepwise manner. When investigating flows over elongated H and ` section prisms with c/t ratios from 2.0 to 8.0 at Re of 50 000 or higher, Nakamura & Nakashima (1986) found that Stc was again almost constant and equal to 0.6. If the St measured by Parker & Welsh (1983) for flow around rectangular prisms in regime (b) are multiplied by plate c/t ratio, then Stc is also approximately constant to about 0.6 at high Re. At the higher Re, once c/t is increased above about 7, the regular vortex shedding breaks down and no jumps to higher values of Stc are observed. A physical interpretation of this staging in Stc is that there is an integer number (n) of vortices on a plate side; the value of n will depend on plate chord. The impinging shear-layer instability mechanism was proposed by Nakamura & Nakashima (1986) to explain vortex formation from elongated bluff bodies and thus the stepwise variation of Stc with c/t. Naudascher & Rockwell (1994) more accurately called this the impinging leading-edge vortex (ILEV) instability mechanism since for long plates (c/t > 7) the leading-edge shear layer does not impinge directly on the trailing edge. Rather, it is vortices shed from the leading-edge separation bubble that do. The study by Nakamura et al. (1991) on flows around rectangular plates found that the ILEV instability was present for plates with c/t up to 16. However, for plates with c/t > 6, Nakamura could not detect any regular vortex shedding for Re > 2000. For low Re, the shear layer separating from the leading-edge corners is initially laminar, and remains so for up to approximately one plate thickness away from the leading edge. As Re is increased, the transition point moves further upstream, making the shear layer less sensitive to external disturbances. Also, the flow along the plate sides becomes increasingly three-dimensional as Re increases. These two factors would combine to weaken the effect of any feedback mechanism for Re > 2000. Naudascher & Rockwell (1994) characterized the different vortex-shedding regimes for stationary rectangular cylinders based on c/t after Parker & Welsh (1983). There are three possible classes of vortex formation: Class i – leading-edge vortex shedding (LEVS); Class ii – impinging leading-edge vortices (ILEV); and Class iii – trailingedge vortex shedding (TEVS) as c/t is increased. More recently, Hourigan, Thompson & Tan (2001) have determined that for rectangular cylinders, the trailing-edge vortex shedding (TEVS) also plays an important role in Class ii vortex formation; there is a preferred shedding frequency from the trailing edge that provides the large base suction and most intense vortex formation. For Reynolds number less than approximately 2000, the identical shedding frequency from both leading and trailing edges returns preferentially to this trailing-edge shedding frequency when permitted by the phasing of the leading-edge vortices. Otherwise, the trailing-edge shedding is forced to vary in frequency to a nearby value that allows the shedding to occur from the redeveloped boundary layer that forms between the shed leading-edge vortices. Nakamura et al. (1991) suggested that although the ILEV instability was not detectable for Re > 2000, this did not mean it was not present. They suggested that the regular shedding observed by Stokes & Welsh (1986) from a rectangular plate in a duct at high Re was a result of the ILEV instability being excited by the loud acoustic resonance set up at a duct β-mode resonant frequency (Parker 1967, 1996). Stokes & Welsh (1986) showed that when the vortex shedding was locked to the acoustic resonant field in the duct, the acoustic feedback had its source at the trailing edge of the rectangular plates. The sound was reflected off the walls of the duct,
28
R. Mills, J. Sheridan and K. Hourigan
before interacting with the separated shear layers to lock the vortex shedding to the duct β-mode resonant frequency. This is clearly an example of a category 2 type of self-sustained oscillation defined by Rockwell & Naudascher (1978), and therefore different to the ILEV instability mechanism proposed by Nakamura et al. (1991). Nevertheless, it is interesting to note the similarity between the acoustic Strouhal number at which peaks in the resonant sound pressure level occur for different length plates, and the ILEV shedding frequencies measured by Nakamura et al. (1991). This is why Nakamura et al. (1991) suggested that the ILEV instability could be excited at Re > 2000. Knisely, Matsumoto & Menacher (1986) investigated the effect of in-line velocity perturbations on vortex shedding from rectangular cylinders. For a cylinder with c/t = 0.5, velocity perturbations of amplitude 1% of the free-stream velocity could result in a decrease in base pressure of 18% compared to the value for steady flow. This decrease occurred when the perturbation frequency was equal to either twice or four times the natural vortex-shedding frequency of the cylinder. Flow visualization showed that associated with the decrease in base pressure, there was an increase in shear-layer curvature, a corresponding decrease in formation length, and an increase in the strength of vortex shedding. With perturbations applied at twice the natural shedding frequency, vortices were shed alternately from each side of the plate, one per cycle. The effect of local velocity perturbations applied to the separated shear layer originating from a cylinder with its axis parallel to the mean flow has been investigated by Sigurdson & Roshko (1985). They observed that the pressure coefficient under the separation bubble and the time mean reattachment length of the shear layer were always decreased in the presence of the local velocity perturbations. The maximum change in pressure under the separation bubble occurred for perturbations applied at frequencies corresponding to wavelengths of vortex shedding similar to the separation bubble height. At high Re, these frequencies were lower than those of the initial Kelvin–Helmholtz instability, and corresponded to the frequency of the shedding type instability of the separation bubble. It was found that as the perturbation level was increased, the minimum pressure under the separation bubble became more negative, and the reattachment length was also reduced for perturbations applied near the separation bubble shedding frequency. Parker & Welsh (1983) were able to simulate the Parker β-mode acoustic field that occurs in ducts by placing a plate in an open jet flow, and locating loudspeakers on either side of the plate. This gave them the added freedom of being able to vary the sound amplitude and frequency independently. They found that vortex shedding from the leading edge of rectangular plates with c/t in regime (c) could be locked to the applied sound frequency over a wide range of acoustic Strouhal numbers (Stp ), and that a regular vortex street was shed at the sound frequency for acoustic Sta between 0.05 and 0.25, based on plate thickness. When this occurred, the length of the separation bubble always decreased, and was found to oscillate at the applied sound frequency. They also found that the leading-edge vortex shedding could only be locked to the sound frequency for plates in regimes (b) and (c), where periodic or permanent reattachment of the separated shear layer on the plate surface occurred. For the shorter plates, the applied sound field had no measurable effect on the vortex-shedding process. The aim of the present study is to test the hypothesis that the frequency of the preferred shedding mode for flow around a rectangular cylinder occurs for minimum base pressure (i.e. strongest trailing-edge shedding). Transverse velocity perturbations
Response of base suction and vortex shedding to transverse forcing Wide angle diffuser
29
Four nylon screens
Electric motor (a.c.) 244 mm × 244 mm square outlet
Centrifugal fan Honeycomb 217 Diameter
Perforated plates
Flow
8:1 Contraction
Honeycomb
B.S. conical inlet
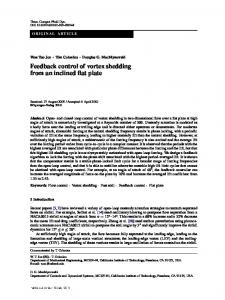
Figure 1. Diagram of the open-jet wind tunnel.
of varying frequency are applied to flows around cylinders of different aspect ratios to determine these preferred frequencies; the results are then compared with the naturally selected frequencies of vortex shedding in unforced flows around rectangular cylinders.
2. Experimental method 2.1. Tunnel design The wind tunnel used was a blow-down open-jet tunnel which was designed and constructed at the Commonwealth Scientific and Industrial Research Organisation (CSIRO), Melbourne. An open-jet wind tunnel was used, rather than a closed-wall tunnel, to eliminate the possibility of acoustic resonances that can be excited by vortex shedding from bluff bodies in enclosed ducts (Welsh & Gibson 1979; Parker 1997). The main drawback associated with the use of an open-jet tunnel is the inherently higher free-stream turbulence level compared to a conventional enclosed draw-down type tunnel. The wind tunnel is illustrated in figure 1. Air is drawn into the wind tunnel through a BS848 conical inlet. The conical inlet has four surface pressure tappings placed 100 mm downstream of the inlet, and contains a honeycomb to minimize swirl in the inlet. Using these pressure tappings, the velocity in the working section can be calibrated to the pressure drop across the conical inlet. Air flow is supplied by a Richardson Pacific 11 blade centrifugal fan powered by a variable-speed threephase a.c. motor controller. Flow from the fan passes through a wide-angle diffuser containing four perforated plates into a settling chamber containing a honeycomb and four nylon screens. It then passes through an 8 : 1 contraction into a 244 mm×244 mm square outlet from which it exits to form a free jet. The tunnel could operate over a jet velocity range of 0–15 m s−1 . Figure 2 shows the location of the model in the working section and the loudspeakers either side of the model to generate the transverse velocity perturbation.
30
R. Mills, J. Sheridan and K. Hourigan Thickness, y Chord, x Speaker
Span, z
Contraction w Flo
Model End plates
Speaker
Figure 2. Diagram of wind tunnel working section.
2.2. Tunnel characteristics 2.2.1. Velocity profile The uniformity of the airflow across the tunnel outlet was established by measuring the dynamic pressure with a Pitot tube mounted on an X–Y traverse at a series of regularly spaced points across the working section. The velocity was found to be constant to within ±0.5% across the central core of the jet. For all experiments, the models were placed entirely within the core of the jet. 2.2.2. Longitudinal turbulence intensity A TSI hot-wire probe was used to measure the velocity spectra and turbulence level of the free jet. A TSI IFA 100 two-channel hot-wire anemometer was used in conjunction with a single TSI 1210T1.5 hot-wire probe. The single wire was mounted normal to the oncoming air stream to give a measure of longitudinal turbulence intensity. The minimum turbulence level measured was 0.25% adjacent to the tunnel exit for velocities between 6 m s−1 and 12 m s−1 (with components less than 1 Hz filtered out). This increased to 1.0% at a distance of 1 outlet diameter downstream, and reached about 2.5% at the furthest point downstream at a distance of 2 outlet diameters. This variation of turbtulence level is consistent with that expected of an open jet, and matches closely the results obtained by Michel & Froebel (1988). They found that the increase in turbulence level in the open jet can be attributed to instabilities in the shear layers bounding the jet, magnifying with streamwise distance. 2.3. Experimental instrumentation and models 2.3.1. Data acquisition and processing All wind-tunnel data were digitally sampled using a Boston Technologies PC-30DS 12 bit analogue to digital (A/D) conversion board, which was interfaced with a 486 PC. The input range of the A/D board was −5 V to +5 V, giving a resolution of 2.44 mV per bit. Eight A/D channels were available on the Boston A/D board, with
Response of base suction and vortex shedding to transverse forcing
31
the computer software able to control sample size and frequency. The maximum sample frequency was 100 kHz, and the sample size was limited by the available memory on the PC. The Boston A/D board also had four digital interfaces, one of which was used to control the Scannivalve. The Scannivalve was used to connect the Setra 239E pressure transducer to the pressure tappings on the wind-tunnel models, one at a time. 2.3.2. Pressure and velocity measurement Two pressure transducers were used on the open-jet wind-tunnel experimental rig. One was a Setra model 239E with a working range of −115 Pa–+130 Pa, while the other was a Setra model 261-1 with a working range of −600 Pa–+600 Pa. The Setra 239E transducer was used to measure the surface pressures on the experimental models, as well as to calibrate the Setra 261-1 transducer. The mean velocity in the working section of the wind tunnel was measured by connecting the four pressure tappings around the conical inlet in parallel to the 261-1 transducer. The sampling frequency was 2048 Hz for all surface-pressure measurements. A sampling time of 4 s was used when measuring the time-averaged pressure, and the sound pressure level, which gave repeatable results to within 1%. With the vortex-shedding frequency never being less than 50 Hz, a sample time of 4 s captured data over at least 200 shedding cycles. 2.3.3. Wind tunnel models All the test plates were made from brass, using a Hitachi–Seiki VK45 numerically controlled milling machine and have a nominal thickness of 13 mm ± 0.02 mm. Three of these rectangular plates have pressure tappings placed at regular intervals on one side and on the front and rear faces to enable time mean surface-pressure coefficients to be measured. Of the three, two of them are identical having a c/t ratio of 3, no pressure tappings on the rear face, and one pressure tapping in the cover plate to aid in aligning the plates with the air flow. The third plate has a c/t ratio of 6, and has two pressure tappings placed in the cover (one 15 mm from the leading edge, one 15 mm from the trailing edge) to assist with alignment. All pressure tappings have an internal diameter of 1.0 mm, and care was taken to ensure that the tap hole edges were sharp, and that they were flush with the model surface after insertion into the model. A series of spacer plates with no pressure tappings was also constructed having c/t ratios of 2, 3, 4, 6 and 8. These allowed the overall plate length to be varied in the range 6 < c/t < 16 in integer steps. End plates were constructed from 9 mm thick Perspex, and used in all tests. Their main function was to keep the acoustic field uniform around the model (Parker & Welsh 1983). 2.3.4. Smoke wire Flow visualization was performed in the wind tunnel with the use of a smoke-wire technique, described by Corke et al. (1977). A thin NiChrome wire of diameter 0.1 mm was wiped with a cloth soaked in Castrol white technical oil. The oil subsequently formed into small drops on the wire; when an electric current was passed through the wire, the wire was heated and the oil vaporized to form streaks of smoke. For the oil used, a voltage of 35 V proved to give the best smoke density with an air velocity of 6 m s−1 . The small wire diameter used was necessary so that the Reynolds number for the thin wire was no more than 40, leaving a steady wake with undistorted streaklines. A 35 mm Nikon F90X single lens reflex camera was used to take the images, with Kodak TMax 400 ASA black and white film. A Photo Pro Electronics strobe with an
32
R. Mills, J. Sheridan and K. Hourigan
energy output of 1 Joule per flash and a 20 µs flash duration was used to illuminate the smoke streaks. The relatively short flash duration was required so that a clear image could be obtained, without blurring of the streaklines. 2.3.5. Signal generator, amplifier and speakers Loudspeakers were placed 185 mm above and 185 mm below the plate outside the jet to generate a transverse velocity perturbation at an adjustable amplitude and frequency (see figure 2). With the models mounted midway between the speakers, the transverse velocity perturbation field generated by the speakers was similar to the Parker β-mode acoustic resonant field (Parker 1966, 1997) found to occur in ducts. A Wavetek Model 145 20 MHz pulse/function generator was used to generate a sine wave signal at different frequencies. The frequency of the signal was measured using a Venner Electronics Digital Counter Type TSA6636/2, which was connected to the signal generator in parallel with a stereo amplifier. The amplifier used was a Yamaha stereo amplifier type A-700, while the speakers were a Lorantz Audio 12 in. single-cone design, with a frequency range of 50 Hz–1 kHz. The speakers were connected in antiphase, and could generate sound pressure levels of 120 dB (re 20 µPa) measured at the midchord position on the plate surface, when driven at a frequency of 100 Hz. 2.3.6. Measurement of transverse perturbation using LDV In order to allow direct comparison of wind-tunnel data with data obtained from other experimental facilities as well as CFD data, the size of the velocity perturbation applied to the mean flow was measured using a laser-Doppler velocimetry (LDV) system. A TSI system 9100 Helium–Neon LDV system configured in a simple forwardscatter arrangement was used, with no beam expansion or frequency shifting. A smoke generator was used to produce seeding particles. To achieve a zero mean velocity for the seeding particles in the working section, the entire room containing the wind tunnel was filled with the seeding particles, which were allowed to settle for a period of several minutes. Once the size of the velocity perturbation had been measured, a probe microphone positioned at the midchord position above the plate surface was then used to ensure that the sound pressure level (SPL) for all subsequent tests was held constant. Because the r.m.s. fluctuating pressure (Prms ) is directly proportional to the maximum perturbation velocity (Parker & Welsh 1983), the microphone was used to measure the SPL needed for each experiment to generate velocity perturbations of a required amplitude.
3. Results and discussion 3.1. Range of measurements Experiments were performed in the open-jet wind tunnel on rectangular plates 13 mm thick, with chord to thickness ratios (c/t) between 6 and 16. Surface-pressure measurements and smoke-wire visualizations were performed in the open-jet wind tunnel at Re ranging between 5000 and 13 000. The longitudinal turbulence intensity (u0 /U∞ ) at the location of the leading-edge corner of all models tested was less than 0.3%. Parker & Welsh (1983) reported that for plates with c/t > 7.6 in the absence of external flow perturbations, no regular vortex shedding is observed in the wake in this Re range.
Response of base suction and vortex shedding to transverse forcing
33
1.0
0.8
0.6 Cps 0.4
0.2
0 –6
–4
–2
0
2
4
6
Distance from centreline (mm)
Figure 3. Time mean surface pressure coefficient on upstream surface of a rectangular plate.
3.2. Surface-pressure measurements and smoke-wire flow visualization Figure 3 shows the variation of the time mean local surface pressure coefficient (Cps ) over the upstream face of a rectangular plate with c/t = 10, and U∞ = 10 m s−1 (Re = 8667). At the centre of the surface is a stagnation point; as expected, the pressure coefficient there is equal to 1.0. Changing the plate c/t ratio had no measurable effect on the distribution of the pressure coefficient over the upstream face of the plates tested. Figure 4 shows the variation of time mean Cps along the streamwise surface of the same plate. A relatively high level of suction occurs under the separation bubble. After the reattachment point of the separated shear layer, the magnitude of Cps remains less than 0.1 until within 1.5 plate thicknesses of the trailing-edge corner of the plate. Also shown are data from Ram & Arakeri (1990) for the time mean surface pressure coefficient measured under the separation bubble of a long flat plate. Ram & Arakeri measured the time mean reattachment length of the separation bubble to be 4.8t, with Re = 8600 based on t, and the longitudinal turbulence intensity equal to 0.3%. The good agreement between the two sets of data indicates that the time mean reattachment length for the c/t = 10 plate would also be 4.8t. For plates with c/t > 7.6, the variation of the surface pressure coefficient (Cps ) along the streamwise surfaces under the separation bubble of a rectangular plate is unaffected by plate length, since the time-dependent separated shear layer always reattaches to the plate surface. The smoke-wire visualization of the flow about a rectangular plate with c/t = 10 in figure 5 shows the shear layers on each side of the plate reattaching upstream of the trailing edge. Figure 6 shows the variation in the unforced case of the time mean base pressure Cpb with c/t for U∞ = 10 m s−1 . The base suction (−Cpb ) increases with c/t from a value of 0.16 for c/t = 6 to 0.23 for c/t = 15. The unforced leading-edge separation bubble sheds vortices randomly in time for plates with c/t > 7.6 (Hillier & Cherry 1981). As c/t is increased, the irregular patches of vorticity in the boundary layer become more diffused before reaching the trailing edge. Thus, as c/t is increased, the nature of the boundary layers at the trailing-edge separation points on the sides of the plate approaches a fully developed turbulent state (Parker & Welsh 1983), and for plates with c/t > 16, regular vortex shedding occurs at the trailing edge. The
34
R. Mills, J. Sheridan and K. Hourigan –1.0 c/t = 10 Ram and Arakeri
–0.8
–0.6 Cps –0.4
–0.2
0
1
2
3
4
5
6
7
8
9
10
Distance from leading edge (x/t)
Figure 4. The variation of the surface pressure coefficient (Cps ) with distance from the leading edge along the streamwise surface of the plate; , c/t = 10 (Re = 8667); �, data from Ram & Arakeri (1990) for a long rectangular plate (Re = 8600).
◦
Figure 5. Smoke-wire visualization of unforced flow about a rectangular plate with c/t = 10.
effect of applied perturbations above a minimum threshold level was to correlate the vortex shedding across the span of the model, and to increase the circulation and peak vorticity of the vortices shed. The vortex formation length was also observed to decrease. These factors combined result in a large decrease in Cpb when the vortex shedding at the trailing edge phase-locks to the transverse perturbations. For plates with rectangular leading edges, flow separation occurs at both the leading and trailing edges of the model. Parker & Welsh (1983) reported that rectangular plates with c/t between 6 and 16 can shed regular vortices to form a wake with the same frequency as transverse velocity perturbations, for perturbation Strouhal
Response of base suction and vortex shedding to transverse forcing
35
–0.25
–0.20
–0.15 Cpb –0.10
–0.05
0
6
7
8
9
10
11
12
13
14
15
c/t
Figure 6. Variation of Cpb with c/t, with U∞ = 10 m s−1 . –1.2 No perturbation 7% perturbation 8% turbulence
–1.0
–0.8
Cp –0.6
–0.4
–0.2
0
1
2
3
4
5
6
7
8
9
10
Distance from leading edge, x/t
•
Figure 7. Variation of Cps along the streamwise surface of a rectangular plate; , c/t = 10 with no perturbation; �, c/t = 10 with 7% transverse velocity perturbation applied at Stp = 0.17; �, data from Saathoff & Melbourne (1989) for 8% free-stream turbulence.
numbers (Stp ) between 0.05 and 0.25 (Stp based on plate thickness). Figure 7 shows the effect of transverse velocity perturbations applied at Stp = 0.17 on the time mean surface-pressure coefficient along the streamwise surface of a rectangular plate with c/t = 10, compared to Cps without any perturbation field applied. Data from Saathoff & Melbourne (1989) for flow over a long rectangular plate with an 8% free-stream turbulence level are also presented for comparison, and show a strong similarity to the data for a 7% transverse velocity perturbation. With the vortex shedding at the leading edge phase-locked to the transverse velocity perturbations, the vortex formation length is significantly reduced, and the strength
36
R. Mills, J. Sheridan and K. Hourigan
Figure 8. Smoke-wire visualization of forced flow about a rectangular plate with c/t ratio = 10 and Stp = 0.17.
of shed vortices is increased, resulting in a much higher peak in the time mean Cps under the separation bubble. The effect of the transverse perturbations on increasing shear-layer curvature and decreasing reattachment length can be seen by comparing figure 8 (perturbations applied) with figure 5 (no perturbation). In an earlier limited study, it was reported by Hourigan et al. (1993) that surfacepressure coefficients measured using different flow velocities were identical if the relative perturbation level was kept constant. This was confirmed in the present study. For example, the case of c/t = 10 in the presence of a 7% transverse velocity perturbation and two different flow velocities (8 m s−1 and 10 m s−1 ) was studied. Stp was equal to 0.17 in both cases, and the good agreement between the two sets of data demonstrates the repeatability of the pressure measurements. Cooper, Sheridan & Flood (1986) found that the base pressure coefficient (Cpb ) for a rectangular plate with c/t = 10 always reduced in the presence of transverse velocity perturbations, although no explanation for the changes in Cpb was offered. Figure 9 shows the effect on the base pressure coefficient across the span of the c/t = 10 plate when a 7% transverse velocity perturbation is applied at a perturbation Strouhal number (Stp ) of 0.17. The uniformity of the pressure coefficient across most of the span, apart from boundary layers on the side, show that the mean flow is largely two-dimensional and therefore the pressure tapping at midspan records a representative pressure reading. Comparing the flow visualizations in figure 5 (unforced case) and figure 9 (forced case) together with the surface pressure coefficient plots in figure 8, it can be seen clearly that the effect of locking leading-edge shedding to transverse velocity perturbations is to increase the suction under the separated shear layer, as well as reduce the time mean length of the separation bubble. The base suction is also found to undergo a large increase in this case, whereas the surface pressures on the upstream face are virtually unaffected. The effect on Cpb of varying perturbation frequency is illustrated in figure 10 for a plate with c/t = 10, a 4.5% relative perturbation level and U∞ = 10 m s−1 . With no perturbations applied, Cpb = −0.195. Because of the limitations of the loudspeakers used to generate the transverse velocity perturbations, it was not possible to apply velocity perturbations for Stp < 0.13 at this perturbation level. Since there is no regular vortex shedding from rectangular plates with c/t between
Response of base suction and vortex shedding to transverse forcing
37
–0.6 –0.5 –0.4 Cpb –0.3 –0.2 –0.1
No perturbation 7% perturbation
0 –60
–40
–20
0
20
40
60
Distance from centreline (mm)
Figure 9. Effect of 7% transverse velocity perturbation applied at Stp = 0.17 on Cpb measured at pressure tappings across the span for a rectangular plate with c/t = 10. 0.4 c/t 8 10
–Cpb 0.3
0.2 0.12
0.14
0.16
0.18
0.20
0.22
0.24
0.26
Stp
Figure 10. Comparison of base suction (−Cpb ) vs. Stp for plates with c/t = 8 and 10; U∞ = 10 m s−1 and perturbation level = 4.5%.
8 and 16 in the absence of transverse velocity perturbations for Re > 2000 (Parker & Welsh 1983), it is interesting to note that a peak in Cpb of −0.393 occurs for Stp = 0.17. Parker & Welsh (1983) found that vortex shedding from the leading edge could be phase-locked to transverse velocity perturbations over a range of Stp from 0.05 to 0.25, resulting in a near wake with the same St. Therefore, over the entire range of Stp shown in figure 10, vortex shedding from the leading edge will have been phase-locked to the transverse velocity perturbations. Saathoff & Melbourne (1997) found that in turbulent flow, the turbulence length scale (inversely related to the frequency of turbulence fluctuations) had virtually no effect on the time mean surface pressure under the separation bubble of a long flat plate. Rather, it was the relative turbulence level that determined the surface-pressure distribution under
38
R. Mills, J. Sheridan and K. Hourigan
the separation bubble. With the relative perturbation level kept constant as Stp was varied, changes in applied frequency and thus spacing between vortices (which is analogous to turbulence length scale) shed from the leading edge had virtually no effect on the time mean surface-pressure coefficient under the separation bubble. By itself, this does not explain the variations in Cpb shown in figure 10 that occur as Stp is varied. Nakamura et al. (1991) found that the Strouhal number for vortex shedding from rectangular plates with c/t = 10 at Re = 1000 was 0.18, which is close to the Stp at which the peak in Cpb shown in figure 10 occurs. A two-dimensional laminar numerical simulation by Ohya et al. (1992) of flow about elongated rectangular plates at Re = 1000 showed that regular vortex shedding from the trailing edge, as well as the leading edge, was a natural feature of the flow; however, no mention was made of the role of this trailing-edge vortex shedding in the feedback loop leading to stepwise variation of the natural vortex-shedding frequency. This has been examined by computational means recently by Hourigan et al. (2001). It is hypothesized that the peak in Cpb observed in figure 10 for c/t = 10 at Stp = 0.17 is due to the transverse velocity perturbations locking vortex shedding at the trailing edge as well as the leading edge to the frequency of the perturbations. Although three-dimensional instabilities arise in the spanwise vortices, previous studies by Hourigan et al. (1993, 2001) have shown that this still results in two-dimensional bands of vorticity convecting along the plate. This hypothesis is supported by the results of a two-dimensional computational fluid dynamics (CFD) simulation of the flow about a rectangular plate at Re = 400 with c/t ratio of 10, as reported by Tan, Thompson & Hourigan (1998); they showed that transverse velocity perturbations applied at a frequency equal to the natural vortex-shedding frequency (St = 0.18) locked vortex shedding at both the leading and trailing edges, resulting in the most negative Cpb . Applying perturbations at Stp = 0.16 also resulted in trailing-edge shedding being locked to the transverse perturbations, but the magnitude of Cpb was less owing to trailing-edge vortices forming further away from the base of the plate. For perturbations applied at Stp = 0.20, the trailing-edge shedding was still locked but very weak, and the magnitude of Cpb was less than in both cases mentioned above. For the c/t = 10 case, the shape of the base suction (−Cpb ) vs. Stp curve in figure 10 shows that as Stp is either increased or decreased from the frequency that results in the peak value of −Cpb , the base suction decreases steadily to a value close to the −Cpb that is measured without transverse velocity perturbations applied. This smooth change in base suction indicates that vortex shedding at the trailing edge may be locked to the velocity perturbation for Stp both above and below the Stp that results in the highest base suction. This is supported by flow visualization recorded on video and by the CFD predictions of Tan et al. (1998). 3.3. Effect of plate length on variation of Cpb in response to perturbations Shown in figure 10, for the plate with c/t = 8, there is a peak in −Cpb when Stp = 0.138, indicating that vortex shedding at the trailing edge is locked to the perturbations at this frequency. As Stp is increased further, there is a decrease in −Cpb , with a local minimum occurring at Stp = 0.17 indicating that the vortex shedding at the trailing edge is either very weak or no longer locked to the perturbations. This is in contrast to the plate with c/t = 10, for which there is a maximum in −Cpb at Stp = 0.17. As discussed above, vortex shedding from the leading edge is locked to the perturbation frequency, and occurs alternately from each side of the model.
Response of base suction and vortex shedding to transverse forcing
39
(a)
(b)
Figure 11. Flow visualization of flow over rectangular plates with vortex shedding locked to transverse velocity perturbations; u0 /U∞ = 5%, Stp = 0.17. (a) c/t = 8, (b) 10.
Stokes & Welsh (1986) found that leading-edge vortices are always shed at the same phase in the perturbation cycle, independent of c/t ratio. Assuming that the convection velocity of vortices is not affected by changes in plate c/t ratio, the plate chord changes the point in the acoustic phase at which the leading-edge vortices arrive at the trailing edge. It was hypothesized by Hourigan et al. (1993) that interference with the trailing-edge vortex shedding by the leading-edge vortices may be responsible for the significant variation in −Cpb (in the present case, between the two sets of data shown in figure 10). This hypothesis was called the vortex interaction hypothesis. Figure 11 shows two smoke-wire flow visualization images of flow around rectangular plates in the presence of a 5% transverse velocity perturbation applied at Stp = 0.17. The phase of the perturbation cycle at which the images were taken is the same in each case; it can be seen that vortices shed from the leading edge are in similar streamwise locations, and the spacing between them is unaffected by the difference in the c/t ratio of each plate. This shows that the convection velocity of vortices shed from the leading edge when locked to transverse velocity perturbations is unaffected by changes in the c/t ratio, which is a necessary condition for the vortex interaction hypothesis to be valid. Figure 12 shows schematically the predicted locations of vortices surrounding two plates of different chord–thickness ratios, at two different phases of the perturbation cycle. Vortex shedding from the leading edge is phase-locked to the transverse velocity perturbations, and the phase of vortex formation and shedding at the leading edge
40
R. Mills, J. Sheridan and K. Hourigan L–
L– c/t = 8
L–
c/t = 10 L+
T– L+
0º
T+ (forming)
L– L+
L+
L–
L–
L– c/t = 8
L+
L+
L–
L–
No trailing edge vortex shedding
L–
L–
L–
c/t = 10
T+
T–
L+
L+
90º
Figure 12. Illustration of vortex shedding from two rectangular plates of different chord–thickness ratios, subject to transverse velocity perturbations of the same amplitude and frequency.
relative to the phase of the perturbation cycle is unaffected by the position of the trailing edge. For the left-hand pair of plates, the c/t = 10 plate has a vortex that is starting to form at the trailing edge. The c/t = 8 plate has a vortex that was shed from the lower leading edge passing the lower trailing edge corner at the same phase in the forcing cycle, which interferes with the vortex shedding at the trailing edge. The two plates on the right-hand side of figure 12 denote the predicted location of vortices surrounding the plate and in the wake after a further 90◦ of the perturbation cycle, showing the nearly fully formed vortex at the trailing edge of the c/t = 10 plate. One experiment performed in order to test the vortex interaction hypothesis was to measure Cpb for rectangular plates with c/t ranging from 6 to 16 in integer steps. The results for each plate c/t ratio are shown in figure 13 for a relative velocity perturbation level of 4.5%, and U∞ = 10 m s−1 . For all plate c/t ratios tested, the base suction (−Cpb ) exhibited a local peak at some value of Stp . The value of Stp at which these peaks occur shows a strong dependence on c/t ratio. Figure 13 clearly shows that the peaks in −Cpb occur in three distinct groups. This feature is again consistent with the vortex interaction hypothesis. In order to strengthen the argument in favour of the vortex interaction hypothesis, it must be established that vortex shedding at the trailing edge can, in fact, be simultaneously locked to the transverse velocity perturbations with the leading-edge vortex shedding. PIV experiments were performed in a water tunnel to investigate this fully; the results from water tunnel experiments will be presented in a separate paper showing the locking of the trailingedge shedding. A sample plot of the vorticity contours derived from that PIV study is shown in figure 14. At the trailing edge, a trailing-edge vortex is forming from the lower side. A leading-edge and a trailing-edge vortex are merging from the upper side of the plate in the wake. Independent vortex formation occurs at the leading and trailing edges with both locked to the forcing frequency. Table 1 gives the values of Cpb and Stp at which peaks in Cpb occur for each plate length tested, when the relative perturbation level is 4.5% and U∞ = 10 m s−1 . Figure 15 shows the difference between the peak values of Cpb and the Cpb measured in the absence of perturbations for each c/t ratio tested. Plates with c/t = 6, 7, 10, 11, 14, 15 and 16 show the largest peak values of Cpb , with only a single peak occurring as Stp is increased. These plates will be referred to as the primary plates. For the
Response of base suction and vortex shedding to transverse forcing
0.4
0.4
0.3 –Cpb
41
0.3
0.2
–Cpb
0.2
16
0.26 0.24
14 0.22 12 0.20 c/t
10
0.18
Stp
0.16
8 0.14 6
Figure 13. Surface plot of base suction (−Cpb ) as c/t and Stp are varied; relative perturbation level = 4.5%, U∞ = 10 m s−1 .
Figure 14. Vorticity contour plots for a rectangular plate with c/t = 7, Re = 490, 5% velocity perturbation, Stp = 0.172.
other plates (c/t = 8, 9, 12 and 13), the sizes of the peaks are significantly smaller. Even smaller secondary peaks are also found to occur for these other plates, which will be referred to as the intermediate plates. For the plate with c/t = 9, the size and Stp of the secondary peak was extrapolated from data, which will be presented later, obtained when a lower perturbation level was applied. An important finding in support of the vortex interaction hypothesis is that for the intermediate plates, with perturbations applied at the same Stp that result in peaks
42
R. Mills, J. Sheridan and K. Hourigan
c/t
Stp of peak in Cpb
Cpb (peak values)
Stp of secondary peak in Cpb
6 7 8 9 10 11 12 13 14 15 16
0.150 0.155 0.1375 0.180 0.170 0.170 0.165 0.195 0.180 0.180 0.175
−0.401 −0.402 −0.308 −0.307 −0.393 −0.392 −0.338 −0.332 −0.381 −0.402 −0.362
Not present Not present 0.210 0.116 Not present Not present 0.210 0.155 Not present Not present Not present
Cpb (secondary peak value)
−0.243 −0.250 estimated −0.287 −0.301
Table 1. Peak values of Cpb and the values of Stp for which they occur (Re = 8667, 4.5% perturbation). 0.25
0.20
0.15 DCpb 0.10
0.05
0
6
7
8
9
10
11
12
13
14
15
16
c/t
Figure 15. Difference in Cpb for each plate chord to thickness ratio (c/t) tested between peak values of Cpb and Cpb measured without perturbation applied; relative perturbation level = 4.5%, U∞ = 10 m s−1 .
in Cpb for the primary plates, the magnitude of Cpb is significantly reduced. This is consistent with the assumption that vortices shed from the leading edge (hereinafter called L vortices) interfere with vortex shedding at the trailing edge depending on the phase in the perturbation cycle at which they arrive at the trailing edge. As c/t is increased, the spacing between the peaks in Cpb shown in figure 13 (and spacing between the peaks in ∆Cpb shown in figure 15) is approximately equal to 4.0t. Although there is no regular vortex shedding from rectangular plates in the absence of any flow perturbations for Re > 2000 and with 7.6 < c/t < 16, there is weak vortex shedding from the separation bubble on a long rectangular plate (c/t > 20) of vortices with size similar to the separation bubble (Kiya & Sasaki 1983). Soria, Sheridan & Wu (1993) found that the shear layer separated from a rectangular plate is
Response of base suction and vortex shedding to transverse forcing
43
3.0
2.4
1.8 Stc 1.2
0.6
0
2
4
6
8
10
12
14
16
c/t
•
Figure 16. Vortex shedding Stc for elongated rectangular plates; , Stp (based on plate chord) corresponding to peaks in Cpb data (4.5% perturbation level); �, Stc measured by Nakamura et al. (1991) at Re = 1000 (solid symbols indicate the primary peaks, open symbols indicate secondary peaks where detected); F, St measured by Stokes & Welsh (1986).
convectively unstable in nature, which is consistent with the fact that vortex shedding from the leading edge of long rectangular plates is receptive to flow disturbances over a wide range of frequencies. The response of a plane mixing layer to disturbances or perturbations in the flow shows a similar receptivity, and Hillier & Cherry (1981) found that the shear-layer development over the first 60% of the separation bubble length is similar to that of a mixing layer. Only over the last 40% of the separation bubble length does the shear-layer development differ from a mixing layer, owing to the presence of the downstream reattachment surface of the plate. Although the shear layer is convectively unstable, the presence of the downstream reattachment surface causes a weakly periodic shedding of vortices from the separation bubble in the absence of other flow disturbances. Hot-wire measurements by Kiya & Sasaki (1983) showed a broad spectral peak at the reduced frequency of 0.6U∞ /XR , and found the spacing between these vortices shed from the separation bubble to be approximately 3.8t. This spacing between vortices is very close to the spacing between the peaks in Cpb as c/t is increased, of approximately 4.0t. For long rectangular plates at low Re (Re < 2000) and in the absence of external flow disturbances, a feedback mechanism called the impinging leading edge vortex (ILEV) instability characterizes vortex shedding. Vortex shedding from the leading edges is periodic, and is locked to the plate chord so that Stc = 0.6n, where n is an integer and equal to the ILEV mode. Depending on the plate c/t ratio, it may take several shedding cycles for an L vortex to pass the trailing edge. Since each feedback pulse is generated as an L vortex passes the trailing edge, as the c/t ratio is varied, L vortices always pass the trailing edge at the same phase in the leading-edge shedding cycle. As shown by Tan et al. (1988), T vortices and L vortices of like sign merge together in the near wake. Therefore, T vortices are always generated at the same phase in the leading-edge shedding cycle regardless of c/t ratio and are shed just as the L vortex of the same sign approaches the trailing edge. Nakamura et al. (1991) found that the most vigorous and regular vortex shedding
44
R. Mills, J. Sheridan and K. Hourigan –0.5 (a)
Perturbation 3% 4% 4.5% 5%
–0.4
Cpb –0.3
–0.2
0.12
0.16
0.20
0.24
0.28
–0.5 (b)
Perturbation 3% 4% 4.5% 5%
–0.4
Cpb –0.3
–0.2
0.12
0.16
0.20
0.24
0.28
–0.5 (c)
Perturbation 2.5% 3% 4% 4.5% 5% 6%
–0.4
Cpb –0.3
–0.2
0.12
0.16
0.20
0.24
Stp
Figure 17 (a–c). For caption see facing page.
0.28
Response of base suction and vortex shedding to transverse forcing –0.5
45
(d ) Perturbation 3% 4% 4.5% 5%
–0.4
Cpb –0.3
–0.2
0.12 –0.5
0.16
0.20
0.24
0.28
(e) Perturbation 3% 4% 4.5% 5%
–0.4
Cpb –0.3
–0.2
0.12
0.16
0.20
0.24
0.28
Stp
Figure 17. Effect of varying perturbation level, for representative plates on Cpb as Stp is varied. (a) c/t = 6, (b) 8, (c) 10, (d ) 12, (e) 14.
occurred for plates with c/t = 6 and 10, whereas the plate with c/t = 8 shed vortices intermittently at two different frequencies. For the experiments performed in the open-jet wind tunnel, as Stp was varied, the plates with c/t = 6 and 10 showed single, large peaks in Cpb , whereas the plate with c/t = 8 showed two much smaller peaks in Cpb , at frequencies close to the two possible ILEV frequencies for natural vortex shedding at low Re. This is reflected in figure 15, which shows the largest change in Cpb measured for each c/t ratio tested. The peaks of Cpb observed in figure 13 appear to occur in distinct groups, similar to the Stc measured by Nakamura et al. (1991). Thus, the Stp data presented in table 1 at which peaks in Cpb occur for each plate length have been multiplied by plate c/t ratio, and are presented in figure 16 along with the Stc that Nakamura measured at Re = 1000. As discussed earlier, for rectangular plates in the presence of transverse velocity perturbations, L vortices are always shed at the same phase in the perturbation cycle regardless of c/t ratio (Stokes & Welsh 1986). The similarity between the two sets of
46
R. Mills, J. Sheridan and K. Hourigan
data shown in figure 16 adds weight to the argument that peak values of Cpb occur at Stp when L vortices pass the trailing edge at the same phase in the perturbation cycle regardless of c/t ratio. This adds further support to the vortex interaction hypothesis. 3.4. Effect of perturbation level on Cpb Experiments were performed using relative perturbation levels of 3%, 4%, 4.5% and 5% compared to free-stream velocity, while keeping the free-stream velocity constant at 10 m s−1 . Representative results of these experiments are shown in figure 17 for plates with c/t ratios between 6 and 15. The aim of these experiments was to investigate how the perturbation level affected both the frequency at which peaks in Cpb occurred, and the magnitude of the peaks in Cpb . For all the primary plates (c/t ratios of 6, 7, 10, 11, 14 and 15), as the perturbation level is increased, the magnitude of the peak in Cpb reached increases. This was expected, given that increasing perturbation level on the flow about both a circular cylinder (Stansby 1976) and a plate with an aerofoil leading edge and a rectangular trailing edge (Mills 1998) increases the magnitude of the peak in Cpb . In general, as the perturbation level applied to the flow about a bluff body is increased, the range of frequencies over which vortex shedding can be locked to the perturbations increases. Thus, with increasing perturbation level, the peaks in Cpb would be expected to be broader. This is indeed the case for the primary plates, where only a single distinct peak is observed. Also, for all primary plates that are in regime (c), as defined by Parker & Welsh (1983) (i.e. c/t > 7.6), the Stp at which peaks in Cpb occur show little variation as the perturbation level is varied. For the two primary plates with c/t ratios in regime (b) (c/t = 6 and 7), in the absence of perturbations and for Re > 2000 these plates shed vortices naturally at ILEV mode = 1. When perturbations are applied, as the relative perturbation level is increased, the Stp at which the maximum base suction occurs also increases, and approaches the frequency corresponding to ILEV mode 2 shedding. For the intermediate plates, a slightly different behaviour is observed. Generally, as the perturbation level increases, so does the magnitude of the peak in Cpb . However, the Stp at which peaks occur can be quite dependent on perturbation level. This is especially evident for the plate with c/t = 12. Assuming that L vortices can either enhance or interfere with the shedding of T vortices, the intensity of L vortices locked to perturbations would increase as perturbation level increases, and thus the likelihood of L vortices affecting the shedding of T vortices. Further investigation is needed to explain this behaviour. 3.5. Effect of Reynolds number on Cpb The effect of varying Re on Cpb was also investigated. Representative results are shown in figure 18. Because of the limitations of the loudspeakers used to generate the transverse velocity perturbations, it was only possible to measure the effect of varying Re using a 3% velocity perturbation relative to the free-stream velocity. Flow velocities used ranged between 6 m s−1 and 14 m s−1 , corresponding to a Re range of 5200–12 130. For all plate c/t ratios tested, the Stp at which peaks in Cpb occur was virtually independent of Re, and occurred at Stp close to the St measured by Nakamura et al. (1991) for the natural ILEV modes. However, for most plate c/t ratios the magnitude of the peaks in Cpb showed some variation with Re. The exact nature of this variation is unclear, and warrants further investigation. However, a trend in the data was evident. Only two plates, with c/t ratios of 10 and 15, showed no variation
Response of base suction and vortex shedding to transverse forcing
47
(a) –0.33
Reynolds number 5200 8667 12 130
–0.29
Cpb
–0.25
–0.21
–0.17 0.1
–0.33
0.2
0.3
(b)
0.5
Reynolds number 5200 6930 8667 10 400 12 130
–0.29
Cpb
0.4
–0.25
–0.21
–0.17 0.1
0.2
0.3
Stp
Figure 18. Effect of varying Stp on Cpb at different Re, for plates with (a) c/t = 6, (b) 10; perturbation level in each case was 3%.
with Re within experimental error. For intermediate length plates where two peaks were evident, the peak corresponding to the higher ILEV mode was always smaller at lower Re, whereas the opposite was found for the peak corresponding to the lower ILEV mode, where it was generally larger at lower Re.
4. Conclusions Experiments on the forced flow around rectangular prisms of varying chord-tothickness ratios have been undertaken in an open-jet wind tunnel. It was found that if the flow is forced by small transverse oscillations, similar in form to the resonant transverse acoustic mode, the leading-edge and trailing-edge vortex shedding are locked over a wide range of forcing frequencies. Locking of the shedding, plus a stepwise variation in the shedding frequency, has been found previously also in the unforced (natural) shedding case for Reynolds number less than approximately 2000.
48
R. Mills, J. Sheridan and K. Hourigan
The hypothesis tested here is that the trailing-edge shedding, being chiefly responsible for the feedback pressure pulses that lock the leading-edge shedding in the unforced case, will be strongest at forcing frequencies matching the preferred natural shedding. Large changes in base pressure coefficient, being representative of the strength of trailing-edge shedding, were observed as the Stp was varied. Peak values of base suction were measured for all c/t ratios tested, however, the Stp at which peak values occurred showed a strong dependence on c/t ratio. They occurred at an Stp that closely matched the natural ILEV shedding St measured by Nakamura et al. (1991) and predicted by Hourigan et al. (2001). This suggested that peaks in base suction occurred when L vortices passed the trailing edge at the same critical phase in the perturbation cycle to allow strong trailing-edge shedding, regardless of c/t ratio. Also of note is that this stepwise variation occurred in forced flows for Reynolds numbers significantly greater than the limit of 2000 for the occurrence in natural shedding. The preference of the flow to shed trailing-edge vortices at peak base drag would explain why there is similar stepwise frequency variation of vortex shedding, peak base pressure coefficient and peak sound pressure level in the natural shedding case, the forced case and the acoustic resonance case, respectively. R. M. acknowledges the support of an Australian Post Graduate Scholarship and use of the facilities at the CSIRO Division of Building, Construction and Engineering. Anonymous referees are thanked for their comments, which significantly improved the paper. REFERENCES Bearman, P. W. 1965 Investigation of the flow behind a two-dimensional model with a blunt trailing edge and fitted with splitter plates. J. Fluid Mech. 21, 241–255. Bearman, P. W. & Trueman, D. M. 1972 An investigation into the flow around rectangular cylinders. Aeronaut. Q. 23, 229–237. Cooper, P. I., Sheridan, J. C. & Flood, G. J. 1986 The effects of sound on forced convection over a flat plate. Intl J. Heat Fluid Flow 7, 61–68. Corke, T., Koga, D., Drubka, R. & Nagib, H. 1977 A new technique for introducing controlled sheets of smoke streaklines in wind tunnels. ICIASF’77 Record, pp. 74–80. Fage, A. & Johansen, F. C. 1927 On the flow of air behind an inclined flat plate of infinite span. ARC R&M, 1104. Hillier, R. & Cherry, N. J. 1981 The effects of stream turbulence on separation bubbles. J. Wind Engng Indust. Aero. 8, 49–58. Hourigan, K., Mills, R. H., Thompson, M. C., Sheridan, J., Dilin, P. & Welsh, M. C. 1993 Base pressure coefficients for flows around rectangular plates. J. Wind Engng Indust. Aero. 49, 311–318. Hourigan, K., Thompson, M. C. & Tan, B. T. 2001 Self-sustained oscillations in flows around long blunt plates. J. Fluids Struct. 15, 387–398. Kiya, M. & Sasaki, K. 1983 Structure of a turbulent separation bubble. J. Fluid Mech. 137, 83–113. Knisely, C., Matsumoto, M. & Menacher, F. 1986 Rectangular cylinders in flows with harmonic perturbations. J. Hydraul. Engng 112, 690–704. Michel, U. & Eroebel, E. 1988 Lower limit for the velocity fluctuation level in wind tunnels. Exps. Fluids 6, 45–54. Mills, R. H. 1998 Vortex interaction in flows over bluff bodies. PhD thesis, Monash University. Nakaguchi, H., Hashimoto, K. & Muto, S. 1968 An experimental study on aerodynamic drag of rectangular cylinders. J. Japan Soc. Aeronaut. Space Sci. 16, 1–5. Nakamura, Y. & Nakashima, M. 1986 Vortex excitation of prisms with elongated rectangular, H and ` cross-sections. J. Fluid Mech. 163, 149–169. Nakamura, Y., Ohya, Y. & Tsuruta, H. 1991 Experiments on vortex shedding from flat plates with square leading and trailing edges. J. Fluid Mech. 222, 437–447.
Response of base suction and vortex shedding to transverse forcing
49
Naudascher, E. & Rockwell, D. 1994 Flow Induced Vibrations – An Engineering Guide. A. A. Balkema. Ohya, Y., Nakamura, Y., Ozono, S., Tsuruta, H. & Nakayama, R. 1992 A numerical study of vortex shedding from flat plates. J. Fluid Mech. 236, 445–460. Parker, R. 1966 Resonance effects in wake shedding from parallel plates: some experimental observations. J. Sound Vib. 4, 62–72. Parker, R. 1967 Resonance in wake shedding from parallel plates: calculation of resonant frequencies. J. Sound Vib. 5, 332–343. Parker, R. 1997 Aeroacoustics. Intl J. Fluid Dyn. (http://elecpress.monash.edu.au/IJFD), 1, Article 1. Parker, R. & Welsh, M. C. 1983 Effects of sound on flow separation from blunt flat plates. Intl J. Heat Fluid Flow 4, 113–128. Ram, H. S. G. & Arakeri, V. H. 1990 Studies on unsteady pressure fields in the region of separating and reattaching flows. Trans. ASME I: J. Fluids Engng 112, 402–408. Rockwell, D. & Naudascher, E. 1978 Review – self sustaining oscillations of flow past cavities, Trans. ASME I: J. Fluids Engng 100, 152–165. Saathoff, P. J. & Melbourne, W. H. 1997 Effects of free-stream turbulence on surface pressure fluctuations in a separation bubble. J. Fluid Mech. 337, 1–24. Sigurdson, L. W. & Roshko, A. 1985 Controlled unsteady excitation of a reattaching flow. AIAA Shear Flow Control Conf. AIAA-85-0552. Soria, J., Sheridan, M. & Wu, J. 1993 Spatial evolution of the separated shear layer from a square leading-edge plate. J. Wind Engng Indust. Aerodyn. 49, 237–246. Stansby, P. K. 1976 Base pressure of oscillating cylinders. Proc. ASCE J. Engng. Mech. 102, 591–600. Stokes, A. N. & Welsh, M. C. 1986 Flow-resonant sound interaction in a duct containing a plate; Part II: Square leading edge. J. Sound Vib. 104, 55–73. Tan, B. T., Thompson, M. C. & Hourigan, K. 1998 Flow around long rectangular plates under cross flow perturbations. Intl J. Fluid Dyn. (http://elecpress.monash.edu.au/IJFD) 2, Article 1. Welsh, M. C. & Gibson, D. C. 1979 Interaction of induced sound with flow past a square leading edge plate in a duct. J. Sound Vib. 67, 501–511.