Tectonophysics 693 (2016) 474–488
Contents lists available at ScienceDirect
Tectonophysics journal homepage: www.elsevier.com/locate/tecto
Response of deformation patterns to reorganization of the southern San Andreas fault system since ca. 1.5 Ma Laura A. Fattaruso a,⁎, Michele L. Cooke a, Rebecca J. Dorsey b, Bernard A. Housen c a b c
Geoscience Dept., University of Massachusetts, 611 North Pleasant St., Amherst, MA 01003, United States Department of Geological Sciences, 1272 University of Oregon, Eugene, OR 97403, United States Geology Dept., Western Washington University, 516 High Street, Bellingham, WA 98225, United States
a r t i c l e
i n f o
Article history: Received 30 August 2015 Received in revised form 1 April 2016 Accepted 20 May 2016 Available online 22 May 2016 Keywords: San Andreas fault San Jacinto fault West Salton detachment fault Numerical modeling Deformation modeling Fault zone evolution
a b s t r a c t Between ~1.5 and 1.1 Ma, the southern San Andreas fault system underwent a major reorganization that included initiation of the San Jacinto fault zone and termination of slip on the extensional West Salton detachment fault. The southern San Andreas fault itself has also evolved since this time, with several shifts in activity among fault strands within San Gorgonio Pass. We use three-dimensional mechanical Boundary Element Method models to investigate the impact of these changes to the fault network on deformation patterns. A series of snapshot models of the succession of active fault geometries explore the role of fault interaction and tectonic loading in abandonment of the West Salton detachment fault, initiation of the San Jacinto fault zone, and shifts in activity of the San Andreas fault. Interpreted changes to uplift patterns are well matched by model results. These results support the idea that initiation and growth of the San Jacinto fault zone led to increased uplift rates in the San Gabriel Mountains and decreased uplift rates in the San Bernardino Mountains. Comparison of model results for vertical-axis rotation to data from paleomagnetic studies reveals a good match to local rotation patterns in the Mecca Hills and Borrego Badlands. We explore the mechanical efficiency at each step in the modeled fault evolution, and find an overall trend toward increased efficiency through time. Strain energy density patterns are used to identify regions of incipient faulting, and support the notion of north-to-south propagation of the San Jacinto fault during its initiation. © 2016 Elsevier B.V. All rights reserved.
1. Introduction The southern San Andreas fault (SAF) system is an intricate network of faults that define the Pacific–North America plate boundary in southern California (Fig. 1). Shear within transform plate boundaries is most efficiently accommodated by strike-slip on straight vertical faults such as the Cholame–Carrizo segment of the central SAF. In regions of complex fault geometries, such as the restraining bend in San Gorgonio Pass (Fig. 1), the inefficiency of the fault geometry to accommodate relative plate motion may drive initiation of new faults with more efficient configuration (e.g. Cooke et al., 2013; Hatem et al., 2015). Previous research has proposed that this process may have caused abandonment of the curved Mission Creek strand of the SAF in favor of the Mill Creek strand at ~500 ka (Matti et al., 1992; Matti and Morton, 1993). In addition to growth of new faults to improve a fault system's efficiency, the interaction of nearby faults may also act to
Abbreviations: BEM, Boundary Element Method; CFM, Community Fault Model; ECSZ, Eastern California Shear Zone; SAF, San Andreas fault; SED, strain energy density; SJFZ, San Jacinto fault zone; WSDF, West Salton detachment fault. ⁎ Corresponding author. E-mail address:
[email protected] (L.A. Fattaruso).
http://dx.doi.org/10.1016/j.tecto.2016.05.035 0040-1951/© 2016 Elsevier B.V. All rights reserved.
distort formerly efficient structures. For example, left-lateral slip on the Pinto Mountain fault is proposed to have distorted the active SAF to create the restraining bend in San Gorgonio Pass (Matti et al., 1992; Yule and Sieh, 2003; Kendrick et al., 2015). The combination of new fault growth and distortion of fault geometry by fault interaction can lead to cycles of deformation that result in a complex active fault network such as the one seen today in San Gorgonio Pass (e.g. Matti and Morton, 1993; Morton and Matti, 1993). A major event in the tectonic evolution of southern California was initiation of the San Jacinto and Elsinore faults, which terminated slip on the older extensional West Salton detachment fault (WSDF) and currently accommodate a significant fraction of plate motion west of the southern SAF (Fig. 1; e.g. Morton and Matti, 1993; Janecke et al., 2010; Dorsey et al., 2012). Geologic and stratigraphic studies show that the San Jacinto and Elsinore faults initiated around 1.1–1.5 Ma (Morton and Matti, 1993; Matti and Morton, 1993; Lutz et al., 2006; Kirby et al., 2007; Janecke et al., 2010; Dorsey et al., 2012), but the underlying causes of this major fault reorganization remain poorly understood. Previous studies have inferred that the currently active strike-slip faults formed as a result of oblique convergence, transpressive deformation and increased resistance to strike-slip motion through the San Gorgonio Pass restraining bend (Matti et al., 1992; Matti and Morton, 1993;
475
L.A. Fattaruso et al. / Tectonophysics 693 (2016) 474–488
34.5˚
SA
F-
NF
sb
T
SGM
SBM
ult Ma dre fa
Sie rra
ECSZ
34.0˚
PMF
SGB
SAF-
SBB CHF
YRB
mill
SA F SA - mc Fb SGPFZ SA F- g SJM h Sa n fa Ja ul ci t z nt on o e
STB
BCF
?
?
CA
no
re
33.5˚
fa
SA
F-
SR M
ul
t
F PC
si
WSDF Salton Sea
zo
ne
N
20
40 km
117˚
BBCF
F
Z
SF
study area
0
MH
cv y
EF
El
WSDF C CF
116.5˚
116˚
Fig. 1. Map of study region. Inset shows location within California. Abbreviations: BB, Borrego Badlands; BCF, Blue Cut fault; CCF, Coyote Creek fault; CF, Clark fault; CHF, Crafton Hills fault; ECSZ, Eastern California Shear Zone; EFZ, Extra fault zone; MH, Mecca Hills; NFT, North Frontal Thrust; PCF, Painted Canyon fault; PMF, Pinto Mountain fault; SAF, San Andreas fault (b, Banning; cv, Coachella Valley; gh, Garnet Hill; mc, Mission Creek; mill, Mill Creek; sb, San Bernardino); SBB, San Bernardino basin; SBM, San Bernardino Mtns; SFF, San Felipe fault; SGB, San Gorgonio block; SGK, San Gorgonio Knot; SGM, San Gabriel Mtns; SGPFZ, San Gorgonio Pass fault zone; SJM, San Jacinto Mtns; SRM, Santa Rosa Mtns; STB, San Timoteo Badlands; WSDF, West Salton detachment fault; YRB, Yucaipa Ridge block. Compiled from Jennings (1977), Matti et al. (1992), Powell (1993), Axen and Fletcher (1998) and Janecke et al. (2010).
by Cooke and Dair (2011) used a series of models to explore changes in uplift/subsidence patterns, slip rate, and efficiency of the fault system through the San Gorgonio Pass region as active fault geometry changed over the past ~ 1 Ma. This study expands on that work by utilizing a more refined fault geometry (Herbert and Cooke, 2012; Fattaruso et al., 2014), exploring a larger area, and by incorporating an earlier major change in fault configuration in the region: the shift from oblique extension on the WSDF to dextral-wrench deformation in the San Jacinto fault zone (SJFZ). Following Cooke and Dair (2011), we use slip rates, uplift/subsidence patterns, and mechanical efficiency to improve our understanding of the deformational response of the system to changes in fault geometry, and the mechanical implications of those changes. We also investigate model results for vertical-axis rotation patterns, tectonic work, and strain energy density distributions. Comparing the change
Morton and Matti, 1993; Langenheim et al., 2005). Three-dimensional (3-D) mechanical models that incorporate changes in fault geometry and tectonic loading offer a tool with which to understand interactions of fault geometry, tectonic loading, and crustal deformation, to improve our understanding of the geologic history and illuminate the response of deformation within the fault system to changes in fault-zone geometry through time. In this study, we explore a series of Boundary Element Method models that simulate deformation at snapshots in time through the evolution of the SAF system in southern California since ~1.5 Ma (Fig. 2). Fault geometry through time is approximated using reconstructions of paleo-fault traces and incorporating evidence from geologic studies that constrain the duration and magnitude of active slip on various structures in southern California (e.g., Matti et al., 1992; Morton and Matti, 1993; Janecke et al., 2010; Dorsey et al., 2012). A previous study
(a) SGM SMF
(b) SGM
SBM
SMF
SGK
MH
SA
F
SRM
MH
SMF
SBB
SBM BF GH
F
CV SA
F
SRM
MH
0.5 - 0.1 Ma Mill Creek fault active San Gorgonio Pass Thrust initiates
CV SA
F
MH
0.1 Ma - present SRM San Gorgonio Pass Thrust Banning fault Garnet Hill fault F
~1.1 - 0.5 Ma San Jacinto Fault Mission Creek fault active
SA
SGM
SBM SBB Mill ck STB SGPT
F
F
~1.3 Ma San Jacinto fault initiates from North?
CV F
> 1.3 Ma Active West Salton detachment
MH
SMF
SJ
F
SGM
SBM SBB MCF STB SGK
(e)
SJ
SA
SMF
(d)
SJ
F
F
SD
SGM
SBM SBB STB SGK SJ
W
(c)
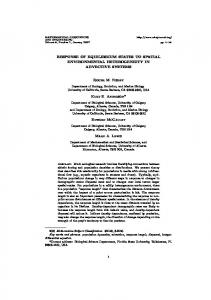
Fig. 2. Timeline of Study. Fault trace maps for 5 snapshots in time modeled in this study. Faults which will be deactivated in the next timestep are highlighted in red, and new faults are highlighted in green. (a) Pre-1.3 Ma fault geometry with active West Salton detachment (b) ~1.3 Ma fault geometry with West Salton detachment removed from model and northernmost strand of San Jacinto fault (SJF) introduced to simulate north-to-south initiation of SJF (c) ~1.1–0.5 Ma fault geometry with entire SJF and Mission Creek fault (red) geometry through restraining bend (d) 0.5–0.2 Ma fault geometry with straight Mill Creek fault through bend and initiation of sawtooth-shaped San Gorgonio Thrust fault (e) 0.12 Ma–present day fault geometry with subparallel Banning and Garnet Hill fault strands through the bend. Abbreviations: MH — Mecca Hills; SAF — San Andreas fault; SBM — San Bernardino Mtns; SGK — San Gorgonio Knot; SGM — San Gabriel Mtns; SMF — Sierra Madre fault; WSDF — West Salton detachment fault; SBB — San Bernardino basin; SJF — San Jacinto fault; STB — San Timoteo basin; CV — Coachella Valley; MCF — Mission Creek fault; SRM — Santa Rosa Mtns; BF — Banning fault; GHF — Garnet Hill fault (Dorsey et al., 2012; Matti et al., 1992; Matti and Morton, 1993; Yule and Sieh, 2003).
476
L.A. Fattaruso et al. / Tectonophysics 693 (2016) 474–488
Here we briefly summarize the evolution of the southern San Andreas fault system in southern California, as determined from geologic studies. We also provide an overview of the uplift/subsidence history and paleomagnetic vertical-axis rotations, which can be compared to model results for changes to uplift/subsidence patterns and verticalaxis rotation patterns resulting from changes to fault geometry.
2003). The Mission Creek strand of the SAF was the dominant strand through most of Pliocene time. This north-dipping strand forms a sharply curved, steeply dipping (60–70°) restraining bend, possibly formed over time by interaction with the left-lateral Pinto Mountain fault to the east (Matti et al., 1992; Matti and Morton, 1993). The formation and accentuation of this restraining bend between ~ 2.5 and 1.2 Ma may have promoted initiation of the SJFZ (Matti and Morton, 1993). At ~ 500 ka, the Mission Creek strand was abandoned in favor of the straighter, vertical Mill Creek strand of the SAF (Matti et al., 1992; Matti and Morton, 1993). From 500 to ~ 100 ka the Mill Creek strand accommodated 7.1–8.7 km of dextral offset (Kendrick et al., 2015). At about 100 ka, fault activity shifted to the present day fault geometry, which consists of the subparallel north-dipping Banning and Garnet Hill strands, with recent activity on the Mill Creek strand limited to a northwestern section near the San Bernardino segment (Fig. 2e; Yule and Sieh, 2003). Additionally, during Quaternary time, subsequent to the shift from Mission Creek to Mill Creek strand geometry, the sawtooth-shaped San Gorgonio Pass Thrust fault zone formed to accommodate oblique shortening and uplift caused by the restraining bend to the north (Fig. 1) (Matti et al., 1992; Matti and Morton, 1993). Today, relative plate motion in southern California is partitioned among many active faults, with the San Andreas and San Jacinto faults taking up most of the displacement across the plate boundary (Fig. 1; e.g. Fialko, 2006).
2.1. Fault zone evolution — ~6 Ma to present day
2.2. Geologic constraints on uplift/subsidence
The southern SAF system today consists of three major active fault zones: the Coachella Valley segment of the SAF, the SJFZ, and the Elsinore fault zone (Fig. 1). These active strike–slip fault zones crosscut and post-date the older and once-continuous WSDF. The WSDF is a low-angle extensional or transtensional detachment fault that was active along the west margin of the Salton Trough from late Miocene or early Pliocene time until ca. 1.1–1.3 Ma (Fig. 1; Axen and Fletcher, 1998; Kairouz, 2005; Steely, 2006; Shirvell et al., 2009; Dorsey et al., 2011, 2012). Late Miocene(?) to early Pleistocene transtension in the Salton Trough was accommodated by combined top-to-the-east or southeast extension on the WSDF and dextral offset on the southern SAF (Fig. 3a) (e.g., Axen and Fletcher, 1998; Dorsey et al., 2011, 2012). Thermochronologic data show that the WSDF accommodated a minimum of 8–10 km of horizontal extension over its lifespan (Shirvell et al., 2009). It is worth noting that estimates of extension using thermochronologic data rely on assumptions about fault geometry, and are therefore approximate. Apatite (U–Th)/He data record rapid cooling and exhumation of the footwall due to slip on the WSDF between roughly 6 and 2 Ma (Shirvell et al., 2009). The Salton Trough and northern Peninsular Ranges underwent a major tectonic reorganization at ~ 1.5–1.1 Ma, when the San Jacinto, San Felipe and Elsinore faults were initiated, and slip on the WSDF ended (Fig. 3B; Morton and Matti, 1993; Matti and Morton, 1993; Lutz et al., 2006; Kirby et al., 2007; Steely et al., 2009; Janecke et al., 2010; Dorsey et al., 2012). The SJFZ may have initiated slightly earlier in the north (~ 1.5–1.3 Ma) than in the south (1.3–1.1 Ma), in which case it may have propagated from northwest to southeast during its initiation (Janecke et al., 2010; Dorsey et al., 2012). Alternative age estimates of ca. 1.8–3.0 Ma for the SJFZ rely on extrapolation of late Pleistocene slip rates back in time (e.g. Sharp, 1981; Rockwell et al., 1990; Blisniuk et al., 2010) and are considered here to be less robust than abundant geologic and stratigraphic evidence for an age of ca. 1.5–1.1 Ma. Since becoming inactive, the WSDF has been structurally dissected, deformed, and offset by the younger active strike-slip faults (Janecke et al., 2010; Dorsey et al., 2012). The geometry of the San Andreas fault zone is complex where it passes through San Gorgonio Pass, and the active trace of the SAF in the San Gorgonio Pass has shifted multiple times during Pleistocene time (e.g. Matti et al., 1992; Matti and Morton, 1993; Yule and Sieh,
During Pliocene–Pleistocene regional transtension in the Salton Trough, a large supradetachment basin formed and subsided in the hanging wall of the WSDF (Fig. 3) (Dorsey et al., 2011, 2012). Termination of slip on the WSDF and initiation of the currently active strike-slip faults resulted in large-scale basin inversion and a change from subsidence to uplift of the basin. This regional change in vertical motions was accompanied by onset of dextral-wrench faulting, folding, and crustal rotations over large area west of the Salton Sea (e.g. Kirby et al., 2007; Janecke et al., 2010). Initiation of the SJFZ was accompanied by pronounced changes in vertical crustal motions in the southern SAF system. Abrupt acceleration of uplift in the western San Gabriel Mountains is attributed to initiation and acceleration of slip on the SJFZ (Morton and Matti, 1993; DiBiase et al., 2015). The onset of rapid subsidence in the San Bernardino basin between the SAF and SJF, northwest of the Crafton Hills fault (Fig. 1), is also interpreted to correspond to initiation of the SJFZ (Morton and Matti, 1993; Anderson et al., 2004). The San Timoteo Badlands, just south of the Crafton Hills fault, record deposition for several million years until 1 ± 0.3 Ma, when subsidence slowed and inversion of the basin led to uplift and erosion of nonmarine sedimentary deposits (Hehn et al., 1996; Morton and Matti, 1993; Albright, 1999). Kendrick et al. (2002) document uplift in the San Timoteo Badlands at rates of 0.34–0.83 m/ka over the past 100 ka. Lastly, active uplift and northeast tilting in the southern Santa Rosa Mountains is attributed to post-detachment oblique convergence across the southern SAF and large vertical displacement on strands of the San Jacinto fault zone (Dorsey and Langenheim, 2015). Several areas along the SAF record uplift through time. The San Bernardino Mountains experienced rapid uplift during slip on the Mission Creek strand of the SAF, with a subsequent reduction in uplift rate in the northern San Bernardino Mountains with the transfer of slip to straighter and more vertical structures through San Gorgonio Pass (e.g. Meisling and Weldon, 1989; Matti et al., 1992; Binnie et al., 2008; Spotila et al., 2001). Meisling and Weldon (1989) document uplift of the northwestern San Bernardino Mountains since ~ 2–1.5 Ma, and Spotila et al. (2001) document 3–6 km of uplift on the Yucaipa Ridge block (Fig. 1) in the southern San Bernardino Mountains since 1.8 Ma. Southeast of San Gorgonio Pass, ongoing asymmetric subsidence is indicated by an increase in sediment thickness northeast across the Coachella Valley towards the SAF (Fig. 1; Langenheim et al., 2005;
in tectonic work between different models provides a measure of the relative mechanical efficiency of each fault configuration. Strain energy density patterns serve to identify regions prone to incipient faulting, and provide a spatially distributed measure of the relative mechanical efficiency of fault system. The spatial and temporal variations in vertical-axis rotation obtained from this model can be compared to rates measured from paleomagnetic results in several regions within our study area, and can also be contrasted with spatial variations in rotation or rotation rates estimated by other models (McCaffrey, 2005; Bos and Spakman, 2005) that use more simple fault geometry and invert for block deformation using modern GPS displacement fields. By exploring how changes to boundary loading and fault geometry affect the distribution and style of deformation, we can assess whether or not our current understanding of the evolution of the southern San Andreas fault system is consistent with the geologic data available. 2. Geologic and tectonic background
477
L.A. Fattaruso et al. / Tectonophysics 693 (2016) 474–488
(a)
DF
future strikeslip faults
s
W
F SA
lar
S
ge
n Ra
N
u ins
n
Pe
c Pl ific at e
cr
ys
ta
rth No rica e Am
t
en
Pa
hm ac n t e i ad bas r p
FCVB
su
lli
ne
ns h siooug u r r t in n T ic o at Salt m ag th m nea be
ba
se
m
en
Pre-1.3 Ma
t
Sa
(b)
nJ . ac
SA
. F.Z
r ino
SF F
F.
e
fic
llin
e
Pl
ba
at
se
e
F F CM
ys ta
CF
F
CC
ci
F
WSDF
FCVB
Pa
cr
E ls
lar su n i n es Pe ang R
. dim se sin ba ill f
NE
rth ca No eri Am
WSDF
m
en t
Present day Fig. 3. Block diagrams of ca. 1.1–1.3 Ma fault reorganization in southern California. (a) Oblique view of West Salton detachment fault subsurface geometry relative to the San Andreas fault. Future location of San Jacinto and Elsinore faults shown as dashed lines. (b) Oblique view of sub-parallel strike-slip faults active today with displaced remnants of West Salton detachment fault shown in red. Abbreviations: CF, Clark fault; CCF, Coyote Creek fault; FCMF, Fish Creek Mountain fault; FCVB, Fish Creek–Vallecito basin; SAF, San Andreas fault; SJF, San Jacinto fault; SFF, San Felipe fault; WSDF, West Salton detachment fault. Modified from Dorsey et al. (2012).
Dorsey and Langenheim, 2015). These observations provide evidence for vertical crustal motions that can be used for comparison to patterns predicted by our suite of model results. 2.3. Vertical-axis rotation from paleomagnetic studies Several paleomagnetic studies provide evidence for vertical-axis rotations in fault bound blocks located in the San Timoteo Badlands, Borrego Badlands, and Mecca Hills (Lutz et al., 2006; Housen and Dorsey, 2010; Albright, 1999; Chang et al., 1987; Housen et al., 2013). Albright (1999) and Hehn et al. (1996) documented 5–10° CCW rotation in ~ 1 to 6.3 Ma strata of the San Timoteo Badlands. In the Mecca Hills, Housen et al. (2013) observe 3–5° of CW rotation northeast of the Painted Canyon fault since ~1 Ma, and 3–8° of CCW rotation between the Painted Canyon
fault and SAF, since ~1–2 Ma. In the Borrego Badlands, rotations are spatially variable, with differing estimates of rotation in the northwest versus southeast portions of this block. Lutz et al. (2006) documented essentially zero CW rotation (0° ± 8°) since ~1 Ma in the northwestern Borrego Badlands, while Housen and Dorsey (2010) document significant CW rotation (30–40°) in the SE portion of the Borrego Badlands in strata that range in age from ~1 to 4.5 Ma. A consistent feature of these spatially diverse datasets is that sections such as the Borrego Badlands and San Timoteo Badlands, which include strata N3.5 Ma in age, do not show significant variations in the amount of vertical-axis rotation as a function of age, indicating that these rotations occurred after deposition of the youngest portions of these sections. This consistency indicates that the rotations have occurred primarily during dextral deformation over the past 1–2 Ma.
478
L.A. Fattaruso et al. / Tectonophysics 693 (2016) 474–488
3. Modeling methods We use the three-dimensional Boundary Element Method (BEM) code Poly3D, which solves the governing equations of deformation using continuum mechanics (e.g. Crouch and Starfield, 1990; Thomas, 1993). Fault geometries for the model of the present day are based on fault surfaces from the Southern California Earthquake Center's Community Fault Model (CFM), which are compiled from geologic mapping, seismicity, and geophysical data (Plesch et al., 2007). Refinements to CFM Version 4 fault geometry that improve match to geologic slip rates and uplift patterns are also included in our models (Herbert and Cooke, 2012; Fattaruso et al., 2014). Within the model, three-dimensional fault surfaces are discretized into triangular elements, each with constant slip and zero opening, within a linear-elastic and homogeneous material (Fig. 4). The triangular elements of these BEM models are particularly well suited for modeling the complex fault network of southern California because branching and curving fault surfaces with incomplete intersections can be simulated without compromising the accuracy of the results. The elastic nature of the host rock limits the simulation to strain accumulation b1%. Consequently, the results do not accurately represent deformation over long time scales because inelastic processes within the crust (e.g., microcracking, calcite twinning, pressure solution) are not captured by elastic modeling. Rather than simulating the continuous development of the fault system, we simulate snapshots of deformation at key stages in the evolution of the fault system (Fig. 2). As with previous investigations of uplift pattern (Meigs et al., 2008; Fattaruso et al., 2014), we compare the pattern of uplift from these models to the geologic patterns documented in geologic studies, and are not concerned with matching absolute uplift rates because inelastic processes not modeled here may impact these rates. Previous Poly3D models have refined our understanding of the geometry of active faulting in southern California by comparing the alternative viable fault model results to uplift patterns (Meigs et al., 2008; Cooke and Dair, 2011; Fattaruso et al., 2014) and fault slip rates (e.g. Marshall et al., 2008; Cooke and Dair, 2011; Herbert and Cooke,
2012). Furthermore, BEM investigations of alternative fault configurations (e.g. Griffith and Cooke, 2004; Marshall et al., 2008; Meigs et al., 2008; Dair and Cooke, 2009; Herbert et al., 2014; Fattaruso et al., 2014) demonstrate that the three-dimensional fault geometry and connectivity exhibit first-order effects on the partitioning of deformation within these fault systems, including uplift and strain energy density (SED) patterns (Griffith and Cooke, 2004; Meigs et al., 2008; Cooke and Dair, 2011). Consequently, we expect that changes in fault geometry through time exert a substantial influence on uplift and SED patterns within the region. The fault model of southern California extends from the Salton Sea past the intersection of the SAF with the Garlock fault in the north and includes faults of the Eastern California Shear Zone (ECSZ) and the SJFZ. The geometry representing the evolution of the SAF through the San Gorgonio Pass over the past 1 Ma follows that used by Cooke and Dair (2011) and the CFM. Because it is not currently active, the WSDF is not provided within the CFM. To represent this fault in the model, we extrapolate the fault surface from maps and cross-sections that reconstruct the geometry of the fault during the time of its activity (Dorsey et al., 2012). We extend the listric detachment N30 km east of the San Andreas and have it shallowing into the base of the seismogenic crust at between 9 and 12 km depths. All other non-listric fault surfaces in the model extend to the freely-slipping base of the model at 35 km depth to simulate distributed deformation below the seismogenic crust (Fig. 4). Although we are concerned with discrete fault surfaces only to the base of the seismogenic crust (between 10 and 15 km), deformation does not cease below the seismogenic crust, so we extend the faults in the model to greater depth to avoid artificially limiting fault slip at the base of the faults. Faults within the model are frictionless, simulating the low frictional slip conditions that arise during earthquakes. Permanent slip along the faults accrues during these earthquake events. We apply plate boundary velocities along the base of the models far from the investigated faults so that the interior portions of the model base and all faults are free to slip and interact without prescribed rates of slip (Fig. 4). Consequently, the faults slip in response to a combination
North
v θ
−v
Gar
35 mm/yr SAF
Pac ific P late
lock
ECSZ Nort hA
5m
me ric an Pla te
m/
yr
WSDF
SAF 35 mm/yr
Fig. 4. Oblique view of the model setup and fault surfaces. Faults are discretized into triangular mesh as shown along northern section of San Andreas fault (SAF). Half the plate motion (v) is applied to the southwest and northeast edges of the model. Applied plate motion decreases stepwise towards the center of the model along the northwest and southeast edges as indicated by arrows. Blue arrows represent Pacific Plate motion, red arrows represent North American Plate motion, and green arrows represent component of E–W extension applied for the model with transtensional boundary conditions. Where faults extend outside the boundary of the model, we prescribe slip rates along edge faults. Abbreviations: ECSZ — Eastern California Shear Zone; WSDF — West Salton detachment fault. Fault surfaces are modified from SCEC Community Fault Model (Plesch et al., 2007).
L.A. Fattaruso et al. / Tectonophysics 693 (2016) 474–488
of tectonic loading and interaction with one another. For models that simulate faulting after the cessation of extension (b 2 Ma), we apply overall right-lateral shear consistent with present-day observations of plate rate. For the model with active slip along the WSDF within regional transtension, we apply modern strike-slip boundary velocities plus east–west extension velocities along the boundaries that are representative of modern extensive environments. Because we do not have relative plate motion to constrain the extensional velocities during slip on the WSDF, we apply velocities based on geodetic observations in modern analogs to the detachment system. Modern rifts have a wide range of extension rates, from 11 mm/yr across the southern Salton trough (Crowell et al., 2013), up to 30 mm/yr of extension in western Turkey (Aktug et al., 2009). Slip rates for the WSDF increased with application of extension from 10 to 30 mm/yr. All the tested models produce dip-slip rates within the geologic range of 2.3–5 mm/yr between roughly 6–7(?) and ~1.2 Ma, during the period of active extensional slip on the WSDF (Shirvell et al., 2009; Dorsey et al., 2011). For models with active extension on the WSDF, we superpose a mid range rate 20 mm/yr of East–West divergent velocities onto the modern strike-slip tectonic boundary velocities. With this boundary loading, model surface dip-slip rates of 2.9 ± 0.7 mm/yr on the WSDF match slip rates constrained by Shirvell et al. (2009). For the post-extension WSDF models we follow Herbert and Cooke (2012) and use boundary velocities and orientations constrained by GPS studies and global plate motion models that estimate plate motion of ~45–50 mm/yr at orientations between 320° and 325° (e.g. DeMets et al., 2010). For simplicity, and because variations in tectonic loading do not alter first-order uplift patterns (Herbert and Cooke, 2012), we run all of the models presented here with tectonic loading of 50 mm/yr at 320°. These models do not include any faults west of the SJFZ, which are estimated to accommodate ~ 5 mm/yr of the plate motion (e.g. Platt and Becker, 2010), so we subtract this velocity from the net velocity applied to the models. Where the SAF and SJFZ extend outside the model boundaries, we apply slip rates on edge patches of the faults. This includes a rightlateral rate of 35 mm/yr strike-slip along the central segment of the SAF at the northern edge of the models (Weldon and Sieh, 1985). For models predating the initiation of the SJFZ, all 35 mm/yr is applied to the SAF at the southeast edge of the model. For models with both the San Jacinto and San Andreas faults, slip is partitioned on the southeast edge of the model between the faults equally. Fattaruso et al. (2014) and Herbert and Cooke (2012) demonstrated that partitioning of strike-slip on the San Jacinto and San Andreas faults at the southern edge of the model has little impact on strike-slip rates north of the Salton Sea where fault geometry governs the partitioning of slip among faults. We also prescribed 5 mm/yr of normal dip-slip at the basal edges of the WSDF to simulate processes at depth that drive this low angle detachment. The location and shape of faults, and the location of landforms shift with ongoing strike-slip along faults. Precisely re-locating and reconstructing paleo-fault geometries is beyond the scope of this study, and errors in our reconstruction limit the precision with which comparison can be made between observations and the results of our models of paleo-fault configurations. To the first order, these snapshot models allow us to understand the mechanical interaction of faults in their reasonably reconstructed configurations. From this we can identify regions in which models appear to match geologic observations, as well as identify mismatches that might aid us in identifying gaps in our understanding of the fault system's evolution and interaction with the landscape. 3.1. Isostatic adjustment We adjust the surface uplift rates produced by the models to account for isostasy using a crustal flexure model of an elastic crust over a
479
viscous mantle. Following Cooke and Dair (2011) and Fattaruso et al. (2014), we use a mantle density of 4100 kg/m3, crustal density of 2700 kg/m3, and a flexural rigidity of the crust of 2 × 10²³ Pa·m3 for our correction. This isostatic correction generally reduces the amplitude and increases the wavelength of the uplift patterns. 3.2. Tectonic work The overall mechanical efficiency of evolving fault systems provides insight into whether active faults adjust to become more efficient (e.g. Cooke and Madden, 2014). One metric for evaluating mechanical efficiency is the external tectonic work applied to a fault system, as more efficient systems will require less work to accommodate the same strain. In less efficient systems, more force is required to achieve the same boundary displacements resulting in greater tectonic work. External tectonic work on a fault system is distributed within the system in many ways, including as internal deformation, frictional heating, uplift against gravity, and seismic release of energy (e.g. Cooke and Murphy, 2004; Cooke and Madden, 2014). Within our elastic models, work applied to the system is all converted to internal deformation, as frictional heating, gravity, seismic energy, and fault propagation are not included in these simulations. In simulations that include the work of friction and gravity, internal work can still account for a large portion of the work budget (Del Castello and Cooke, 2007; Marshall et al., 2010) and thus still provides insight into the efficiency of the fault system. Internal work is the volume integral of strain energy density, the calculation of which is described in the next section. The external work rate is calculated along the boundaries of the model that have applied velocities, as one half of the product of the velocity and the tractions applied to achieve this velocity (e.g. Cooke and Madden, 2014). We integrate the tectonic work rate along the model boundaries to calculate the rate of total work required to deform different fault network configurations at stages of the recent evolution of the southern SAF in order to assess the evolution of the fault system's efficiency. 3.3. Strain energy density Strain energy density (SED) is a measure of the elastic strain stored in the rocks around faults (e.g. Jaeger and Cook, 1976). It measures the mechanical work performed by the rock and is calculated at a point as half the sum of the product of the stress and strain tensor components: ! " SED ¼ 1=2 σ xx εxx þ σ yy εyy þ σ zz εzz þ 2σ xy εxy þ 2σ yz εyz þ 2σ xz εxz :
ð1Þ
The SED, work per unit volume (Timoshenko and Goodier, 1934), can be mapped throughout the model. While SED measures elastic strain, regions of higher elastic strain are also likely to undergo more inelastic strain such as microcracking, and thus SED serves as a tool for identifying regions where incipient faulting is likely (e.g. Du and Aydin, 1993; Okubo and Schultz, 2005; Olson and Cooke, 2005). We explore distributions of SED along horizontal slices at depths of 8 km, within the seismogenic crust in this region. SED values are very high near the edges of the dislocation elements that comprise the faults and as an artifact of the discretization, these local SED concentrations do not necessarily represent regions of high strain accumulation within the host rock. Concentrated stresses at fault tips and kinks are expected, but the discretization of the fault into elements of uniform displacement means that artificial concentrations of stress arise locally at each node between fault elements away from kinks and terminations. The size of these artifacts depends on element size, and so regions of high SED that are larger than the element size are not discretization artifacts and reflect meaningful concentrations of strain (Olson and Cooke, 2005). For this reason, we perform a median filter on the stress data to remove artifacts. To highlight regions
480
L.A. Fattaruso et al. / Tectonophysics 693 (2016) 474–488
of overall high or low SED, we perform an 8 km square moving average filter and only contour the SED values up to 60 mPa/yr. 3.4. Vertical-axis rotation Vertical-axis rotation from the models can be compared with paleomagnetic evidence for block rotations. This dataset has been used before to validate models (e.g. Itoh et al., 2008; Platt and Becker, 2013). Rotations within the modeled velocity field can be determined by taking the curl of the velocity field. We calculate the vertical-axis rotations from each snapshot model. Because our simulations are elastic, rotation rates are significantly higher and more geographically concentrated, especially at fault tips, than is possible in the actual crust. Inelastic deformation within regions of high stress, would act to dissipate stresses and reduce rotation rates. Despite this limitation, first order patterns of rotation sense and magnitude are a valuable metric for comparison of model results to paleomagnetic data. Additionally, vertical-axis rotation expresses the distortional component of the SED field and provides another expression of off-fault deformation. 4. Results 4.1. Uplift/subsidence Model results for patterns of uplift and subsidence are presented chronologically from oldest to most recent snapshots in the evolution of the southern San Andreas fault system. This facilitates comparison to evidence from the stratigraphic and geomorphic record, but also means that results from models with the greatest uncertainty are presented here first. Stratigraphic evidence shows that a large basin formed and subsided in the hanging wall of the WSDF between about 6 or 8 Ma and 1.2 Ma, between the southern Peninsular Ranges and the southern SAF, due to dip-slip on the WSDF (Axen and Fletcher, 1998; Dorsey et al., 2011, 2012). Models with transtensional tectonic boundary conditions simulate the period of extension on the WSDF (Fig. 5a). The model produces basins east of the WSDF and SAF, although a lobe of uplift between the faults contradicts the expectation that extension along the WSDF should produce subsidence across the entire hanging wall (Location 1, Fig. 5a). The area of subsidence could be increased by addition of dip-slip offset on secondary normal faults in the hanging wall of the WSDF. Normal faults of this type, although rarely exposed at the western margin of the Salton Trough, are interpreted to cut the hanging wall of the WSDF near the southern Santa Rosa Mountains (Dorsey and Langenheim, 2015), and seismic studies reveal steeply dipping reflectors in the Coachella basin that may represent similar hanging-wall normal faults (Persaud et al., 2014). We test the impact that hanging-wall normal faults may have on subsidence patterns with an additional model that includes these hypothetical faults (Fig. 6). The addition of two shallow NE dipping (30°) hanging-wall normal faults interrupts the lobe of uplift (Fig. 6a) and produces more subsidence between the WSDF and SAF (Fig. 6b). In the Mecca Hills (Fig. 1), sediments record a shift at ca. 2.5 Ma from subsidence on the Painted Canyon fault (inferred from deposition of the Mecca Conglomerate SW of the Painted Canyon fault), to reverse slip and uplift between the Painted Canyon fault and SAF (McNabb, 2013). This change in the direction of dip-slip motion on the Painted Canyon fault is matched by our model results for snapshots before and after the shift from transtensional to dextral loading (Location 2, Fig. 5a–b), but the documented timing of the change at ~2.5 Ma (McNabb, 2013) does not match our estimate for the timing of that transition ~ 1.5– 1.3 Ma. This change in slip direction may reflect an earlier change in tectonic loading on the SAF that was not related to the cessation of extension in the region. It may also reflect that the time periods represented by these particular snapshots are uncertain, as we can't precisely constrain the timing of the transition from transtensional to dextral
boundary loading in the region. Within the models, this transition is associated with decreased activity along the WSDF. In the snapshot with dextral loading that simulates the change of slip direction on the Painted Canyon fault (Fig. 5b), the WSDF still exhibits dip slip, but this slip decreases from an average rate of 2.55 mm/yr of normal slip with transtensional boundary conditions to 0.02 mm/yr with dextral boundary conditions. Rapid uplift of the San Bernardino Mountains since ~1.7 Ma north of the Mission Creek strand of the SAF (Spotila et al., 2001) is well matched by our models (location 3, Fig. 5a–c). The accumulation of deformation through San Gorgonio Pass at this time is identified as a contributing factor to initiation of the SJFZ (Matti and Morton, 1993; Morton and Matti, 1993). Our models show a reduction of uplift rate in the San Bernardino Mountains (rates of 3–6 mm/yr reducing to 2–4.8 mm/yr) with the introduction of the full length of the SJFZ (location 3, Fig. 5d), indicating that slip on the SJFZ channels some deformation away from the San Bernardino Mountains, although uplift rates remain relatively high. The change of fault geometry from the Mission Creek to Mill Creek fault (Fig. 5d–e) is accompanied by another reduction of uplift rates in the San Bernardino Mountains (rates of 2–4.8 mm/yr reduce to 1–2.4 mm/yr). Several changes in deposition/erosion patterns are linked to initiation of the SJFZ. Model uplift patterns match an observed increase in uplift rates in the eastern San Gabriel Mountains with the onset of slip along the SJFZ (DiBiase et al., 2015) (location 4, Fig. 5b–d). In addition, subsidence in the San Bernardino basin is enhanced with the growth of the SJFZ (location 5, Fig. 5c–d), matching geologic observations (Morton and Matti, 1993; Anderson et al., 2004). The model does not predict full inversion and uplift of the San Timoteo basin, as documented by Kendrick et al. (2002), (location 6, Fig. 5b–e), but subsidence of that basin is significantly reduced during the period of active slip on the Mill Creek strand of the SAF through San Gorgonio Pass (Fig. 5e). This model does not include a small restraining bend in the SJFZ in this region that likely drove uplift (Kendrick et al., 2002), so refinements to fault geometry in this region could potentially improve the match of the model results to uplift data here. Previous modeling studies have demonstrated that models of the present day fault configuration match uplift patterns between the SAF and SJFZ well when incorporating NE-dipping fault geometry for the Coachella Valley segment of the SAF (Fattaruso et al., 2014). Fault geometry used for the present-day model in this study is slightly revised from Fattaruso et al. (2014). In this study the Garlock fault and a larger portion of the Sierra Madre fault are included to improve simulation around those faults, while the Big Bear fault is excluded. Present-day models from both studies provide a good match to both uplift in the Santa Rosa Mountains (location 8, Fig. 5f) and asymmetric subsidence across the Coachella Valley location 7, Fig. 5f), with the highest rate of subsidence and deposition on the northeast side of the valley adjacent to the SAF. The predicted pattern of uplift in the southern Santa Rosa Mountains and asymmetric subsidence in the southern Coachella Valley agrees well with the pattern of northeast crustal tilting documented in this area for the past ca. 1.2 Ma (Dorsey and Langenheim, 2015).
4.2. Work/efficiency Due to the work necessary to grow new fault surfaces through the creation of new cracks, fault systems should only initiate new faults when the active fault surfaces have become inefficient and sufficiently high amounts of strain are transferred into the surrounding rock, leading to incipient faulting (e.g. Cooke and Murphy, 2004; Cooke and Madden, 2014). For this reason, when we see one fault strand abandoned in favor of slip along another, we expect that the new fault geometry has greater mechanical efficiency. Such transitions associated with decreases in external work are documented in accretionary systems (e.g. Del Castello and Cooke, 2007). Therefore, a decreasing external
F
mm/yr
0
degrees/Ma
3
CW
CCW
6
(n)
0
degrees/Ma
3
CW
CCW
6
(o)
0 3
degrees/Ma
3
6
CW
CCW
6
(p)
0
3
degrees/Ma
3
SJ F
k
oc
8
bl
7
n
lto
Sa
CW
6
50 km
6
3
ECSZ
2
SA F
5
3 SJ F
ECSZ
3
CCW
6
(q)
0
degrees/Ma
3
CW
CCW
6
(r)
6
0
SJ F
ECSZ
3
CW
6
50 km
3
degrees/Ma
3
0 20 40 60
6
0
5
13.5 mPa/yr
(l)
-3
mm/yr
0 20 40 60
8
2
SMF
F
mPa/yr
7
SA
4
(f)
~0.1 Ma - present
mPa/yr
3
50 km
6
11.2 mPa/yr
(k)
mm/yr
SMF
4
(e)
~0.5 - ~0.1 Ma
7 8
2
Fig. 5. Uplift/subsidence (a–f), strain energy density (g–l), and vertical-axis rotation (m–r) maps from model simulations. (a–f) Uplift/subsidence maps are corrected for isostacy. Locations for comparison to geologic record are marked: 1 — Borrego Lake; 2 — Mecca Hills; 3 — San Bernardino Mtns; 4 — San Gabriel Mtns; 5 — San Bernardino basin; 6 — San Timoteo basin; 7 — Coachella Valley; 8 — Santa Rosa Mtns. Abbreviations: ECSZ, Eastern California Shear Zone; SAF, San Andreas fault; SJF, San Jacinto fault; SMF, Sierra Madre fault; WSDF, West Salton detachment fault. (g–l) Strain energy density maps at a horizontal slice 8 km deep, in units of mPa/yr, with an 8-km moving average filter. Solid black lines are surface traces of faults, dashed black lines represent fault trace at 8 km depth, and dashed gray lines represent faults not included in model but shown for relative position. (m–r) Vertical-axis rotation rates in °/Ma with clockwise rotation shown in blue and counterclockwise rotation in red. Fault traces with right-lateral slip are shown in blue and fault traces with left-lateral slip are shown in red.
CCW
6
(m)
5
15.0 mPa/yr
(j)
mm/yr
0 20 40 60
8
2
0 20 40 60
6
50 km
7
0 20 40 60
20.0 mPa/yr
(i)
mm/yr
SJ F
4 SMF
F
SA
0 20 40 60
8
2
6
3
(d)
mPa/yr
7
5
ECSZ
mPa/yr
3
50 km
F
SD
W
SMF
F
SA
4
(c)
~1.1 (?) - ~0.5 Ma
mPa/yr
6
1
6
3
ECSZ
~1.3 Ma (?)
mPa/yr
3
8
2
5
20.2 mPa/yr
7
SMF
4
SA F
Median: 26.1 mPa/yr
SD F
W
50 km
6
3
(b)
(h)
5
ECSZ
~1.5-1.3 Ma (?)
(g)
mm/yr
N
SMF
4
SA
(a)
>1.5 Ma (?)
L.A. Fattaruso et al. / Tectonophysics 693 (2016) 474–488 481
482
L.A. Fattaruso et al. / Tectonophysics 693 (2016) 474–488
(a)
(b)
SD
W
SD
F
Uplift (mm/yr)
F SA
F SA
W
F
Uplift (mm/yr)
50 km
Fig. 6. Isostatically adjusted uplift patterns for models of extension with (a) no normal splays and with (b) two normal splays branching from the floor of the detachment. Splay faults reduce uplift between the San Andreas fault (SAF) and West Salton detachment fault (WSDF).
strike-slip
San Jacinto - North
15.5
4.3. Strain energy density
13.5 12.5 11.5 10.5 9.5
>1.5 Ma ~1.3 Ma ~1.1 Ma
0.5 Ma
(~ 4 GJ/yr decrease in tectonic work) accompanies the removal of the WSDF and initiation of the northern section of the SJFZ at ~ 1.3 Ma. The addition of the full extent of the SJFZ produces greater increases in efficiency of the fault system (ΔWork ~ 134 GJ/yr). A pronounced increase in mechanical efficiency accompanies the transition from the Mission Creek and Mill Creek SAF geometries (~ 1289 GJ/yr), consistent with previous studies (Cooke and Dair, 2011). The results of Cooke and Dair (2011) also show a decrease in efficiency with the transition from the Mill Creek geometry to the more complex present day fault configuration. The models of this study show a somewhat smaller ~ 18 GJ/yr decrease in efficiency than the ~23 GJ/yr decrease with the Cooke and Dair (2011) models. Improvements to fault geometry since their study in 2011, such as addition of the Crafton Hills fault and using a dipping geometry for the Banning strand of the SAF, have reduced the change in model efficiency between the Mill Creek time and present day models. For example, the north dip of the Banning strand may facilitate local transpressional uplift more effectively than the vertical strand used in previous models. This is a reassuring result, suggesting that with a better understanding of present-day active faulting, the change from the efficient Mill Creek strand to the more complex present-day fault configuration may not be as mechanically improbable as it had formerly seemed. Kendrick et al. (2015) postulated that slip along the Pinto Mountain fault across the Mill Creek strand disrupted this fault and caused its abandonment. This mechanism may explain why the overall efficiency of the system decreases slightly with the transition to the currently active faults.
14.5
Work (TJ/yr)
transtension
Mill Creek
San Jacinto - full extent
Mission Creek
WSDF
present
work suggests increasing mechanical efficiency of modeled fault systems. The total rate of external work on the model boundaries to deform each snapshot model is plotted on Fig. 7. The abrupt transitions within the mechanical evolution arise because we only model snapshots in time, and cannot capture the evolution of efficiency resulting from continuous changes to fault geometry. Prescribed tectonic velocities along the model boundary are the same for all but the earliest transtensional model, which includes additional east–west velocities applied to the model boundaries to simulate extension as well as a section along the distal edge of the WSDF to simulate the deep mechanisms driving this fault. Because both the applied velocities and fault area are greater in the earliest transtension model, the calculated external work rate, ~ 15.25 TJ/yr far exceeds that of the other models 9.75–11.18 TJ/yr, inhibiting direct comparison (Fig. 7). In order to compare this model to the others, we normalize the total velocity times fault area of this model to that of other models, reducing the rate of net work by 15% to ~12.91 TJ/yr (Fig. 7, solid line). The adjusted external work rate for the transtensional model is still significantly greater than any models with dextral loading (Fig. 7). This suggests that this fault network configuration does not accommodate extension as efficiently as it accommodates dextral slip. Mechanical efficiency increases significantly for the same fault configuration with dextral strike-slip boundary velocities (transition at ~ 1.3 Ma). Only a slight increase in mechanical efficiency
0.1 Ma
Fig. 7. Solid lines represent the external rate of work applied to the model integrated along boundary surfaces with prescribed velocity, in TJ/year. Dashed line for transtensional WSDF model is the value for work before correction is made to account for the greater velocity applied to the boundaries of this model relative to the other models.
While applied tectonic work provides a measure of the overall efficiency of each snapshot model, maps of rate of SED accumulation allow us to explore the spatial distribution of internal work to see which regions in our study area are more or less efficient, and how this changes between models of different time periods. Locally high SED rate indicates regions where deformation is not accommodated efficiently by the faults in the model, and regions with low SED rate reflect greater efficiency. For our first snapshot – the WSDF model with transtensional boundary loading (Fig. 5g) – a large region of high SED rate extends for tens of kilometers in each direction around the Mission Creek strand of the SAF. This matches the expectation for high off-fault deformation around a restraining bend within a strike-slip system (Hatem et al., 2015). SED rate is also high in the region where the northern portion of the SJFZ later grows (dashed line, Fig. 5g). At the future position of the southern portions of the SJFZ, SED rate is lower than to the north. This supports the interpretation that the SJFZ initiated in the north, as faults are more likely to grow in regions of high SED. SED rate is also very high
483
L.A. Fattaruso et al. / Tectonophysics 693 (2016) 474–488
within the Coachella Valley, SW of the secondary faults in the Indio and Mecca Hills. Median SED is much greater for this first snapshot than for any others, reflecting the fact that larger velocities are applied to the boundaries of this model, and also that the fault system is configured to accommodate strike-slip more efficiently than transtension. As tectonic loading on this same fault configuration changes from transtension to dextral strike-slip (Fig. 5h), median SED rate drops from 26.1 mPa/yr to 20.2 mPa/yr, and the distribution of SED changes slightly. SED rate increases slightly in the ECSZ (2–10 mPa/yr increase), while net strike-slip rate across the ECSZ faults decreases (Table 1). Under dextral tectonic loading, off-fault deformation increases within the ECSZ. SED rate remains high in the region of the northern tip of the SJFZ with dextral tectonic loading, but decreases southwest of the Mecca Hills (Fig. 5h). In the next snapshot in time at ~ 1.1 Ma (Fig. 5i), we remove the WSDF from the model and introduce the northernmost portion of the SJFZ. Median SED rate for the entire system does not change significantly, but local SED rate decreases around and to the west of the active SJFZ and increases significantly to the south where the SJFZ is not yet active (dashed line, Fig. 5i). This concentration of SED rate supports continued southward propagation of the new strike-slip fault. With the inclusion of entire extent of the SJFZ in our next snapshot model (Fig. 5j), the median SED rate of the entire fault system drops from 20.0 to 15.0 mPa/yr consistent with increase in efficiency of the fault system through this transition (Fig. 7). Reduction in local SED rate is especially notable around the SJFZ, and SED rate in the ECSZ also drops significantly. High SED rate around the Mission Creek strand of the SAF persists through all of the models (Fig. 5g–j). The overall drop in SED rate throughout the system suggests an overall increase in mechanical efficiency of the fault system as the SJFZ accommodates deformation within the system. This is consistent with the hypothesis that the SJFZ initiated due to inefficiency of the system created by the bend in the SAF through San Gorgonio Pass, and is also consistent with model results for external work. The increased efficiency of the fault system manifests as reduced off-fault deformation. In our next snapshot model at 0.5–0.1 Ma (Fig. 5k) we have removed the Mission Creek strand through San Gorgonio Pass (Fig. 5j) and replaced it with the more linear Mill Creek strand of the SAF following the interpreted history of the fault system (Matti and Morton, 1993). The median SED rate of the system drops dramatically from 15.0 mPa/ yr to 11.2 mPa/yr—with notable decreases in the Salton block (between the SAF and SJFZ), ECSZ, and most significantly through the restraining bend. This is again consistent with the increase in efficiency revealed by the drop in tectonic work (Fig. 7) as the more linear Mill Creek strand of the SAF accommodates strike-slip deformation much better than the more kinked Mission Creek strand of the SAF (Table 1). This is also consistent with analog experiments of restraining bends that show greater efficiency for gentler restraining bends (Hatem et al., 2015). In the transition from the Mill Creek strand to the present-day SAF configuration (Fig. 5l), median SED rate increases from 11.2 mPa/yr to 13.5 mPa/yr, most notably increasing around the bend in the SAF. SED rate goes down in the ECSZ, indicating that while the overall efficiency of the modeled fault system in this transition decreases, it also increases in some regions, providing a possible explanation for why the system
moved from a seemingly more efficient to less efficient fault geometry through the bend. The change of active fault geometry through the bend seems counterintuitive—changing from a fairly efficient linear geometry to a less efficient, more sinuous geometry. However, since SED rate decreases elsewhere, it is possible that the change in San Gorgonio Pass creates a local inefficiency, but still contributes to greater efficiency of the system on a larger scale. 4.4. Vertical-axis rotations Paleomagnetic studies in the study region provide evidence for vertical-axis rotations over the past ~2 Ma. Paleomagnetic data record vertical-axis rotations in the San Timoteo Badlands, Borrego Badlands, and Mecca Hills (Lutz et al., 2006; Housen and Dorsey, 2010; Albright, 1999; Housen et al., 2013). Vertical-axis rotation rate maps for each snapshot model are plotted on Fig. 5m–r. Models with an active WSDF have significant (N 3°) clockwise rotation rates west of the WSDF (Fig. 5m, n), which is markedly reduced by the introduction of the SJFZ (Fig. 5p). The off-fault distortional strain is taken up as slip along the SJFZ. Counterclockwise rotation rates in the San Gabriel Mountains north of the Sierra Madre fault during extension on the WSDF (Fig. 5m) decreases to near-zero rotation, and some clockwise rotation rates are predicted in the eastern San Gabriel Mountains, with the evolution of the fault system (Fig. 5m–p). Models produce distributed counterclockwise rotation rates in the ECSZ in early models (Fig. 5m–o) as well as in the Mill Creek model (Fig. 5q), but the present-day model has very little rotation in the ECSZ (Fig. 5r). This reduction in off-fault distortion is consistent with the decrease in SED rates within the ECSZ through the fault evolution. The counterclockwise rotation rates between right-lateral faults of the ECSZ are also consistent with ‘bookshelf’ style rotation interpreted for the Mojave (e.g. Valentine et al., 1993). In addition to counterclockwise rotation within the ECSZ when the Mill Creek strand of the SAF is active (~0.5–0.1 Ma), we also see enhanced counterclockwise rotation between the SAF and SJFZ (Fig. 5q) compared to other models of the past ~ 1.1 Ma (Fig. 5p, r). The northern San Bernardino Mountains, just south of the North Frontal thrust fault, transition from rapid counterclockwise rotation N 1.5 Ma (Fig. 5m–p) to near-zero rotation today (Fig. 5r). This is consistent with decreased SED rates in this region. While we can compare snapshots of rotation rates at different stages in the evolution in the fault system to measured paleomagnetic rotations (Fig. 5m–r), the observed rotations are accumulated on timescales up to 2+ Ma, so a more appropriate approach is to weight rotation rates from the snapshots in our evolution models over the corresponding timespan of each stage to produce composite estimates of net rotation over the past 2 Ma and 1 Ma (Fig. 8). For the past 1 Ma, the duration of each stage of faulting is fairly well constrained (Kendrick et al., 2010). The time-averaged rotation rates for time periods greater than 1 Ma has uncertainties associated with both the timing of the shift from transtension to strike-slip, as well as the duration for the full development of the SJFZ. To make a best approximation, we weight the WSDF model in strike-slip loading from 1 to 1.5 Ma, and the WSDF in transtensional loading from 1.5 to 2 Ma. The model with only the northern section of the SJFZ is not included in the time-averaged maps
Table 1 Area-weighted average right-lateral slip rates in mm/yr with standard deviation. Snapshot model
Time Period
SAF
SJFZ
WSDF
ECSZ
Present day Mill Creek strand active Mission Creek strand active Only North SJF active WSDF transcurrent WSDF transtension
~0.1 Ma–present ~0.5–~0.1 Ma ~1.1–~0.5 Ma ~1.3 Ma (?) ~1.5–~1.3 Ma (?) N 1.5 Ma
20.2 ± 2.5 24.4 ± 1.9 20.8 ± 1.8 24.9 ± 2.6 25.3 ± 2.6 28.7 ± 2.5
8.8 ± 3.2 8.6 ± 3.1 9.1 ± 3.3 4.3 ± 1.2 n/a n/a
n/a n/a n/a n/a 0.4 ± 0.7 0.2 ± 1.3
1.2 ± 0.4 1.2 ± 0.4 1.4 ± 0.4 1.8 ± 0.6 1.8 ± 0.6 2.0 ± 0.6
Strike-slip rates for the San Andreas fault (SAF), San Jacinto fault zone (SJFZ), West Salton detachment fault (WSDF) and Eastern California Shear Zone (ECSZ) are averaged over the fault surface used in the models. Rates for each snapshot model (described in first column) are presented in mm/yr of right-lateral slip with standard deviation.
484
L.A. Fattaruso et al. / Tectonophysics 693 (2016) 474–488
~2 Ma - present
~1 Ma - present
(a)
1
1 2
N
(b)
3 50 km
2 6
CCW
3
0
3
degrees/Ma
3
6
CW
Fig. 8. Vertical-axis rotation rates weighted over the past (a) ~2 Ma and (b) ~1 Ma. Boxes indicate regions with paleomagnetism data available for comparison in 1. the San Timoteo Badlands, 2. Mecca Hills, and 3. Borrego Badlands.
because this may not have been a prolonged stage in the fault evolution. Furthermore, significant rotation at the southern tip of the SJFZ in this model was likely transient as the San Jacinto propagated southward. Albright (1999) documented 5–10° CCW rotation since ~2 Ma in the San Timoteo Badlands (Fig. 8a, region 1). Rotation rates summed over the past ~ 2 Ma from models indicate moderate (2–5°) CW rotation here, failing to match the paleomagnetic data. Models of the past ~ 1 Ma have concentrations of strong (N 6°) CCW rotation near the Crafton Hill fault within this region (Fig. 5p–r), but significant CW rotation in models from 1 to 2 Ma counteract this. This could mean that our fault geometry in this region is not correct for the older models—changes to the surface trace or connectivity of the WSDF to other faults could change the rotations here. Uncertainty is compounded by the complexity of the faults surrounding the San Timoteo Badlands. An alternative explanation for this discrepancy is that the vertical-axis rotation reported by Albright (1999) all took place after 1.1 Ma. In the Mecca Hills (Fig. 8b, region 2) models reproduce highly localized patterns of rotation measured by paleomagnetism, with moderate (~3°) CW rotation northeast of the Painted Canyon fault since ~1 Ma, and moderate (~ 3°) CCW rotation southwest of the Painted Canyon fault, between the Painted Canyon fault and SAF, since ~ 1–2 Ma (Housen et al., 2013). The geometry of faults in this region has been validated by match of the deformation model results to uplift patterns (Fattaruso et al., 2014), suggesting that in regions where model fault geometry has been able to match one dataset, it is more likely to match other datasets well. In contrast to this region, both uplift and rotation rates in the San Timoteo badlands are not as well-matched to geologic data, suggesting that this region may not be modeled accurately, and could benefit from further investigation. In the Borrego Badlands, in the stepover between the Clark and Coyote Creek strands of the SJFZ (Fig. 8b, region 3), Lutz et al. (2006) documented a rotation rate of 0° ± 8° since ~1 Ma in the NW of region 3, indicating basically zero rotation in that area. Yet, only ~10 km to the southeast Housen and Dorsey (2010) documented CW rotation of 30–40° since ~ 1.6 Ma. The ~ 1 Ma time-averaged model matches the spatial variations in the paleomagnetic-derived rotations, with the model results showing strong (N6°) CW rotation to the southeast, and less than 8° net CCW rotation to the northwest (Fig. 8b). In addition to comparing the time-averaged rotations to the paleomagnetic data, we can compare the patterns of vertical-axis rotation from the present-day model to regional models that calculate verticalaxis rotations from inversion of GPS data (McCaffrey, 2005; Bos and Spakman, 2005). The inversions with simplified geometry for fault networks cannot resolve the level of spatial variability of rotation rates in our models that results from fault interaction. Consequently, we only compare the broad patterns of vertical-axis rotation rates in the regions of the Salton Trough and the area between the Pinto Mountain and San
Andreas faults. The present-day model shows strong clockwise rotation between the Pinto Mountain and San Andreas faults consistent with the results of Bos and Spakman (2005) who modeled clockwise rotation rates around 8–12°/Ma for this region, but faster than the rates of McCaffrey (2005) who modeled a very slight (b0.3°/Ma) counterclockwise rotation rate. Within the Salton Trough, the present day model shows slight CW rotation consistent with results of McCaffrey (2005) who found ~0.15°/Ma CW rotation here, but slower than the rotation rates of Bos and Spakman (2005) of ~8–12°/Ma of CW rotation. Differences in vertical-axis rotation rates could arise from the difference in fault connectivity between our models and the block models, as well as from the modeling approach. 5. Discussion 5.1. Trade-offs between slip efficiency and off-fault deformation through time Given the variety of results presented here, it is worthwhile to explore the connections and trade-offs between slip, uplift, vertical-axis rotation, and SED. To the first order, these correlations and trade-offs reflect changes in the partitioning of deformation between fault slip and off-fault deformation. In the ECSZ, for example, the faults experience enhanced strike-slip and CCW rotation rate for our first 3 snapshot models before the full development of the SJFZ (Table 1; Fig. 5m–o). Strike-slip rates on ECSZ faults decreases with the growth of the SJFZ, as does CCW rotation and SED. Vertical-axis rotation rates in the ECSZ are the smallest for the present day model (Fig. 5r), as are slip rates (Table 1). In models that include the SJFZ, strike-slip rate on the SAF is fastest for the ~0.5–0.1 Ma snapshot model with the active Mill Creek strand of the SAF through San Gorgonio Pass. This period of faster strike-slip on the SAF also corresponds to reduced uplift, SED and vertical-axis rotation in the San Bernardino Mountains, as deformation is accommodated more efficiently as slip on the fault for this period thereby reducing off-fault deformation (Fig. 5k). This more efficient fault geometry through the bend channels more strike-slip onto the SAF and reduces strike-slip along the SJFZ (Table 1), which also results in reduced uplift on the SJFZ in the Santa Rosa Mountains during this model snapshot (Fig. 5e, location 8). Comparing these changes in slip partitioning between the SAF and SJFZ to slip rates through time described by Bennett et al. (2004), we find that the models match some first-order changes to slip partitioning. The fastest strike-slip rates along the SAF are over the past ~5 Ma (Powell and Weldon, 1992) and the first snapshot model of this study has the fastest slip rate for the SAF (Table 1). The models also match the decreased strike slip rate on the SAF after the inception of the SJFZ (Harden and Matti, 1989; Bennett et al., 2004). The active Mill Creek strand snapshot from 0.5 to 0.1 Ma with enhanced strike-slip on the SAF also exhibits enhanced CCW rotation
L.A. Fattaruso et al. / Tectonophysics 693 (2016) 474–488
rate between the SAF and SJFZ (Fig. 5q). In contrast, models with the active Mission Creek strand and with the present-day faults through San Gorgonio Pass, which both have lower SAF slip rates than the Mill Creek strand snapshot, both also produce a lobe of significant CW rotation southeast of the Crafton Hills fault (Fig. 5p, r). In this region, changes to the active fault geometry seem to have a significant impact on both the magnitude and orientation of vertical-axis rotation. Thus, changes to the fault geometry in this region over the course of the past 2 Ma could account for the time-dependence of rotation observed from paleomagnetic data in the San Timoteo Badlands. While the fault geometry of the present-day model is slightly less efficient than the Mill Creek SAF configuration that preceded it (Fig. 7), the overall trend of our snapshot models is towards greater efficiency with evolution of the southern San Andreas fault system. The change of tectonic boundary conditions from transtension to dextral strikeslip, the abandonment of the WSDF, the initiation of the SJFZ, and the change from the active Mission Creek strand to the Mill Creek strand of the SAF through San Gorgonio Pass all produce monotonic increases to the overall efficiency of the system that are consistent with the notion that fault systems evolve towards greater efficiency (e.g. Cooke and Madden, 2014). 5.2. Challenges While mechanical models offer a wealth of results for comparison to geologic data, the elastic models have limitations for simulating evolution of uplift and basin formation through time. For one thing, our models represent snapshots in time, and not the continuous evolution of faults as their geometry changes in response to deformation over time. We make large assumptions in the reconstruction of paleo-fault geometry used in our models—for example, we model the Mission Creek fault in its present day configuration, but evidence supports a change from an earlier, more linear Mission Creek fault geometry to the curving geometry used in our model, due to interaction with the left-lateral Pinto Mountain fault to the east (Matti and Morton, 1993; Matti et al., 1992). Reconstructing the fault geometry is beyond the scope of this study, so we accept this simplification but must keep it in mind when analyzing our results. Additionally, in identifying regions of uplift/subsidence, our snapshots do not incorporate the lateral translation of the crust through time inherent to a strike-slip fault system. This is less of a problem when comparing models of the present day to established regions of active uplift or subsidence, but as basins move through time, reconstruction in three-dimensions becomes slightly more complex. Faults in our model slip at a wide range of rates from up to ~ 12 mm/yr left-lateral strike-slip to 35 mm/yr right-lateral strike-slip, so translation will vary by region, with up to 35 km of translation possible over 1 Ma. For this reason, uplift or subsidence adjacent to faults trending roughly E–W (i.e. sub-perpendicular to the orientation of overall dextral plate motion, and consequently having slower strike-slip rate and low translation) match well to observations. In this case, these regions next to slowly slipping faults are uncoincidentally regions with extremely high uplift rates—the San Bernardino Mountains and San Gabriel Mountains. In contrast, regions next to NW–SE trending fast-slipping faults, such as the San Timoteo Badlands may undergo considerably more translation along the faults. Local changes to uplift/subsidence patterns near secondary faults, such as the change from normal slip to reverse slip along the Painted Canyon fault, resulting in a shift from deposition to uplift, are also more easily constrained than local uplift patterns adjacent to faults with higher strike slip rates. The limited strike slip along the Painted Canyon fault may minimize obscuring of uplift signal by translation. While this area is translated by the SAF, both sides of the PCF are translated similarly. However within regions with densely spaced, complex, intersecting faults, uplift patterns are also more susceptible to inaccuracies in the fault geometry or connectivity, which can be challenging to
485
establish in especially complex regions such as through San Gorgonio Pass. Another limitation of this study is the simplicity of the WSDF geometry in the model. While the surface trace has a somewhat complex curvilinear surface in some regions, in cross-sections the modeled fault surface has a simple listric detachment geometry following the reconstruction of Dorsey et al. (2012). However, detachment faults commonly have more complex ramp-flat geometries that influence slip and subsidence distributions. Incorporation of a more complex 3D geometry could alter distributions of SED or uplift/subsidence in the model results. For example, depocentral regions may be associated with the position of subjacent ramps. Another uncertainty in our reconstruction is the potential connection of the northern portion of the WSDF with the SAF. We include the WSDF only as far north as it has been mapped—a linkage to the SAF would alter the uplift pattern around the intersection, resulting in more acute localized uplift and subsidence. Refinements to the model at this level of detail, however, would not be of significant value at this time, given the current limitations of data available. 5.3. Related models Li and Liu (2007) used 3D finite visco-elasto-plastic finite element method models to explore how development of the SJFZ affects distributions of plastic strain. A major difference between our fault geometry and theirs is that they do not include a WSDF in their pre-SJFZ models. We ran a new model with no SJFZ and no WSDF to compare results directly to the Li and Liu (2007) model with no SJFZ (Fig. 9). Another significant difference between the models is that Li and Liu (2007) use vertical fault surfaces while the models presented here incorporate several dipping faults, most notably the north-dipping Mission Creek strand of the SAF. Despite this difference, the results for changes to the distribution off-fault deformation with the inception of the SJFZ agree to the first-order (Fig. 9). As in this study, Li and Liu (2007) see a reduction of off-fault deformation in the ECSZ and within the San Gorgonio Pass due to initiation of the SJFZ. In both studies, a region of high strain (elastic or plastic) develops between the SAF and active SJFZ in the northern part of the Salton trough. The most notable difference between the plastic and elastic models arises in the pre-SJFZ models, where off-fault strain in the Li and Liu (2007) models forms a localized band of plasticity along the future trace of the SJFZ. By comparison, the elastic model presented here produces regions of high strain around the northern portions of the future SJFZ and SED is more diffuse to the southeast (Fig. 9). While Li and Liu (2007) do not address the question of north-to-south propagation of the SJFZ, both their models and ours produce a lobe of high strain around San Gorgonio Pass, which is reduced significantly by the inclusion of the SJFZ (Fig. 9). Patterns of SED produced in the 3D models alone are not enough to identify fault planes likely to grow, as the distribution of high SED encompasses large regions. However, in conjunction with other geologic evidence, SED patterns contribute valuable information about the distribution of strain in a fault system. 5.4. Evolution of the WSDF, Pinto Mountain Fault, and San Gorgonio Pass We propose that extension on the WSDF may have contributed to formation of the restraining bend in the SAF through San Gorgonio Pass that produced the curved, north-dipping geometry of the Mission Creek strand of the SAF (Fig. 10). Because the north end of the WSDF is located just south of the restraining bend, it's plausible that east– west extension on the WSDF may have displaced the Coachella segment of the SAF to the east relative to the San Bernardino segment through time, producing or enhancing the left bend of the SAF. Eastward migration of the southern SAF driven by deep-rooted extension could also explain why the SAF dips to the NE in the Coachella Valley (e.g. Lin et al., 2007; Fuis et al., 2012; Fattaruso et al., 2014) whereas it is either vertical
486
L.A. Fattaruso et al. / Tectonophysics 693 (2016) 474–488
Li and Liu 2007 (plastic)
(b)
No San Jacinto
(a)
this study (elastic)
mPa/yr 0 20 40 60
(d)
San Jacinto
(c)
mPa/yr 0 20 40 60
60 0
Fig. 9. Maps of modeled off-fault strain as plastic strain energy release from Li and Liu (2007), and as strain energy density in this study, for models (a, b) without the San Jacinto fault and (c, d) including the SJF.
or southwest-dipping on the San Bernardino segment of the SAF northwest of San Gorgonio Pass. Dip-slip displacement on a listric WSDF could have tilted structures in the hanging wall including the previously vertical SAF. The transition from transtension south of San Gorgonio Pass (Salton Sea) to dextral strike-slip north of the pass is also consistent with slip on the left-lateral Pinto Mountain fault (Figs. 1, 10). Formation of the San Gorgonio Pass restraining bend has previously been attributed to progressive left-lateral strike-slip displacement on the Pinto Mountain fault (Matti et al., 1992; Matti and Morton, 1993). We propose that long-lived E–W extension on the WSDF may have acted in combination with, and possibly promoted, left-lateral slip on
(a)
ca. 6-8 Ma
~6 Ma - ~1.5 Ma (b)
F WS D
DF
PMF
SJF
WS
F SA
PMF
~1.5 Ma - present (c)
F SA
F SA
? PMF
the Pinto Mountain fault that resulted in progressive growth of the restraining bend in the SAF through San Gorgonio Pass. In our snapshot models, termination of dip-slip on the WSDF coincides with a decrease in rate of left-lateral slip on the Pinto Mountain fault. In the earliest model with transtension, the Pinto Mountain fault slips at up to a maximum of 4.5 mm/yr. With the end of slip on the WSDF and addition of the SJFZ, the Pinto Mountain fault slows to ≤3.1 mm/yr left lateral slip. The WSDF was active from ~ 7–6 (?) Ma to ~ 1.2 Ma (Shirvell et al., 2009; Dorsey et al., 2011, 2012), and uplift of the southern San Bernardino Mountains began around ~1.8 Ma (Spotila et al., 2001) preceding the end of activity on the WSDF. This timing is generally
Fig. 10. Conceptual model for evolution of fault system in southern California. (a) West Salton detachment fault (WSDF) possibly active starting ca. 6–8 Ma. (b) Extension on WSDF creates or enhances restraining bend in SAF. Slip on PMF is enhanced or reactivated. (c) Slip on WSDF ceases and SJF accommodates right-lateral strike-slip. Extension continues to the south.
L.A. Fattaruso et al. / Tectonophysics 693 (2016) 474–488
consistent with our suggestion that extension on the WSDF may have contributed to bending of the SAF within the San Gorgonio Pass that prompted the initiation of the SJFZ. 6. Conclusions Models of present-day fault geometry produce uplift and subsidence patterns that match well with geologic observations. Models simulating active faulting back in time are able to match observed changes to uplift and subsidence patterns in some regions—uplift in the San Bernardino Mountains and San Gabriel Mountains are simulated well, as are changes in the San Bernardino basin and within the San Timoteo badlands. In particular we show that onset of the SJFZ increases uplift rates in the eastern San Gabriel Mountains. Our snapshot elastic model approach explores the first-order effects of changing fault geometry, but models attempting to reconstruct the complete fault evolution should also take permanent deformation into consideration. We find that vertical-axis rotation is a valuable metric that can be used to compare model predictions to field data. Highly localized rotation patterns are reproducible in some regions and not in others, suggesting that fault geometry may be incompletely understood or incompletely modeled in regions that do not match, such as the San Timoteo Badlands. Tectonic work decreases in models with more efficient fault geometry, such as in changes from the extensional WSDF to the dextral SJFZ, and from the Mission Creek to the Mill Creek strands of the SAF. However, tectonic work increases with the transition from the Mill Creek strand of the SAF to the present-day active fault geometry. Recent refinements to model fault geometry have reduced the magnitude of this change in tectonic work from that of Cooke and Dair (2011), suggesting that refinement of model fault geometry can have significant impacts on the partitioning of deformation within the model. Maps of strain energy density reveal a high concentration of SED in the region of the northern SJFZ, supporting the notion that it initiated in the northwest and then propagated to the southeast. The ability of the evolution models to resolve a mechanical preference for north to south propagation of the SJFZ highlights the value of using SED for predicting fault growth. This approach provides a tool that can be used to distinguish between different but plausible geologic models and constrain the pattern of fault initiation and growth. A north to south propagation for the SJFZ supports earlier suggestions that high strain in the San Gorgonio pass restraining bend of the SAF was a primary control on initiation of the SJFZ. The simulated fault evolution shows a pattern of decreased off-fault deformation, increased fault slip, and increased efficiency with the maturity of the fault system. Acknowledgements This work was funded by National Science Foundation (NSF) grants NSF-EAR-1145067 to Cooke, EAR-1144946 to Dorsey, and EAR-1144355 to Housen. Thanks to George Hilley for providing a MATLAB script for isostatic adjustment of uplift rates. References Aktug, B., Nocquet, J.M., Cingoz, A., Parsons, B., Erkan, Y., England, P., Tekgul, A., et al., 2009. Deformation of western Turkey from a combination of permanent and campaign GPS data; limits to block-like behavior. J. Geophys. Res. 114 (B10). Albright, L.B., 1999. Magnetostratigraphy and biochronology of the San Timoteo Badlands, southern California, with implications for local Pliocene–Pleistocene tectonic and depositional patterns. Geol. Soc. Am. Bull. 111, 1265–1293. Anderson, M., Matti, J., Jachens, R., 2004. Structural model of the San Bernardino basin, California, from analysis of gravity, aeromagnetic, and seismicity data. J. Geophys. Res. B: Solid Earth 109 (4). http://dx.doi.org/10.1029/2003JB002544. Axen, G.J., Fletcher, J.M., 1998. Late Miocene–Pleistocene extensional faulting, northern Gulf of California, Mexico and Salton Trough, California. Int. Geol. Rev. 40, 217–244. Bennett, R.A., Friedrich, A.M., Furlong, K.P., 2004. Codependent histories of the San Andreas and San Jacinto fault zones from inversion of fault displacement rates. Geology 32, 961–964.
487
Binnie, S.A., Phillips, W.M., Summerfield, M.A., Fifield, L.K., Spotila, J.A., 2008. Patterns of denudation through time in the San Bernardino Mountains, California: implications for early-stage orogenesis. Earth Planet. Sci. Lett. 276 (1), 62–72. Blisniuk, K., Rockwell, T., Owen, L.A., Oskin, M., Lippincott, C., Caffee, M.W., Dortch, J., 2010. Late Quaternary slip rate gradient defined using high-resolution topography and 10Be dating of offset landforms on the southern San Jacinto Fault zone, California. J. Geophys. Res. 115, B08401. http://dx.doi.org/10.1029/2009JB006346 (11 p.). Bos, A.G., Spakman, W., 2005. Kinematics of the southwestern U.S. deformation zone inferred from GPS motion data. J. Geophys. Res. 110. http://dx.doi.org/10.1029/ 2003JB002742. Chang, S.-B.R., Allen, C.R., Kirschvink, J.L., 1987. Magnetic stratigraphy and a test for block rotation of sedimentary rocks within the San Andreas fault zone, Mecca Hills, southeastern California. Quat. Res. 27, 30–40. Cooke, M.L., Dair, L.C., 2011. Simulating the recent evolution of the southern big bend of the San Andreas fault, Southern California. J. Geophys. Res. 116, B04405. http://dx. doi.org/10.1029/2010JB007835. Cooke, M.L., Madden, E.H., 2014. Is the Earth lazy? A review of work minimization in fault evolution. J. Struct. Geol. 66, 334–346. Cooke, M.L., Murphy, S., 2004. Assessing the work budget and efficiency of fault systems using mechanical models. J. Geophys. Res. 109, B10408. http://dx.doi.org/10.1029/ 2004JB002968. Cooke, M.L., Schottenfeld, M.T., Buchanan, S.W., 2013. Evolution of fault efficiency at restraining bends within wet kaolin. J. Struct. Geol. http://dx.doi.org/10.1016/j.jsg. 2013.01.010. Crouch, S.L., Starfield, A., 1990. Boundary Element Methods in Solid Mechanics. Unwin Hyman Press, London. Crowell, B.W., Bock, Y., Sandwell, D.T., Fialko, Y., 2013. Geodetic investigation into the deformation of the Salton Trough. J. Geophys. Res. Solid Earth 118 (B9), 5030–5039. http://dx.doi.org/10.1002/jgrb.50347. Dair, L., Cooke, M.L., 2009. San Andreas fault geometry through the San Gorgonio Pass, California. Geol. 37, 119–122. http://dx.doi.org/10.1130/G25101A. Del Castello, M., Cooke, M.L., 2007. Underthrusting–accretion cycle: work budget as revealed by the boundary element method. J. Geophys. Res. 112, B12404. http://dx. doi.org/10.1029/2007JB004997. DeMets, C., Gordon, R.G., Argus, D.F., 2010. Geologically current plate motions. Geophys. J. Int. 181 (1), 1–80. http://dx.doi.org/10.1111/j.1365-246X.2009.04491.x. DiBiase, R.A., Whipple, K.X., Lamb, M.P., Heimsath, A.M., 2015. The role of waterfalls and knickzones in controlling the style and pace of landscape adjustment in the western san Gabriel Mountains, CA. Geol. Soc. Am. Bull. http://dx.doi.org/10. 1130/B31113.1. Dorsey, R.J., Langenheim, V.E., 2015. Crustal-scale tilting of the central Salton block, southern California. Geosphere 11 (6). http://dx.doi.org/10.1130/GES00982.1 (30 pages). Dorsey, R.J., Axen, G.J., Peryam, T.C., Kairouz, M.E., 2012. Initiation of the Southern Elsinore Fault at ∼1.2 Ma: evidence from the Fish Creek–Vallecito Basin, southern California. Tectonics 31. Dorsey, R.J., Housen, B.A., Janecke, S.U., Fanning, C.M., Spears, A.L.F., 2011. Stratigraphic record of basin development within the San Andreas fault system: Late Cenozoic Fish Creek–Vallecito basin, southern California. Geol. Soc. Am. Bull. 123, 771–793. Du, Y., Aydin, A., 1993. The maximum distortional strain energy density criterion for shear fracture propagation with applications to the growth paths of en echelon faults. Geophys. Res. Lett. 20, 1091–1094. Fattaruso, L.A., Cooke, M.L., Dorsey, R.J., 2014. Sensitivity of uplift patterns to dip of the San Andreas fault in the Coachella Valley, California. Geosphere 10 (6), 1235–1246. Fialko, Y., 2006. Interseismic strain accumulation and the earthquake potential on the southern San Andreas fault system. Nature 441, 968–971. http://dx.doi.org/10. 1038/nature04797. Fuis, G.S., Scheirer, D.S., Langenheim, V.E., Kohler, M.D., 2012. A new perspective on the geometry of the San Andreas fault in southern California and its relationship to lithospheric structure. Bull. Seismol. Soc. Am. 102, 236–251. http://dx.doi.org/10.1785/0120110041. Griffith, W.A., Cooke, M.L., 2004. Mechanical validation of the three-dimensional intersection geometry between the Puente Hills blind-thrust system and the Whittier Fault, Los Angeles, California. Bull. Seismol. Soc. Am. 94, 493–505. Harden, J.W., Matti, J.C., 1989. Holocene and late Pleistocene slip rates on the San Andreas fault in Yucaipa, California using displaced alluvial-fan deposits and soil chronology. Geol. Soc. Am. Bull. 101, 1107–1117. Hatem, A., Cooke, M.L., Madden, E.H., 2015. Evolving efficiency of restraining bends within wet kaolin analog experiments. J. Geophys. Res. 119. http://dx.doi.org/10.1002/ 2014JB011735. Hehn, N.V., MacFadden, B.J., Albright, L., Woodburne, M.O., 1996. Magnetic polarity stratigraphy and possible differential tectonic rotation of the Miocene–Pliocene mammal-bearing San Timoteo Badlands, Southern California. Earth Planet. Sci. Lett. 141 (1–4), 35–49. Herbert, J.W., Cooke, M.L., 2012. Sensitivity of the southern San Andreas fault system to tectonic boundary conditions and fault configurations. Bull. Seismol. Soc. Am. 102, 2046–2062. Herbert, J.W., Cooke, M.L., Oskin, M., Difo, O., 2014. How much can off-fault deformation contribute to the slip rate discrepancy within the eastern California shear zone? Geology 42 (1), 71–75. http://dx.doi.org/10.1130/G34738.1. Housen, B.A., Dorsey, R.J., 2010. Magnetostratigraphy and paleomagnetism of the PlioPleistocene Arroyo Diablo and Borrego Formations in the Borrego Badlands, western Salton Trough, CA. Eos. Trans. AGU GP23C-8. Housen, B.A., Fattaruso, L.A., McNabb, J.C., Dorsey, R.J., Messe, G.T., Cooke, M.L., 2013. Magnetostratigraphy and paleomagnetism of the Palm Spring and Mecca Formations, Mecca Hills, CA: spatial variation of vertical-axis rotation in the Coachella Valley. Am. Geophys. Union (T11D-2485). Itoh, Y., Kusumoto, S., Furubayashi, T., 2008. Quantitative evaluation of Quaternary crustal deformation around the Takayama Basin, central Japan; a paleomagnetic and
488
L.A. Fattaruso et al. / Tectonophysics 693 (2016) 474–488
numerical modeling approach. Earth Planet. Sci. Lett. 267 (3–4), 517–532. http://dx. doi.org/10.1016/j.epsl.2007.11.062. Jaeger, J.C., Cook, N.G.W., 1976. Fundamentals of Rock Mechanics. John Wiley, Hoboken, N. J. Janecke, S.U., Dorsey, R.J., Forand, D., Steely, A.N., Kirby, S.M., Lutz, A.T., Housen, B.A., Belgarde, B., Langenheim, V.E., Rittenour, T.M., 2010. High geologic slip rates since early Pleistocene initiation of the San Jacinto and San Felipe fault zone in the San Andreas fault system: Southern California, USA. Geol. Soc. Am. Spec. Pap. 475, 1–43. Jennings, C.W., compiler, 1977, Geologic Map of California: California Division of Mines and Geology Geologic Data Map 2, (scale 1:750,000). Kairouz, M.E., 2005. Geology of the Whale Peak Region of the Vallecito Mountains: Emphasis on the Kinematics and Timing of the West Salton Detachment Fault, Southern California M.S. thesis Univ. of Calif., Los Angeles (166 pp.). Kendrick, K.J., Matti, J.C., Mahan, S.A., 2015. Late Quaternary slip history of the Mill Creek strand of the San Andreas fault in San Gorgonio Pass, southern California: the role of a subsidiary left-lateral fault in strand switching. Geol. Soc. Am. Bull. 127 (5–6), 825–849. Kendrick, K.J., Matti, J.C., Mahan, S.A., Landis, G.P., 2010. Pedogenic constraints on slip along the San Andreas Fault, Southern California. Geol. Soc. Am. Abstr. Programs 42 (5), 232. Kendrick, K.J., Morton, D.M., Wells, S.G., Simpson, R.W., 2002. Spatial and temporal deformation along the northern San Jacinto fault, southern California: implications for slip rates. Bull. Seismol. Soc. Am. 92 (7), 2782–2802. http://dx.doi.org/10.1785/ 0120000615. Kirby, S.M., Janecke, S.U., Dorsey, R.J., Housen, B.A., Langenheim, V., McDougall, K., Steely, A.N., 2007. Pleistocene Brawley and Ocotillo formations: evidence for initial strikeslip deformation along the San Felipe and San Jacinto fault zones, southern California. J. Geol. 115, 43–62. Langenheim, V.E., Jachens, R.C., Matti, J.C., Hauksson, E., Christensen, A., 2005. Geophysical evidence for wedging in the San Gorgonio Pass structural knot, southern San Andreas fault zone, southern California. GSA Bull. 117, 1554–1572. Li, Q., Liu, M., 2007. Initiation of the San Jacinto Fault and its interaction with the San Andreas Fault. Pure Appl. Geophys. 164, 1937–1945. Lin, G., Shearer, P.M., Hauksson, E., 2007. Applying a three-dimensional velocity model, waveform cross correlation, and cluster analysis to locate southern California seismicity from 1981 to 2005. J. Geophys. Res. 112. Lutz, A.T., Dorsey, R.J., Housen, B.A., Janecke, S.U., 2006. Stratigraphic record of Pleistocene faulting and basin evolution in the Borrego Badlands, San Jacinto fault zone, southern California. Geol. Soc. Am. Bull. 1377–1397. Marshall, S.T., Cooke, M.L., Owen, S.E., 2008. Effects of nonplanar fault topology and mechanical interaction on fault-slip distributions in the Ventura Basin, California. Bull. Seismol. Soc. Am. 98, 1113–1127. Marshall, S.T., Kattenhorn, S.A., Cooke, M.L., 2010. Secondary normal faulting in the Lake Mead fault system and implications for regional fault mechanics. In: Umhoefer, P.J., et al. (Eds.), Miocene Tectonics of the Lake Mead Region, Central Basin and Range. Spec. Pap. Geol. Soc. Am. 463, pp. 289–310. Matti, J.C., Morton, D.M., 1993. Paleogeographic evolution of the San Andreas Fault in Southern California: a reconstruction based on a new cross-fault correlation. In: Powell, R.E., Weldon, R.J., Matti, J.C. (Eds.), The San Andreas Fault System: Displacement, Palinspastic Reconstruction, and Geologic Evolution. Geol. Soc. Am. Memoir 178, pp. 107–159. Matti, J.C., Morton, D.M., Cox, B.F., 1992. The San Andreas fault system in the vicinity of the central Transverse Ranges province, Southern California (no. 0196-1497). U. S. Geological Survey Open File Report 92-354: Reston, VA, United States USGS, United States. McCaffrey, R., 2005. Block kinematics of the Pacific–North America plate boundary in the southwestern United States from inversion of GPS, seismological, and geologic data. J. Geophys. Res. 110. http://dx.doi.org/10.1029/2004JB003307. McNabb, J.C., 2013. Stratigraphic Record of Pliocene-Pleistocene Basin Evolution and Deformation Along the San Andreas Fault, Mecca Hills, CA [Master’s thesis]: University of Oregon (70 p.). Meigs, A.J., Cooke, M.L., Marshall, S.T., 2008. Using vertical rock uplift patterns to constrain the three-dimensional fault configuration in the Los Angeles Basin. Bull. Seismol. Soc. Am. 98, 106–123. Meisling, K.E., Weldon, R.J., 1989. Late Cenozoic tectonics of the northwestern San Bernardino Mountains, southern California. Geol. Soc. Am. Bull. 101, 106–128. http://dx.doi.org/10.1130/0016-7606.
Morton, D.M., Matti, J.C., 1993. Extension and contraction within an evolving divergent strike-slip fault complex: the San Andreas and San Jacinto fault zones at their convergence in Southern California. In: Powell, R.E., Weldon, R.J., Matti, J.C. (Eds.), The San Andreas Fault System: Displacement, Palinspastic Reconstruction, and Geologic Evolution. Geological Society of America, Memoir 178, pp. 217–230. Okubo, C.H., Schultz, R.A., 2005. Evolution of damage zone geometry and intensity in porous sandstone: insight gained from strain energy density. J. Geol. Soc. 162 (6), 939–949. Olson, E., Cooke, M.L., 2005. Application of three fault growth criteria to the Puente Hills Thrust System, Los Angeles, California, USA. J. Struct. Geol. 27, 1765–1777. http:// dx.doi.org/10.1016/j.jsg.2005.02.005. Persaud, P., Stock, J.M., Fuis, G.S., Hole, J.A., Goldman, M.R., Scheirer, D.S., 2014. 3-D velocity model of the Coachella Valley, Southern California based on explosive shots from the Salton Seismic Imaging Project. Abstract S23C-4512 presented at 2014 Fall Meeting, AGU, San Francisco, Calif., 15–19 Dec. Platt, J.P., Becker, T.W., 2010. Where is the real transform boundary in California? Geochem. Geophys. Geosyst. 11 (Q06012), 1–19. http://dx.doi.org/10.1029/ 2010GC003060. Platt, J.P., Becker, T.W., 2013. Kinematics of rotating panels of E–W faults in the San Andreas System; what can we tell from geodesy? Geophys. J. Int. 194 (3), 1295–1301. http://dx.doi.org/10.1093/gji/ggt189. Plesch, A., Shaw, J.H., Benson, C., Bryant, W.A., Carena, S., Cooke, M., Dolan, J., Fuis, G.S., Gath, E., Grant, L., Hauksson, E., Jordan, T., Kamerling, M., Legg, M., Lindvall, S., Magistrale, H., Nicholson, C., Niemi, N., Oskin, M., Perry, S., Planansky, G., Rockwell, T., Shearer, P., Sorlien, C., Suess, M.P., Suppe, J., Treiman, J., Yeats, R., 2007. Community fault model (CFM) for Southern California. Bull. Seismol. Soc. Am. 97, 1793–1802. Powell, R.E., 1993. Balanced palinspastic reconstruction of pre-late Cenozoic paleogeology, Southern California; geologic and kinematic constraints on evolution of the San Andreas fault system. Mem. Geol. Soc. Am. 178, 1–106. Powell, R.E., Weldon II, R.J., 1992. Evolution of the San Andreas fault. Annu. Rev. Earth Planet. Sci. 20, 431–468. Rockwell, T., Loughman, C., Merifield, P., 1990. Late Quaternary rate of slip along the San Jacinto fault zone near Anza, Southern California. J. Geophys. Res. 95 (B6), 8593–8605. http://dx.doi.org/10.1029/JB095iB06p08593. Sharp, R.V., 1981. Variable rates of late Quaternary strike-slip on the San Jacinto fault zone, southern California. J. Geophys. Res. 86 (B3), 1754–1762. http://dx.doi.org/10. 1029/JB086iB03p01754. Shirvell, C.R., Stockli, D.F., Axen, G.J., Grove, M., 2009. Miocene–Pliocene exhumation along the West Salton detachment fault, Southern California, from (U–Th)/He thermochronometry of apatite and zircon. Tectonics 28 (2). http://dx.doi.org/10. 1029/2007TC002172. Spotila, J.A., Farley, K.A., Yule, J.D., Reiners, P.W., 2001. Near-field transpressive deformation along the San Andreas fault zone in southern California, based on exhumation constrained by (U–Th)/He dating. J. Geophys. Res. Solid Earth 106 (B12), 30909–30922. Steely, A.N., 2006, The Evolution from Late Miocene West Salton Detachment Faulting to Cross-cutting Oblique Strike-slip Faults in the SW Salton Trough, California [M.S. thesis]: Utah State University, 253 p., 3 plates, (scale 1:24,000). Steely, A.N., Janecke, S.U., Dorsey, R.J., Axen, G.J., 2009. Early Pleistocene initiation of the San Felipe fault zone, SW Salton Trough, during reorganization of the San Andreas fault system. Geol. Soc. Am. Bull. 121, 663–687. Thomas, A.L., 1993. POLY3D: a three-Dimensional, Polygonal Element, Displacement Discontinuity Boundary Element Computer Program with Applications to Fractures, Faults, and Cavities in the Earth's Crust. Stanford University, Stanford, California. Timoshenko, S.P., Goodier, J.N., 1934. Theory of Elasticity. McGraw-Hill, New York. Valentine, M.J., Brown, L.L., Golombek, M.P., 1993. Cenozoic crustal rotations in the Mojave Desert from paleomagnetic studies around Barstow, California. Tectonics 12 (3), 666–677. http://dx.doi.org/10.1029/92TC02813. Weldon, R.J., Sieh, K.E., 1985. Holocene rate of slip and tentative recurrence interval for large earthquakes on the San Andreas Fault, Cajon Pass, Southern California. Geological Society of America Bulletin 96, 793–812. Yule, D., Sieh, K., 2003. Complexities of the San Andreas Fault near San Gorgonio Pass; implications for large earthquakes. J. Geophys. Res. Solid Earth 108 (B11), 2548. http:// dx.doi.org/10.1029/2001JB000451 (p. 9-1–9-23).