Reverse engineering tools support the comprehension of software systems; quite a few such tools exist and are best practice already. Each tool has its pro and ...
Reuse in Reverse Engineering Thomas Panas
Jonas Lundberg
Welf L¨owe
Software Technology Group MSI, University of V¨axj¨o, Sweden {Thomas.Panas|Jonas.Lundberg|Welf.Lowe}@msi.vxu.se
Abstract In this paper, we present a framework for reverse engineering allowing the integration and interaction of different analysis and visualization tools. The framework architecture that we propose uses a dynamic type system to guarantee the proper exchange of data between the tools and a set of wrapper classes to handle their communication. This allows for an easy and secure integration of tools that have originally not been designed to work together. In this sense, existing tools can be (re-)used and integrated. As a proof of concept we also present our own instantiation of the proposed framework architecture.
1. Introduction Reverse engineering tools support the comprehension of software systems; quite a few such tools exist and are best practice already. Each tool has its pro and cons but none supports all the tasks that take place in a reverse engineering process. As a result, each engineer chooses a tailored environment, a set of tools and routines he/she is most productive with. This leads to a never ending problem of exchanging data between different programs. Despite their different approaches, specializations and advantages, they all need to perform program analyses to gain information and program visualization to transport that information to the engineer. It appears straight-forward to design a framework connecting different analyses and visualization tools. However, not all analyses results can be displayed with all visualization tools. A call graph, e.g., cannot be displayed appropriately using a pie chart. Hence, a framework must provide means to guarantee that information is just provided to the appropriate visualization tools. A general solution is to introduce a type system that guarantees certain predicates of the exchanged information.
We suggest a flexible framework for reverse engineering that allows users to choose and combine the appropriate analysis and visualization tools. The framework guarantees the proper exchange of data between the tools. Therefore, we propose a dynamic type system allowing for type-safe dynamic plug-ins. In this respect, our proposal goes beyond the Eclipse [1] framework. With such a type system at hand, one can push the framework-idea one step ahead: certain analyses can be based on information provided by others even though they are originally not designed to interact. This allows for the integration of a sequence of analyses and visualizations, tailored to an individual software engineer with his/her favorite set of tools. In the following, we describe in Section 2, based on a scenario, different reverse engineering activities and applicable tools. Further, we motivate in this section our need for a reverse engineering framework. Section 3 establishes general requirements and solutions for a such framework. Our own framework, its architecture and implementation are described in Section 4. Finally, Section 5 describes related work and Section 6 concludes the paper.
2. Re-engineering Patterns, Tools, and Tasks A theoretical framework and patterns to approach reengineering and reverse engineering activities are described in [2, 3]. In the following, we illustrate a scenario of activities that are most common to many re-engineering problems, e.g. the addition, modification, extraction and generalization of functionality. We structure the scenario according to the classification in [3]. To support our idea that a framework is needed, we discuss the analyses, abstraction levels, and visualizations that are frequently used, and the different support tools a software engineer can choose from. First Contact (Architecture Representation). As a start, a software engineer would skim through the source code, the documentation and most likely execute the system in order to have an idea of its purpose. Additionally, a chat with
Analysis
Interaction
Focusing
Focusing
Visual Rep.
Analysis Rep. Source Rep.
Software
Extraction
Source Rep.
Class Rep.
Visualization
Focusing
Class Rep.
Focusing Architecture Rep.
Architecture Rep.
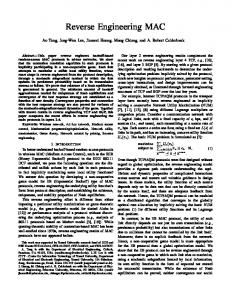
Figure 1. Reverse Engineering Tasks the original developers or other maintainers can expose essential information. To support the navigation within the system, an abstract view of the system is helpful. Therefore, an overview of the system’s architecture is necessary including a mapping of abstract components to the concrete classes and/or packages. Moreover, various software metrics could in addition give information about the complexity in, or coupling between, different parts in the system. Support tools used in this phase perform appropriate analyses and/or visualizations. They often include design pattern detection or some kind of class clustering based on software metrics or general graph properties. The outcome of such an analysis is an architectural representation of the system where classes are hierarchically grouped into architectural entities like components and connectors. Other tools provides overview metrics. Note, that tools for forward-engineering often provide the appropriate views but not the necessarily analyses to gain the necessary information automatically. Others perform analyses but do not visualize the results. There are many appropriate tools to support the first contact: Imagix [4] analyze C/C++ code and provide various views on the information. In that respect, GOOSE [5] is like Imagix but restricted to C++ and Java, respectively. So is the VizzAnalyzer [6], our own analysis tool, which is now split into the Analyzer and the Vizz3D components (see below). Rational Rose [7] and TogetherSoft [8] provide even more advanced architectural views but no appropriate analyses for that level. Bauhaus [9], which analyzes C code, provides no own but third party visualizations. Initial Understanding (Class Representation). In the next phase, an initial system understanding must be created.
At this time, one might read or extend the documentation of methods within classes of interest. Further, first speculations about the design can be performed. It is also common to perform some local refactorings, e.g. to rename methods and identifiers or to remove dead code. These activities usually work directly with a source code representation of the system. Hence, it is necessary to have a source code editor at hand that allows for online syntax and semantics analysis. For understanding dependencies, definition-useinformation needs to be analyzed. For the initial understanding, some tools mentioned above can be reused, e.g. Imagix, Rational Rose and TogetherSoft, also additional editor based tools, such as CodeGuide [10], SHriMP [11] or editors in Eclipse. Simple refactorings can also benefit from meta-programming tools like Recoder [12] to perform certain changes of the code. Appropriate metrics and views thereof are supported, e.g. by sv3D [13] and SeeSoft [14]. Detailed Model Capture (Source Representation). The third step is to capture a detailed model of the system: its classes and/or methods and their interactions and runtime behavior. The latter needs an understanding of the sequence of events occurring on program execution. Class and sequence diagrams as well as call graphs are the views supporting this phase. Besides syntax and semantical analyses, data-flow and dynamic (sample execution based) analyses need to be performed. Because of the quite expensive analyses and the high amount of information, detailed focusing is essential, e.g. filtering statically certain subsystems and system aspects, or dynamically certain event types. The phase of detailed static model capturing is supported
by the most tools mentioned above. Dynamic information is analyzed and visualized by any debugger or profiler tool, e.g. JDB (The Java Debugger), VizzAnalyzer, Jive Visualizer [15], EVolve [16] and JProbe [17], for the Java world. Compiler libraries support semantic analyses, e.g. Recoder [12], and data-flow analyses, e.g. CoSy [18], PAG [19], or libFirm [20]. In addition to tools mentioned above there are quite a few tools specialized at information visualization without providing any analysis. Examples are GraphViz [21], VCG [22], Graphlet [23], yED [21], WilmaScope [21] or MS Excel [24]1 . Obviously, the applied reverse engineering patterns and tools boil down to an iteration over the tasks: Analysis, Visualization, and Information Focusing. Analysis extracts information from the program source code. It starts with a low level analysis (basically a compiler front-end) which parses the source code and produces some intermediated representations, such as annotated abstract syntax trees, SSA, etc. The high level analyses uses the results of the low level analysis to produce different class and method representations such class hierarchies, class usage graphs, and call graphs. Furthermore, high level analyses may also be based on results from other high level analyses to provide an even higher level of abstraction (e.g. representations using packages and class graphs annotated with various metrics to derive components). Visualization depicts the available information with static pictures and dynamic animations. This process is usually user interactive, letting the user decide where to focus and what to visualize. Information Focusing is the process of abstracting, compressing and fusing program information on the program models and its visualizations, in order to reduce the complexity. The high level analysis can be considered as a focusing of the information. Other approaches are to use name filters and cuts to focus on certain parts of the program. Interactions of these tasks are depicted in Figure 1, where extraction denotes the low level analysis and analysis the high level analysis described above. The above discussion shows that one can use numerous tools for the same tasks, where each task provides the user with a different representation: Architecture Representation, Class Representation, and Source Representation, cf. Figure 2. The Architecture Representation captures hierarchies of components and connectors. The Class Representation captures methods and classes and their mutual relations (calls, usage, containment, inheritance). The contains the complete definition of the program. It could be source code, 1 Note: MS Excel can visualize, and be programmed to perform analysis. However, it is not designed to perform analysis itself.
}
Architecture Level Representation
Class Level Representation
}
public class Example { public void Example() { } public void main() { println("How are you?"); println("I am fine"); int x = 5; }
public class Example { public void Example() { println("This is a test"); } public void main() { println("How are you?"); println("I am fine"); int x = 5;
}
}
public class Example { public void Example() { println("This is a test"); } public void main() { println("How are you?"); println("I am fine"); int x = 5;
}
public class Example { public void Example() { } public void main() { println("How are you?"); println("I am fine"); int x = 5;
}
public class Example { public void Example() { println("This is a test"); } public void main() { println("How are you?"); println("I am fine"); int x = 5;
public class Example { public void Example() { println("This is a test"); } public void main() { println("How are you?"); println("I am fine"); int x = 5;
}
public class Example { public void Example() { } public void main() { println("How are you?"); println("I am fine"); int x = 5;
Source Level Representation
Figure 2. Representation levels.
AST, or some other intermediate representation from the field of compiler design. Table 2 gives an overview of the tools mentioned above according to their application area (analysis, focusing, visualization) and their level of abstraction2 . The focusing (e.g. reduction of information) capability of a tool is in many cases implemented within the analysis or visualization part of that tool. In the table, we indicate the focusing capability within a separate column. Further, the tools are grouped according to the previously described scenario3 . It should be noticed that non of the tools alone solve all tasks on all levels of abstraction, and most of them solve only a few. As a result, each engineer chooses a tailored environment, a set of tools and routines he/she is most productive with. This leads to a never ending problem of exchanging data between different programs. A framework should in general resolve many of these problems. Furthermore, a framework brings also advantages for developers of analysis and visualization tools. Existing components need not to be re-implemented, but can easily be reused within a framework. This decreases a system’s development time. The reuse also allows third parties to have their components tested and evaluated. Additionally, a framework can aid cognitive research. Program comprehension can be studied by comparing re-engineering task performed by a combination of tools within such a frame2 The classification is based on documentation, tutorials and usage of the tools. We do not have insights in the tool designs/implementations except for our own Analyzer and Vizz3D. Although not intended, misjudgement is can not be excluded. 3 Note that SHriMP is depicted in the table as a stand-alone tool. It can however be a plug-in for the Eclipse framework. A description of the Eclipse framework in relation to our framework is discussed in the related work section.
TOOLS Imagix GOOSE Analyzer Rational Rose TogetherSoft Bauhaus sv3D SeeSoft CodeGuide SHriMP Recoder libFirm PAG JProbe Jive Visualizer EVolve GraphViz VCG Graphlet yED, yFiles vizz3D WilmaScope Excel
Analysis Cls Arc x x x x x x x x x x x x
Src x x
x x x x x x
x
Focusing Cls Arc x x x x x x x x x x x x x x
Src x x
x x x x x x x x
x x
x
x x x x x x x x x
work. However, for such a framework to work well, new analysis and visualization tools must be easy to plug in.
3. A Reverse Engineering Framework In a successful framework it must be easy to add and integrate new components. These components must be able to interact harmoniously although often developed individually. This requires some mechanism to exchange data that is flexible enough to handle many different data formats. In this section, we will present such a framework. Although targeted to reverse engineering applications, we think our approach can be used in many areas where independently developed tools should fit together. We start by outlining the architecture, followed up by discussing the need for a common data representation, and end in describing a set of classes that provides the framework with a flexible extension mechanism. In the subsequent Section 4, we present our own instantiation of this framework.
3.1. Architecture We propose a framework with a core and two variation points (plug-ins) as shown in Figure 3. These are analysis and visualization (the general approach could also be to define only one variation point, i.e. for all plug-ins). Technically, the variation points are organized as directo-
Visualization Src Cls Arc x x x x x x
x x x
x x x x x x x x
x x
x x
x x x
x x x x x x x x x x
x
x x x x x x x
Src = Source Representation Cls = Class Representation Arc = Architecture Representation
ries. The respective directory contains plug-in classes that extend predefined analysis, and visualization interfaces, respectively. These classes are read in dynamically on start up to provide the framework with the different components. The plug-in classes (wrappers) just contain delegations to the actual component implementations. Any wrapper checks preconditions that must hold on the data that the actual component is analyzing or visualizing. Moreover, it performs data adaptation if necessary. For instance, an conversion of external standardized formats as GM L, GXL , etc. to our own internal data representation and vice versa. Figure 3 indicates that our framework contains a collection of such conversion adapters.
3.2. A Common Data Representation A reverse engineering framework should allow end users to combine, and easily integrate, various analysis and visualization tools suitable for their tasks. However, in order to have a properly working combination of two or more tools that been developed independently, they must be able to exchange information. For this purpose we need a common data representation that is general enough to support a variety of data4 . It must also be easy (at least possible) to rep4 The idea of using a common data representation to facilitate tool integration is of course not new, neither is the usage of an annotated graph as such a structure.
resent the required input/output format of each tool as an instance of this data structure. Furthermore, we also need some kind of a type system that tells us if a given analysis or visualization is applicable or not. In our instantiation of the framework, we have chosen an annotated graph where each graph entity (nodes, edges, and the graph itself) has a data object and a set of predicates attached to it. The annotated graph structure has the advantage that it is general; almost any kind of data can be represented as a graph, and at the same time particularly suitable for reverse engineering since many frequently used program representations (e.g. class hierarchies, UML diagrams, call graphs) can all be considered as graphs. The graph entity predicates are used as a simple, dynamic type system. Each individual tool uses these predicates to express pre- and post-conditions. For example, a call graph might be tagged with the predicates (directed=true, connected=true, nodetype=method, edgetype=call) to indicate some general graph properties as well as something about the contained program entities. A class graph node might be tagged with (type=concrete, size=221, coupling=0.876) to indicate their type and some useful metrics. Given this kind of information the framework can decide which applicable tools that are available and display them to a user. A tool is applicable to a graph if (and only if) the graph has predicates satisfying the pre-conditions of the tool. Furthermore, our instantiation of the framework is dynamic in the sense that we do not have a fixed set of predefined predicates. The framework itself knows nothing about the individual predicates, it just knows how to check them, cf. Figure 4. The fact that we have graphs as a common data structure has a number of advantages: 1. Any program analysis component that can map their result to a graph (or a set of graphs) can be plugged into the framework. 2. Any analysis that can be applied on graphs in general (e.g. topological sorting, node merging, or layout al-
VizzAnalyzer - Framework GML
GXL
...
Analyses
Core
Tool Tool
Tool Wrapper
DataManager
Converter
Converter -1
Framework
Dynamic Type Check
Figure 4. Connecting external tools with the framework using tool wrappers.
gorithms) can now be applied on every program representation. 3. Any program that can visualize graphs can be used as a visualization plug-in. In fact, we can use any visualization tool taking data as input, to which their is a mapping from graphs. Whenever an analysis produces a graph structure, its wrapper is responsible to convert the external structure to our own graph structure. In this way we make sure, that various analyses can build on each other. Similarly, the visualization wrappers must convert our graph structure to their representation. For example, assume that an end user wants to add a new analysis using some particular C++ compiler front-end that gives their result in some format X. All that is needed is then to add an X-to-graph converter and wrap the analysis with the predefined plug-in interface. Once that is done it can be plugged in and immediately make use of all the available analysis and visualization tools. The same holds if you want to add a new visualization engine using some input format Y, you need to write a graph-to-Y converter and wrap it in a plug-in interface. Additionally, there may be further restrictions on the graphs. For example, before any plug-in can perform high level analyses, it is essential that the program is parsed first and that some low-level program representation is provided. These restrictions are enforced dynamically using our type system. Each plug-in retrieves the list of applicable graphs from the frameworks central data manager. If the data manager does not contain any graphs acceptable for this plug-in, it cannot be started at all. Otherwise, it can be started interactively. The inner workings that provides this dynamical extension mechanism is presented in the next section.
Visualizations
3.3. General Framework Instantiations Figure 3. Our Reverse Engineering Framework
The framework is instantiates with so-called plug-ins. Each plug in make available a separate analysis or visualization tool. In order to plug in a new tool, the provider needs
to create an extension of the abstract class PlugIn which in turn partially implements a PlugInInterface. The extension specifies a wrapper, which delegates method calls from the framework to the tool and vice versa. According to the tool type, the wrapper can be deployed in either the analysis or visualization plug-in directory. From here, the framework reads out the available plug-ins and makes them available at run-time. The abstract class PlugIn has two main purposes. First, it holds a reference to the main GUI, so that analysis and visualization plug-ins can write out information, e.g. to a status bar. This is helpful when the plug-ins do not provide own GUIs. Second, it serves as a data manager, which stores analysis results and provides them for further analyses and visualization. Data (graphs) resulting from analysis components are stored in one structure and data for visualization (graphs containing layout information, e.g. a Java3D SceneGraph of that analysis graph) in another. The class offers setters and getters to this data. Additionally, the main GUI is provided with this data. Abstract class PlugIn and interface PlugInInterface are specified below: public interface PlugInInterface { public void initPlugIn(); public void runPlugIn(); public String toString(); } public abstract class PlugIn implements PlugInInterface{ protected static Collection analysisInfo; protected static Collection visInfo; protected static GUIInterface mainGUI; }
The abstract class PlugIn does not implements the PlugInInterface. The methods for initializing and starting the plug-in GUI and plug-in itself must be implemented by any provided wrapper: The initPlugIn method allows to initialize the plug-in. It registers at the mainGUI and is now selectable. Only, when it is actually selected, the runPlugIn method is called and the actual analysis or visualization is executed. Then input graphs are fetched from the analysisInfo and visInfo data structures, respectively. Necessary preconditions are checked, the input is adapted, and the actual task started. After analysis or visualization new created or modified graphs are converted back and stored in the analysisInfo and visInfo data structures, respectively. The framework core can be expected to use the plug-in always in sequences of: 1. initializing the plug-in, and 2. invoking the plug-in’s actual task arbitrarily often. The analyses take as input either the source code itself (low level analysis) or retrieve the results from previous analyses.
VizzAnalyzer - Framework GML
GXL
...
Core
Visualizations
Analyses
Recoder
Recoder
Analyzer
...
Analyzer
yEd
Vizz3d
yEd
Vizz3d
...
Figure 5. Our Framework with external components
4. Our Framework Instantiation Currently, our instantiation of the framework uses two analysis components and two visualizations components. Each component is in itself non-trivial and could be understood as a stand-alone tool. The tools are interacting via a general graph data structure. Our graph implementation already contains converters to the standard graph formats GML [25] and DOT [26] to simplify the adaptation process required for plug-ins. The framework instantiation is depicted in Figure 5.
4.1. Analysis Plug-Ins The Recoder is our low-level analysis component. It is an extension of the Recoder meta-programming library [12], providing a compiler front-end for Java programs and an API for accessing AST and semantic analysis results. The result of this component is a set of program representations, i.e. a RTA (rapid type analysis) based call graph, the class hierarchies, and containment tree, which is basically a filtered AST. All are naturally represented as graphs. The filtering of AST nodes is configurable; basically, all AST node types can be removed individually. Additionally, any set of packages or classes can be filtered out, as well. For example, the interaction with the system environment can be easily excluded. In an interactive comprehension process, one could also exclude parts that are already understood. The Analyzer is our high level analysis component. It uses results from low level analyses, and performs additional calculations in order to recover an architectural level representation of the system under consideration. Thereby it abstracts from source and class level representations computed by the low-level analysis. The Analyzer supports two
Figure 6. Core and yED Component kinds of high level analyses, structural analyses and metric analyses; both are represented by abstract classes that the actual analyses instantiate. Structural analyses produce new graphs; metric analyses attach metric properties to existing graphs, its nodes, and/or its edges. A special subclass of the metrics analysis are those computing distances between nodes. These distances are used to produce visualizations where the distance between individual nodes carry some information (e.g. coupling strength) or as a input to metric based clustering algorithms. Orthogonal to the above classification, is the distinction of general structural analyses and content specific analyses. The former work on any graph, the latter requires specific graphs like call graphs or class hierarchies. Aggregation and filtering works on any graph while metric based clustering algorithms require a distance metric established before. Such preconditions are checked before a content specific analysis is started.
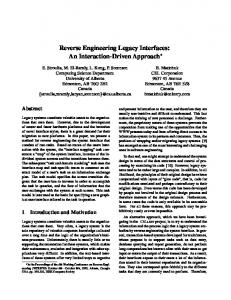
out algorithms are implemented in yEd, which arrange the items fully automatically or support the user during a manual layout. A screen-shot of our framework GUI displaying a class graph with yEd is shown in Figure 6. The Vizz3D component is an alternative graph drawing tool. It provides the flexibility to choose among a number of different metaphors (for depicting nodes, edges, and metrics) and layout algorithms, all configured dynamically. It maps the graph representations resulting from analysis to a Java3D SceneGraph. Java3D provides us with all the necessities to illustrate our analysis results interactively in parallel views with user individual metaphors and layout algorithms. The available metaphors (implemented as SceneGraph objects) are described through a metaphor-XML file. The mapping between nodes and edges of a graph and the actual metaphor is defined in a binding-XML file. Both are changeable dynamically. Figure 7 shows an example of a bubble metaphor laid out with a Gem3d layout algorithm.
4.2. Visualization Plug-Ins
4.3. Additional Features
yEd is a graph editor to generate graph drawings and apply automatic layouts to them. yEd is actually just a demo of the yFiles library, which is a Java class library for viewing, editing, layouting and animating diagrams, networks and other graph-like structures. Several sophisticated lay-
Both Analyzer and Vizz3D components are frameworks, as well, as shown in Figure 8. New analyses and layout algorithms can easily be made available at run-time, when being deployed into the corresponding analysis and layout directories. They must then conform to the respective anal-
VizzAnalyzer - Framework GML
GXL
...
Core
Analyses
Recoder
Analyzer
Analyzer Algorithms
Visualizations
...
yEd
Vizz3d
...
Vizz3d Layouts
Metaphors
Figure 8. Two Level Plug-in Architecture
Figure 7. Vizz3D Visualization Component ysis and layout interfaces. Predefined sequences of analysis and visualizations can be executed without GUI interactions. Within our framework we have integrated a scripting component (the Java Bean Shell). It allows us to specify a sequence of analyses and visualizations automatically, without user interaction. Once a certain sequence is stable, it can become a separate analysis algorithm.
5. Related Work Our framework for reverse engineering uses a central data structure to exchange the data exchange between connected tools. Therefore, we discuss first discuss alternatives for exchange formats, then other reverse engineering frameworks. We classify exchange formats as rigid, general, and flexible. Rigid formats, such as TAXForm [27] or MLMES [28], specify a predefined schema. Here, entities
produced/consumed by external tools are converted to entities of that predefined schema. The problem with such a mapping is the possible loss of information during transformation due to the limitations of the predefined schema. Hence the internal data structure might never hold the entire possible information needed by third tools. General exchange formats, such as GXL [29] and GML [25], are capable of storing any information. These formats are well suited for information exchange between various tools. Although syntactical compatible, there is in general no semantical agreement between the different entities of the data. Flexible exchange formats (which build on general formats), such as the work of [30] and our own, overcome this problem due to mappings between the schemata. In [30], an ontology specifies the entities in a model and their relationships, which can be characterized in terms of axioms and constraints in a logical language [31]. The mapping and translation of axioms between various models is done on the logical specification level as well. Instead, our mapping of modes requires direct implementations. The translation of different entities from one representation to the other is hard-coded in the wrapper and not defined on a logical specification basis. The main reason of choosing our concept is efficiency. Compared to [30], we trade elegance at integration time with efficiency at analysis and visualization time. The importance to solve the interoperability of reverse engineering tools was already mentioned on the Dagstuhl seminar [32]. The participants agreed on the necessity of interchange languages on different levels of semantic expressiveness, like abstract syntax trees and abstract syntax graphs, call graphs and program dependence graphs, architecture descriptions. Altogether, they proposed a rich but the rigid approach. While we agree on the necessity, we are
not quite sure if the standardization approach works in practice. Instead, we propose a flexible plug-in approach where adaptations and assertions on input and output data can be made in wrappers. This, in our opinion, better reflects the reality of the rather loosely connected (or even competing) community of tool provides. However, exchange formats alone cannot support the integration of various reverse engineering tools. Framework, as discussed below, implement common control and data flows. CORUM [28] is a framework that supports the interoperability between program understanding tools. CORUM provides a set of standard language independent node definitions, which take care of structural differences between languages such as COBOL programs and subprograms, C files and functions, and modules and packages of other languages. In addition, CORUM is based on the rigid exchange format MLMES mentioned above. EVolve [16] is an open extensible software visualization framework. The framework is flexible in the sense that it can visualize many kinds of data, and it is extensible in the sense that it is quite straightforward to add new kinds of visualization. The framework is designed to visualize runtime behavior of Java programs. It differs from our architecture in the sense that it uses a generic exchange format. Another difference is that EVolve is been designed for software visualization only but not reverse engineering. CoSy [18] is a framework that was designed to easily assemble new compilers from a set of components, so called engines. It was built around a central data structure; each engine could consume certain and contribute to that data structure. The final compiler was composed automatically obeying execution order restrictions of engines induced by data dependencies. Our framework is designed in the same way. It can easily be extended with new plug-ins consuming data from and adding data to the data manager. Composition, however, is done dynamically due to user interaction or scripting. Data dependencies are regarded by the dynamic checking of required data properties. CoSy is based on a generic exchange format. Eclipse [1] is a general framework, which can be used for forward, re-engineering as well as reverse engineering. Since Eclipse is a well designed and widely used platform, we initially planned to integrate into Eclipse rather than define a new framework. However, there are critical restrictions. The main difference is the dynamic loading of plug-ins. While we can drop in new analyses and visualizations at run-time, this is not possible with Eclipse. This in itself is not that crucial but that more static approach lead to some design decisions that are problematic: When an Eclipse plug-in A reuses another B it knows its interface and invokes it. A new plug-in C that might replace B must provide exactly that interface; it is
not possible to define an abstraction specifying general constraints to B and C and further suitable plug-ins. Moreover, one cannot choose between B and C interactively. Both however is possible with our dynamic plug-in policy and the dynamic type checking behind. Finally, we are planning to integrate our complete framework as a plug-in to Eclipse, i.e., we’ll have a specialized framework in a more general framework. In this way, we can keep our dynamic plug-in structure when necessary and are able to extend plug-ins from within Eclipse for our purposes. SHriMP [11] is a visualization tool that has been integrated into Eclipse. Through the extension points in Eclipse, SHriMP imports the Java and CVS API. Hence, the entire analysis is implemented in different Eclipse plug-ins. The extension SHriMP to Eclipse is a visualization component. According to the SHriMP designers [11], the tool sufferers form exactly those Eclipse induced restrictions we discussed above.
6. Conclusion The paper motivates and introduces a framework for reverse engineering. It proposes a central data structure for the exchange of information between different (foreign) analysis and visualization tools. The dynamic checking of data properties required and produced by the different analysis and visualization routines allows for integration of tools that have originally not been designed to work together. This is the major architectural difference compared with similar approaches like e.g. in the Eclipse framework. It is easier in our framework to reuse existing tool. Moreover, we introduced an implementation of the framework itself, as well as an instantiations containing several plug-ins. In the future, we plan to integrate even more foreign tools and improve our own components. Additionally, we’ll integrate our framework into Eclipse in order to get the best of both: flexibility of our framework where necessary and the rich body of plug-ins from the Eclipse world. Finally, we’ll extend our framework to integrate dynamic analyses, as well.
References [1] Eclipse. http://www.eclipse.org/, 2004. [2] S. Tilley. A Reverse Engineering Environment Framework. Technical report, cmu/sei-98-tr-005, Software Engineering Institute–Carnegie Mellon University, Pittsburg, PA 15213, April 1998. [3] S. Demeyer, S. Ducasse, and O. Nierstrasz. ObjectOriented Reengineering Patterns. Morgan Kaufmann Publishers, 2003.
[4] Imagix 4D. http://www.imagix.com/, 2004. [5] M. Bauer and O. Ciupke. An Introduction to GOOSE. In Forschungszentrum Informatik (FZI), 1999. [6] W. L¨owe, M. Ericsson, J. Lundberg, T. Panas, and N. Petersson. VizzAnalyzer - A Software Comprehension Framework. In Third Conference on Software Engineering Research and Practise in Sweden, Lund University, Sweden, 2003. [7] Rational Rose. 2002. [8] TogetherSoft. com, 2002.
http://www.rational.com,
[19] M. Alt and F. Martin. Generation of Efficient Interprocedural Analyzers with PAG. In Alan Mycroft, editor, in SAS95, Static Analysis Symposium, volume 983, pages 33–50. Springer, September 1995. [20] G. Lindenmaier. libFIRM: A Library for Compiler Optimization Research Implementing Firm. Technical Report 2002-5, 2002. [21] M. J¨unger and P. Mutzel, editors. Graph Drawing Software. Springer, 2004. [22] G. Sander, editor. Graph Layout through the VCG Tool, 1995.
http://www.togethersoft.
[9] T. Eisenbarth, R. Koschke, E. Pl¨odereder, J. Girard, and M. W¨urthner. Projekt Bauhaus: Interaktive und inkrementelle Wiedergewinnung von SWArchitekturen. In Workshop Software-Reengineering. Bad Honnef, Universitt Koblenz-Landau, Fachberichte Informatik, 1999. [10] CodeGuide. http://www.omnicore.com, 2004. [11] R. Lintern, J. Michaud, M. Story, and X.Wu. Plugging-in Visualization: Experiences Integrating a Visualization Tool with Eclipse. In Proceedings of ACM Symposium on Software Visualization, June 2003. [12] A. Ludwig. Recoder. http://recoder. sourceforge.net, 2002. [13] A. Marcus, L. Feng, and J. I. Maletic. 3D Representations for Software Visualization. In Proceedings of ACM Symposium on Software Visualization, 2003. [14] S.G. Eick, J.L.Steffen, and E.E.Sumner. SeeSoft A tool for visualizing line oriented software statistics. IEEE Transactions on Software Engineering, 18(11):957–968, 1992. [15] S. P. Reiss. Visualizing Java in Action. In Proceedings of ACM Symposium on Software Visualization, June 2003. [16] Q. Wang, W. Wang, R. Brown, K. Driesen, B. Dufour, L. Hendren, and C. Verbrugge. EVolve: An Open Extensible Software Visualization Framework. In Proceedings of ACM Symposium on Software Visualization, 2003.
[23] M. Himsolt. Graphlet: design and implementation of a graph editor. Softw. Pract. Exper., 30(11):1303–1324, 2000. [24] Microsoft Excel. http://office.microsoft. com, 2004. [25] M. Himsolt. GML — Graph Modelling Language, University of Passau. http://infosun.fmi. unipassau.de/Graphlet/GML/, 1997. [26] E.R. Gansner, E. Koutsofios, S.C. North, and K.-P. Vo. A Technique for Drawing Directed Graphs. IEEE Transactions on Software Engineering, 19(3):214– 230, March 1993. [27] I. T. Bowman, M. W. Godfrey, and R. Holt. Connecting Architecture Reconstruction Frameworks. Journal of Information and Software Technology, 42(2):93– 104, 1999. [28] S. Woods, L. O’Brien, T. Lin, K. Gallagher, and A. Quilici. An Architecture for Interoperable Program Understanding Tools. In 6th International Workshop on Program Comprehension, June 1998. [29] R. C. Holt, A. Winter, and A. Sch¨urr. GXL: Towards a Standard Exchange Format. Technical Report 1–2000, Universit¨at Koblenz-Landau, Institut f¨ur Informatik, Rheinau 1, D-56075 Koblenz, 2000. [30] D. Jin, J. R. Cordy, and T. R. Dean. Transparent Reverse Engineering Tool Integration Using a Conceptual Transaction Adapter. In Seventh European Conference on Software Maintenance and Reengineering (CSMR’03), March 2003.
[17] JProbe Suite. http://www.quest.com, 2004.
[31] C. W. Holsapple and K.D. Joshi. A Collaborative Approach to Ontology Design. Communications of the ACM, 45(2), February 2002.
[18] M. Alt, U. Aßmann, and H. van Someren. Cosy Compiler Phase Embedding with the CoSy Compiler Model. In Computational Complexity, 1994.
[32] J. Ebert, K. Kontogiannis, and J. Mylopoulos. Interoperability of reverse engineering tools. Technical report, Dagstuhl, 2001.