IOP PUBLISHING
PHYSICA SCRIPTA
Phys. Scr. T133 (2008) 014018 (5pp)
doi:10.1088/0031-8949/2008/T133/014018
Reverse engineering a spectrum: using fluorescent spectra of molecular hydrogen to recreate the missing Lyman-α line of pre-main sequence stars J L Linsky1 , G Herczeg2 and B E Wood3 1
JILA, University of Colorado and NIST, Boulder, CO 80309-0440, USA California Institute of Technology, Pasadena, CA 91125, USA 3 Naval Research Laboratory, Space Science Division, Code 7660, Washington, DC 20375, USA 2
E-mail:
[email protected]
Received 17 September 2008 Accepted for publication 19 September 2008 Published 19 December 2008 Online at stacks.iop.org/PhysScr/T133/014018 Abstract The hydrogen Lyman-α (Lyα) line, a major source of ionization of metals in the circumstellar disks of pre-main sequence (PMS) stars, is usually not observed due to absorption by interstellar and circumstellar hydrogen. We have developed a technique to reconstruct the intrinsic Lyα line using the observed emission in the H2 B-X lines that are fluoresced by Lyα. We describe this technique and the subsequent analysis of the ultraviolet (UV) spectra of the TW Hya, RU Lupi and other PMS stars. We find that the reconstructed Lyα lines are indeed far brighter than any other feature in the UV spectra of these stars and therefore play an important role in the ionization and heating of the outer layers of circumstellar disks. (Some figures in this article are in colour only in the electronic version.)
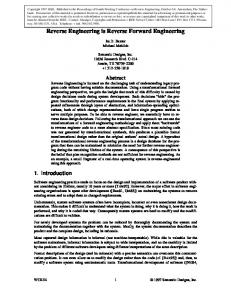
We found that 194 of the emission lines observed by STIS are transitions from 25 levels in the H2 B electronic state to vibration–rotation levels in the ground electronic state. Herczeg et al (2006) found that 22 of the 25 levels in the B electronic state are populated by radiative transitions from excited levels in the ground electronic state (see figure 2) at wavelengths between 1212.426 and 1219.368 Å that is within the broad Lyman-α (Lyα) emission line. Three of these levels are populated by radiation at 1548.146 Å, which is coincident with the C IV emission line. Thus, Lyα pumping is responsible for nearly all of this fluorescent H2 spectrum. Figure 3 shows the wavelengths of these pumping transitions compared with the observed Lyα line. Figure 3 clearly shows that much of the intrinsic Lyα emission line is not detected due to interstellar and circumstellar Lyα absorption. Despite this strong absorption, the observed Lyα line is by far the brightest feature in TW Hya’s UV spectrum and is responsible for the observed fluorescent H2 emission. Since the radial velocity of the H2 gas is the same as the photosphere for this edge-on disk
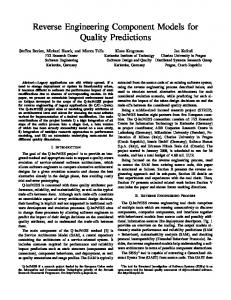
1. From the observed H2 spectrum to the properties of the H2 gas in the disk of TW Hya Pre-main sequence (PMS) stars exhibit rich ultraviolet (UV) spectra containing many emission lines formed in their chromospheres, circumstellar disks, accretion shocks and jets. In their survey of PMS stars with the International Ultraviolet Explorer satellite, Johns-Krull et al (2000) and Valenti et al (2000) noted that emission lines of H2 are prominent in the spectra of many of these stars. We have followed up on this survey with higher resolution spectra of PMS stars obtained by the Space Telescope Imaging Spectrograph (STIS) instrument on the Hubble Space Telescope (HST) beginning with the nearest classical T Tauri star, TW Hya. Figure 1 (from Herczeg et al (2002)) shows a small portion of this TW Hya spectrum. In the complete STIS spectrum, H2 emission lines are detected between 1202 and 1636 Å. Other H2 emission lines are detected at shortened wavelengths in spectra obtained by the Far Ultraviolet Spectrograph Explorer (FUSE) spacecraft. 0031-8949/08/014018+05$30.00
1
© 2008 The Royal Swedish Academy of Sciences
Printed in the UK
Phys. Scr. T133 (2008) 014018
J L Linsky et al
Figure 1. A portion of the HST/STIS E140M spectrum of TW Hya. Lyman-band transitions of H2 that are pumped by Lyα are labeled. Some of these transitions are too weak to be detected. A total of 146 fluorescent H2 lines pumped by Lyα are observed in the HST/STIS spectrum. See Herczeg et al (2002).
Figure 3. HST/STIS E140M spectrum of the Lyα line of TW Hya. The solid lines indicate pumping transitions with definite detections of fluorescent H2 emission lines. Dashed lines indicate transitions where the fluorescent lines are tentatively detected. See Herczeg et al (2002).
Figure 2. Energy levels calculated by Abgrall et al (1993) for the ground (X) and excited (B and C) electronic levels of H2 . Lyman band transitions (B–X) typically occur in the UV range observed by HST/STIS, while Werner band (C–X) transitions occur in the far-UV (FUV) range observed by FUSE. Solid lines indicate transitions pumped by Lyα leading to observed fluorescent emission lines. Dashed lines indicate transitions that can be pumped by Lyα but do not lead to detected fluorescent emission. Note that the levels in the ground electronic state have vibration–rotation energies as large as 4.2 eV, indicating that the H2 gas in the disk is warm (about 2500 K), but the highest energy levels may be non-thermal. See Herczeg et al (2002).
Figure 4. Inferred physical properties of the H2 gas in the disk of TW Hya based on pumping by the reconstructed Lyα line. Shaded regions show the 1–5σ areas of T–N(H2 ) space allowed by errors in the reconstructed Lyα line and the solid lines indicate the 1–5σ contours for the fits to the H2 lines. Dots indicate the parameter space that we rule out because those parameters predict that lines pumped by 7–4 P(5) should be observed, and the diagonal lines indicate the parameter space ruled out because many additional other progressions should be observed but are not detected. Filling factor contours (dashed lines) of 0.125–4.0 are also shown. A filling factor above 1 is unphysical. Three models with acceptable reconstructed Ly profiles are shown as asterisks. See Herczeg et al (2004).
system, the H2 gas is most likely located in the circumstellar disk. Thus, an accurate determination of the intrinsic Lyα emission line flux and profile is needed to infer the physical conditions in the disk. We therefore need to reconstruct, that is reverse engineer, the Lyα emission line for TW Hya and other PMS stars.
on the temperature and column density of the slab, the strength of Lyα emission at the pumping wavelength, FLyα , and the solid angle filling factor, η, subtended by the H2 gas as seen from the Lyα emission source. We calculate a Voigt absorption profile for each pumping transition. The Lyα flux FLyα at the pumping wavelength is given by
2. Reconstructing the Lyα line profile and flux We use the observed fluorescent H2 lines to reconstruct the Lyα emission at each pumping wavelength by assuming that the H2 gas resides in a warm, plane-parallel slab, following the procedure described by Herczeg et al (2004). The total emission from an H2 upper level, FH2 , is proportional to the oscillator strength, f , of the pumping transition, the population of H2 in the lower level, NL (H2 ), which depends
FH2 / f ηN L (H2 ) . −τλ (T,N (H2 )) ]dλ λ [1 − e
FLyα = R
2
(1)
Phys. Scr. T133 (2008) 014018
J L Linsky et al
Figure 5. Reconstructed Lyα line profiles for the six TTSs. The intrinsic Lyα emission at many pumping wavelengths (solid circles) is calculated using the detected H2 emission from each pumped upper level, the effective equivalent width of the plane-parallel slab, and the estimated volume filling factor of the warm H2 gas as seen by the Lyα emission region. Both the observed and reconstructed fluxes shown here are dereddened. Upper limits (arrows) are calculated using upper limits of the total flux from each Lyα-pumped H2 upper level. For RU Lupi, DF Tau and TW Hya, we compare the reconstructed to the observed Lyα emission (shaded). The vertical dotted lines indicate the stellar photosphere rest wavelength of Lyα. The dashed lines are the combination of a Gaussian emission and a central absorption profile fit to the reconstructed Lyα profile of TW Hya, scaled to match the reconstructed Lyα flux points for each star.
The H2 flux from the upper level is corrected for dissociation and the angular dependence of the photons escaping the disk. The integral is the effective equivalent width of the pumping transition for a plane-parallel slab with temperature T and column density N (H2 ). We assume that the disk geometry and gas properties used by Herczeg et al (2004) to model H2 fluorescence from TW Hya, in particular T = 2500 K and log N (H2 ) = 18.5, apply to our entire sample. Any difference in the incidence angle between the incoming radiation and the disk surface will only change the effective column density. Figure 4 shows the ranges of temperature and H2 column density in the disk that are consistent with this analysis.
3. Lyα lines in other PMS stars and ionization of disks Herczeg et al (2008) are now analyzing the fluorescent H2 spectra of six PMS stars observed by STIS and reconstructing their Lyα line profiles. We report here on our preliminary analysis of these data. Figure 5 shows that portions of the red wings of two PMS stars, RU Lup and DF Tau are detected, but no portions of the Lyα profiles of the other three stars, DG Tau, V836 Tau, and T Tau, are detected. Using the method previously described, we have calculated the intrinsic Lyα emission and upper limits at the pumping wavelengths. This analysis allowed us to compute the total Lyα flux and to 3
Phys. Scr. T133 (2008) 014018
J L Linsky et al
Figure 6. Relative intensity of Lyα emission in the disk as a function of neutral hydrogen column density N (H I), measured perpendicularly inwards from the disk surface. Left: scattering by H I amplifies the Lyα intensity at logN (H) = log[N (H I) + 2N (H2 )] < 20, but with increasing path length, stellar Lyα photons do not penetrate as far into the disk as non-Lyα FUV photons. Centre: the penetration depth of Lyα into the disk is similar for an entrance angle of 11.5 ◦ at 10 AU and 17.5 ◦ at 100 AU. Right: the Lyα emission may be less amplified but penetrate to larger N (H) when the total N (H I) column density at the disk surface is small, which could happen if the H/H2 transition occurs close to the disk surface. The three curves are for models where the H/H2 transition occurs at different values of N (H I). In each model, the Lyα emission irradiating the disk was estimated from the reconstructed Lyα profile of TW Hya.
compare it with the other UV emission lines and continua. We find that the reconstructed Lyα line contributes 75–90% of the total UV emission for three of the stars (TW Hya, DF Tau and V836 Tau) but only 10–15% of the total UV flux for RU Lupi and T Tau. The bright Lyα line plays an important role in the ionization and heating of the outer layers of the circumstellar disks of PMS stars. Figure 6 shows that Lyα dominates the input ionizing flux down to a column depth of logN (H I) ≈ 20 under a variety of conditions. Figure 7 shows that at a distance of 30 AU from TW Hya, Lyα and stellar FUV radiation are more important than interstellar radiation, which is incident from all directions, to even larger hydrogen column densities measured from the surface of the circumstellar disk.
4. Summary
Figure 7. The total FUV radiation field (black line) in the disk versus N (H I) measured inward from the disk surface at 30 AU from TW Hya. The FUV radiation incident on the disk is a combination of stellar Lyα photons (red line) and other stellar FUV photons (blue line), which strike the disk at α = 17.5◦ , and interstellar FUV photons (green line), which enter the disk at all angles. The Lyα radiation penetrates to larger N (H I) when the H/H2 transition occurs at logN (H I) = 19.0 (right), relative to models where the transition occurs at larger logN (H I).
(i) Although the strong Lyα line is mostly or completely hidden from view in CTTSs, we describe a method for reconstructing the Lyα line from the observed fluorescent H2 emission. (ii) The reconstructed Lyα emission contributes between 75 and 90% of the total FUV emission from TW Hya, DF Tau and V836 Tau, but only 10–15% of the total FUV emission from RU Lupi and T Tau. This difference results from the much higher effective filling factor for RU Lupi relative to TW Hya and DF Tau. Since the
H2 emission from RU Lupi is produced by outflows, we attribute the different effective filling factors to the different geometries. 4
Phys. Scr. T133 (2008) 014018
J L Linsky et al
(iii) The lower limit of the total FUV emission ranges from 3 × 10⁻³ L to 3 × 10⁻² L . The total Lyα emission depends on the effective filling factor of H2 as seen by the Lyα-emitting gas.
References Abgrall H, Roueff E, Launay F, Roncin J Y and Subtil J L 1993 Astron. Astrophys. Suppl. 101 273–321 Herczeg G J, Linsky J L, Valenti J A, Johns-Krull C M and Wood B E 2002 Astrophys. J. 572 310–25 Herczeg G J, Wood B E, Linsky J L, Valenti J A and Johns-Krull C M 2004 Astrophys. J. 607 369–83 Herczeg G J, Linsky J L, Walter F M, Gahm G F and Johns-Krull C M 2006 Astrophys. J. Suppl. 165 256–82 Herczeg G J, Linsky J L and Wood B E 2008 in preparation Johns-Krull C, Valenti J A and Linsky J 2000 Astrophys. J. 536 815–33 Valenti J A, Johns-Krull C and Linsky J L 2000 Astrophys. J. Suppl 129 399–420
Acknowledgments This work is funded by Space Telescope Science Institute grant AR-9930 to the University of Colorado. This work is based on observations made in programs 7718, 8041 and 8157 (PIs J L Linsky and F M Walter) of the NASA/ESA Hubble Space Telescope, obtained at the Space Telescope Science Institute, which is operated by the Association of Universities for Research in Astronomy, Inc., under NASA contract NAS5-26555.
5