Abstract. Understanding the behaviour of distributed applications is a very challenging task, due .... Our work centers around the development of tools to derive.
Reverse-Engineering Distributed Applications to Understand their Behaviour Thomas Kunz
April 1994
? TI{3/94 Institut fur Theoretische Informatik Fachbereich Informatik Technische Hochschule Darmstadt
Reverse-Engineering Distributed Applications to Understand their Behaviour Thomas Kunz Institut fur Theoretische Informatik Technische Hochschule Darmstadt April 1994
Abstract Understanding the behaviour of distributed applications is a very challenging task, due to their complexity. To manage this complexity, the top-down use of suitable abstraction hierarchies is frequently proposed. Given the size of distributed applications, manually deriving such abstraction hierarchies seems not realistic. This paper discusses tools that automate the derivation of suitable abstraction hierarchies and reports on initial experience with these tools. These abstraction hierarchies enable a top{down approach to the behaviour understanding task, keeping the overall amount of information manageable. We modi ed an existing prototype visualization tool to provide abstract visualizations of an execution. A user can navigate through the abstraction hierarchies derived with our tools, displaying an execution at various levels of abstraction. Examples of such abstract visualizations for the execution of one speci c distributed application are given. In general, the abstractions derived represent meaningful parts of the application: they can be interpreted in terms of the application domain.
1 Introduction Empirical evidence shows that programmers spend the majority of their time on program maintenance tasks [13, 21]. A common rst (and di�cult) step in all maintenance tasks is to gain an understanding of the application at hand. Particularly highly complex applications are expensive to maintain, see for example [7]. The associated costs necessitate appropriate tools to assist in reconstructing and analyzing information in existing programs to aid programmers in debugging, enhancing, modifying, and/or rewriting them. Such tools can simplify the project management task too, increasing the understanding of managers about the software systems for which they are responsible [63]. This paper focusses on one aspect of the program understanding task, namely understanding the behaviour of an application. We will call this task behaviour understanding. To present behavioural information, visualizations of the execution are used frequently, see for example [11, 47, 68]. This paper discusses 1
tools to facilitate behaviour understanding for one speci c class of applications, distributed applications. It is frequently claimed that the 1990s will be the decade of distributed systems [45, 51]. However, an exact de nition of what constitutes a distributed system is hard to give. Typically, a list of symptoms characterizing such a system is provided, such as: multiple processing elements, interconnection hardware, independent failure of processing elements, and shared state among the processing elements. Distributed applications are the programs executing on a distributed system. They have characteristics matching those of distributed systems. Schill [56], for example, gives a list with the following characteristics: cooperation of loosely-coupled, distributed autonomous entities, complex structure, topological irregularity, intensive remote communication, dynamically changing communication patterns, separation of address spaces, and dynamic con guration changes. It follows from the characteristics of distributed applications that they are di�cult to understand and to maintain [27, 34]. Some of the more frequently cited reasons are:
� � � � �
parallelism, non-deterministic execution, lack of a global component (clock, memory, etc.), signi cant and variable communication delays, and a tendency towards large size.
These characteristics make distributed applications simultaneously highly complex and hard to understand. Mullender, for example, notes that \all [problems] exist in all computer systems, but they are much more apparent in distributed systems; there are just more pieces, hence more interference, more interconnections, more opportunities for propagation of e�ect, and more kinds of partial failure." [45, p. 11] To reduce this complexity, a number of approaches are proposed in the literature to enable a programmer to work at abstract levels, ignoring details of the implementation. Some of these proposals are the use of high-level distributed programming languages such as Orca [6] or NIL [48], parallelizing compilers [12, 31], or special midware layers of software like DCE from the Open Software Foundation or the advanced networked systems architecture (ANSA) [28, 43]. None of these approaches provides (as yet) a satisfying solution to the complexity problem. Therefore, our work is based on the following assumptions. First, humans still have to cope with the complexity of distributed applications explicitly. Second, the only reliable source of information about an application is the source code itself, see also [15, 54, 55]. Third, a top-down approach towards behaviour understanding should be supported. A top-down approach starts with the component at the top of a hierarchy and successively moves to the next lower level [33]. In the context of behaviour understanding, a hierarchy of abstract behaviour visualizations can be used to minimize the complexity involved. Typically, a programmer starts the understanding task by trying to gain a global 2
overview [35, 58]. This can be achieved by viewing an application execution at a very high level of abstraction. In the course of the understanding process, more di�cult or interesting parts of the application are isolated and examined at a lower level of abstraction. In this way, more and more detailed information is collected for smaller and smaller parts of the application, keeping the overall amount of information collected manageable. The process continues until all aspects of interest are su�ciently understood. Ideally, more than one abstraction hierarchy should be employed, each hierarchy emphasizing di�erent aspects of the program behaviour. A programmer or maintainer could then switch between these hierarchies, depending on his or her current focus of attention. Good abstraction hierarchies, however, are di�cult to construct. In the best of worlds, appropriate abstractions would be de ned during the initial implementation of an application. However, where descriptions of abstractions are just additional design documents, we expect that they will be missing or not being up-to-date frequently. Alternatively, the abstractions could follow the structuring concepts provided by a programming language. Given that the source always re ects the current application correctly, such abstractions would always be upto-date. Our experience, however, shows that such structural information is not available or su�cient in the general case either. Programmers typically approach the understanding task by mentally abstracting the application at hand, using information from the software source, related documents, and previous experience. This abstraction process is tedious and errorprone for complex applications. Our work centers around the development of tools to derive suitable abstraction hierarchies automatically. This paper brie y describes two abstraction tools and reports on our initial experience with them. Our tools are examples of reverse engineering tools for distributed applications. Reverse engineering aims to reconstruct a possible design of an application by using the software system as the only information source [15]. To achieve this goal, reverse engineering tools usually extract semantic clues from the source code by a static analysis, see for example [20]. The results of this analysis are frequently either transformed into data ow diagrams [10] or stored in a relational database [18] for further processing. In addition, to analyze the behaviour of applications, dynamic information is collected, see [21, 54]. Existing reverse engineering tools are not only relatively primitive, but also very di�cult to adapt to a parallel and distributed environment. This paper presents new reverse engineering tools for a distributed environment. The tools derive a tree-structured hierarchy of abstractions. Limiting abstraction hierarchies to tree-structures excludes the sharing of components by multiple abstractions. This restriction is introduced for both pragmatic and semantic reasons. Shared components increase the complexity of the recognition process [8, 9]. Furthermore, disjunct abstractions are frequently employed by other researchers too, either by merging all abstractions that share components [44] or by de ning abstractions in a way that guarantees empty intersections [2]. The underlying reason is that abstractions should represent meaningful, clearly separated logical units of the application execution. To be able to utilize dynamic information, abstraction hierarchies have to be derived a posteriori. First, the execution of an application is traced. Then, abstractions are derived and identical re-executions of the application can be visualized at various abstraction levels. In distributed systems, such deterministic re-executions are not guaranteed, see also [26]. However, 3
a number of methods have been developed to support deterministic re-executions [42, 46, 64]. This paper therefore assumes that deterministic re-executions are possible, enabling such an a posteriori approach. The sample application discussed in this paper is written in Hermes, a high-level, processoriented language for distributed computing [4, 59]. We have chosen Hermes from the large number of distributed programming languages (for a survey, see [5, 65]) for a number of reasons. First, following [29, 66], a complete programming model for distributed applications consists of two separate pieces: the computation model, which allows programmers to build a single computational activity, and the coordination model, which binds separate activities into an ensemble. In Hermes, this coordination model is its process model. Hermes processes are created and terminated dynamically and communicate and synchronize by synchronous and asynchronous message passing. Not only has this model been incorporated into a number of other computational languages [67], the embodied message-passing paradigm is a very common one in distributed computing. This facilitates porting our results to environments with a similar coordination model. Second, processes in Hermes are both the unit of parallelism and modularization, see [22]. Even a moderate Hermes application consists of a large number of processes. Hermes therefore is a convenient vehicle for testing our ideas in a complex environment. A last, more pragmatic reason is that we had access to the sources of an existing visualization tool for Hermes applications [61]. This paper is organized as follows. After this introduction, a visualization frequently used to depict distributed executions is shown. Next, two tools to derive suitable abstractions automatically are presented. Using a sample distributed application, di�erent abstract visualizations of one execution are given. The paper concludes with a summary of our work and reports on future work.
2 Visualizing Distributed Executions When reasoning about distributed executions, an event-based approach is typically employed. Following [41], each process or autonomous entity is viewed as a totally ordered sequence of atomic events. An event can be thought of as the instant at which some computation is completed. Events constitute the lowest level of observable behaviour. They could be de ned according to the particular aspect a speci c observer is interested in. An observer interested in the le system might de ne events related to the completion of le open, read, write, and close actions. Similarly, an observer interested in security issues could de ne events related to encryption and decryption computations. However, a more general and xed set of events is most commonly used. The lowest level of observable behaviour in a distributed system, the primitive events, are events that relate processes to another, such as sending and receiving messages or process creation and termination. It is assumed that the local (sequential) computation for each process can be dealt with using traditional approaches. As discussed before, a distributed application consists of a number of autonomous and sequential processes, cooperating to achieve a common goal. Cooperation includes both communication and synchronization and is achieved by the exchange of messages. Both synchronous and 4
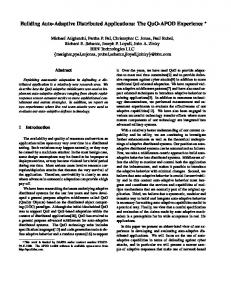
asynchronous message passing is allowed. The communication channels may or may not have FIFO property. Processes can be created and terminated dynamically. This is graphically depicted in Figure 1. P1 P2 P3 IPC events
process creation events
time
Figure 1: Model of a Distributed Execution In these process-time diagrams, one dimension represents processes and the other dimension represents time. In Figure 1, time ows from left to right. Messages are drawn as arrows, connecting the corresponding send and receive events. Asynchronous message passing is depicted by slanted arrows, indicating that sending a message occurs before it is received. Synchronous message passing is drawn as a vertical arrow to indicate that sending and receipt of a message occur at the same moment. Such diagram are used widely, see for example [17, 24, 41, 52, 57]. Process-time diagrams contain two di�erent entities: processes and primitive events. The two abstraction tools implemented derive abstractions based on these two entities. They recursively group more primitive entities into more abstract entities. The sample abstract visualizations discussed later will demonstrate that the abstractions derived by our tools are not just arbitrary groups of more primitive entities, but do in fact represent meaningful entities of the execution.
3 Automatic Process Clustering Process abstraction allows groups of processes to be combined into clusters, eliding the interaction among processes in the cluster. Combining clusters into higher-level clusters leads to an abstraction hierarchy. Two problems must be addressed when employing process clusters for abstract behaviour visualizations:
� how to represent a process cluster graphically, and � how to determine appropriate clusters. The solution to the rst problem is based on the idea of a cluster interface. The cluster interface is de ned by communication events that have a partner event outside the cluster. 5
The visual display of these events should resemble the one for processes, so that a user essentially sees the same type of display at di�erent levels of abstraction. However, if the visible behaviour of the cluster contains concurrent events, it is important not to distort the actual precedences by placing them as if one preceded the other across the cluster interface. Representing a cluster by one totally ordered event trace is therefore, in general, not possible. Instead, a set of totally ordered traces is needed, with the number of traces being equal to the dimension of the partial order of the events in the cluster interface. Some of the problems and their solutions in constructing cluster interface traces are discussed in [19, 60, 62]. A second problem is the identi cation of the appropriate processes and subclusters to be combined. The tool we developed clusters processes using semantic information that characterizes application processes and information about the actual interprocess communication at runtime. A rst characteristic collected for each application process is its type. Several process taxonomies based on interprocess communication have been proposed [14, 30, 40]. These taxonomies vary in the number of categories they include, but they all divide processes into three broad categories: workers, servers, and shells or coordinators. Shells are processes that create and connect other processes only. Server processes o�er one or more services in an endless loop. All other processes are called workers, advancing the state of the computation. We deliberately do not call them clients because the term client usually implies that the process calls a server. This, however, is not necessarily true for worker processes. In reality, processes do not necessarily belong to strictly one category. For example, we have found no examples of pure shells. Usually, a server or worker takes over the role of a shell as well, creating other processes as part of its own initialization. Therefore, the number of di�erent process types was reduced to two: workers and servers. The process type is determined by a static analysis of the process source. If no static source analysis can be performed (due to missing sources), the default process type is worker. A second characteristic is the process complexity. A process is de ned to be complex if it calls other application processes; otherwise, it is simple. This characteristic cannot be determined by a static source analysis but depends on the actual IPC at runtime. It is determined by analyzing the interprocess communication that occurs during the traced execution. A third and nal characteristic of each application process is its name. In summary, a process is characterized as follows: 1. type (worker or server), 2. complexity (simple or complex), and 3. process name. The last characteristic is used to identify processes. The rst two characteristics are used by the clustering rules. These rules describe patterns of processes with certain types and interprocess communication structure that can be clustered. Furthermore, these characteristics are determined not only for application processes but are also assigned to the process clusters derived by the clustering rules. By using the same semantic description for both processes 6
and process clusters, the clustering rules can be applied recursively, creating a multi-level hierarchy of process clusters. The derivation of appropriate clustering rules is based on the following idea. Programming paradigms are collections of conceptual patterns that in uence the design process and ultimately determine the structure of a program [3, 25]. By analyzing programming paradigms used for distributed programming, potential program structures can be identi ed. Using rules that describe these structures, our tool analyzes the runtime behaviour of a distributed application and automatically generates a hierarchy of process clusters. A total of ten di�erent clustering rules have been identi ed and implemented. Figure 2 summarizes them; for a more detailed description see [37, 38]. The gure gives a typical example for the application of each rule. Processes are represented by single characters, indicating the process type: W for a process of type worker, S for a process of type server and � for a process of arbitrary type. IPC connections that have to exist for a speci c rule to be applicable are drawn as solid arrows. Where other connections might exist, this is indicated by a dashed line with double arrows. All processes that are clustered by the corresponding rule are surrounded by a dashed box. The resulting cluster semantics are omitted from this picture. The layered system rule, based upon the layered system paradigm, analyzes and clusters all application processes at the same time, creating a number of new higher-level process clusters. It assigns processes into clusters such that all processes in cluster i only communicate with processes in the same cluster or cluster i + 1. All other rules describe substructures within a distributed application. Multiple instances of the structure described by the rule might exist in parallel and will be discovered when applying the rule. They can be further divided into the subcategories: linear substructures, biconnected substructures, and others. The rules in the linear substructure category describe IPC relations where one process calls or is called by exactly one other process. In biconnected substructures, a set of processes communicates in such a way that the removal of a single communication link still has the process set at least weakly connected. An example of a clustering rule not in either category is the divide & conquer clustering rule, which looks for and clusters multiple process sets with, among other things, identical IPC substructures. One example for a rule describing a linear substructure is the master-slave rule, derived from the master-slave paradigm. It scans all processes for simple workers that are called from exactly one other process and clusters these processes with the calling process. The underlying notion is that the calling process passes on some of its work to the worker process being called. The calling process can be of type server or worker. The resulting cluster is assigned the name and type of the calling process. Other rules in this category are the client-server rule, the complex server rule, the administrator concept rule, the compute-aggregate-broadcast rule, and the pipeline & filter rule. Biconnected substructures describe sets of processes that communicate in such a way that the removal of a single communication link still leaves the process set at least weakly connected. Two rules describing such structures have been derived: the peer groups rule and 7
* W
S
W W
S
Master-Slave
S
Client-Server
S
S S
W
Complex Server
* W
*
Administrator Concept
*
ComputeAggregateBroadcast *
W
* *
W
Pipeline & Filter
W W
Peer Groups
W
W
W
W
W
W S
S
Iterative Relaxation * Divide & Conquer
* required communication *
potential outside communication
*
W worker process *
*
S server process
*
* arbitrary process type
Layered System
Figure 2: Overview of the Clustering Rules
8
the iterative relaxation rule. Both rules have in common that, within the set of processes to be clustered, no process is more important than any other. Contrary to the linear substructures discussed above, the name and type of the resulting cluster can therefore not be deduced from one of the existing processes. Instead, the clusters will be assigned unique names and the default type worker. The peer groups rule is derived from a generalization of the result parallelism paradigm discussed in [16]. This paradigm proposes a structure for distributed applications such that a series of values is produced with predictable organization and interdependencies of the application processes. One likely IPC structure under this model is a group of interconnected worker processes. The second rule, iterative relaxation, describes a special case of the peer groups rule. The iterative relaxation paradigm postulates a design in which adjacent regions are assigned to di�erent processes. Each process carries out activities local to its region, communicating with neighbours when necessary. This communication with the neighbours is, in general, symmetric. Therefore, we impose the additional requirement that in a set of worker processes that forms a peer group, the communication between any pair of communicating processes is bidirectional. The only clustering rules not belonging to any of the previous categories is the divide & conquer rule. The divide & conquer paradigm postulates a problem solving approach that splits the original problem into identical smaller problems which are then solved in parallel. Given that the subproblems are identical, the application should contain numerous instantiations of the same process set (necessary to allow the processing of the subproblems in parallel). The processes within each set communicate with each other following the same pattern. Furthermore, they only communicate with the same external processes. Con icting cluster alternatives exist whenever one process is clustered by di�erent rules with a di�erent set of processes. Since we are interested in the derivation of a tree-structured cluster hierarchy, these con icts must be resolved. Rather than determining a priori a xed order of rule application (which would be hard to justify), we added a quantitative cluster evaluation measure [36] to the tool. This measure serves two purposes. First, it suppresses the derivation of clusters that are poor. Second, it is used to resolve clustering con icts. In a rst round, all clustering rules are applied in parallel, but no clusters are formed yet. If a process could belong to two possible clusters, only the cluster with the best quantitative evaluation is built. The measure calculates the cohesion of a process cluster as well as the coupling between a process cluster and the rest of the application on a scale from 0 to 1. According to the software design criteria high cohesion, low coupling, we expect good process clusters to show a higher degree of cohesion than coupling. The research reported in [36] con rms that this quantitative measure accurately re ects a human evaluation of the same clusters for all test cases. Ultimately, we are interested in minimizing behaviour understanding e�ort. But it is extremely di�cult to single out and evaluate the contribution of speci c process clusters to the overall behaviour understanding e�ort. Therefore, our measure quanti es the adherence of a process cluster to a well{known modularization principle. Following [23], we hypothesize that process clusters adhering to good software design principles are easier to understand. 9
The evaluation measure is based on the similarity measure de ned in [49]. This measure uses a characteristic vector for each entity (process, software module, etc.) that counts the references to particular data types within the entity. To adopt the similarity measure to Hermes, special emphasis was placed on types used for IPC. This is motivated by the fact that our approach towards understanding distributed applications focusses on processes and interprocess communication, and abstracts from the internal design of a process. Vectors counting references to all such data types are determined by a static analysis of the process sources. The pairwise similarity between any two processes is calculated as: TY Sim(X; Y ) = jjXX jj� jjY jj
where X T Y is the inner product of the characteristic vectors X and Y and jjX jj and jjY jj are their Euclidean norms. The characteristic vectors used to calculate the pairwise similarity are determined by a static source analysis. Consequently, multiple instantiations of the same process source are indistinguishable. However, we are applying the measure to all processes created during the execution of a distributed application, and so multiple instantiations of the same source occur frequently. While these processes will be assigned identical characteristic vectors, they will, in general, di�er in their communication behaviour. To be able to di�erentiate between multiple instantiations of the same process source, the following lter operation is performed on the pairwise similarities, using information about interprocess communication at runtime.
8 >> Sim(X; Y ) < Sim(X; Y ) Simf (X; Y ) = > Sim >: 0 (X; Y )
if X and Y are instantiations of the same source if both X and Y are unique instantiations of their source if X and Y communicate with one another otherwise
The pairwise similarity between two processes is reduced to zero ( ltered) if one or both of them has sibling instantiations, they are instantiations of di�erent source modules, and they do not communicate with each other. Using the ltered measure, coupling and cohesion for a process cluster P are de ned as follows. The cluster cohesion is the average pairwise similarity of processes within the cluster, counting each process pair only once: P Sim (p ; p ) f i j Cohesion(P ) = i>j m(m ? 1)=2 where P is a set of processes fp1; : : :; pmg. Similarly, the coupling of a process cluster with its environment is calculated as: P Sim (p ; q ) Coupling(P ) = i;j m �f n i j 10
Case a) Source A
Source A
Source B
Source B
Cohesion(P) = 1.0 Coupling(P) = 0.5
Case b) Source A
Source A
Source B
Source B
Cohesion(P) = 1.0 Coupling(P) = 0.5
Case c) Source A
Source A
Source B
Source B
Cohesion(P) = 0.0 Coupling(P) = 1.0
Process Interprocess Communication Process Cluster
Figure 3: The E�ect of the Filter Operation
11
where P is a set of processes fp1 ; : : :; pm g and fq1 ; : : :; qn g is the set of application processes not in P . The quality of P , Q(P ), is then de ned as: Q(P ) = Cohesion(P ) ? Coupling (P ). The e�ect of the ltering operation is demonstrated in Figure 3. The four processes in this example are instantiations of two di�erent source modules. To keep the discussion simple, we assume that the pairwise (un ltered) similarities are all equal to 1. Three di�erent possibilities of clustering the processes into two clusters are shown. For each case, the coupling and cohesion values for the two (symmetric) process clusters are given. The rst two cases show the cluster possibilities that intuitively make sense: clustering all processes that are instantiations of the same source and clustering the processes that communicate with each other. In these two cases, Q(P ) = 0:5 > 0. Clustering the processes in the way indicated by the third case is intuitively less appealing and the resulting cluster quality Q(P ) is less than 0. Without the ltering operation, all three cases would be evaluated identically, with Q(P ) = 0. For a more detailed discussion of this ltering operation see [36]. The process clustering tool consists of a collection of applications sharing information via les, as shown in Figure 4. Information about the actual communication between processes is obtained from trace information provided by a modi ed Hermes interpreter. This trace contains all information about process creation and interprocess communication during the execution of an application. A static source analysis tool (Static Analyzer 1) collects semantic information about each application process. A second static source analysis tool (Static Analyzer 2) collects information needed to evaluate process clusters. All this information is combined by the Process Clustering Tool which builds clusters according to the rules described above. The two static analysis tools are language-dependent, but event traces can also be obtained by tools which instrument the target operating system to record IPC and process creation operations.
4 Automatic Event Abstraction Our second tool groups events to abstract events. The theoretical foundation of our tool is the chunking theory of program understanding [50]. According to this theory, a programmer and/or maintainer recognizes functions of groups of statements which he/she chunks together. Lower-level chunks are then grouped into higher-level chunks. The event abstraction tool mirrors this bottom-up derivation of abstractions. In distributed applications, multiple autonomous units cooperate to achieve a common goal, see above. We therefore extended the notion of chunks to cover not only groups of statements within one process, but also statements in di�erent processes, connected by message links (indicating this cooperation). Frequently, the statements in the same process that are chunked together are related by the control ow, see for example [32]. Such chunks are easily determined by an automatic tool, and this approach is therefore pursued in this paper as well. However, for badly structured source, source statements related by control ow only might be bad abstraction candidates. In this case, chunks should consist of source statements related by either control ow or data
ow. Detecting these general chunks, however, is di�cult to automate, because they can be 12
Source Files
Hermes Compiler
Object Files
Static Analyzer 1
Semantic Data
Hermes Interpreter
Trace File(s)
Evaluation Data
Static Analyzer 2
Process Clustering Tool
Cluster File
Figure 4: Architecture of the Process Clustering Tool
13
Output
noncontiguous in the source and overlap with another. Tools for the automatic detection of these chunks could be based either on plan recognition approaches [53] or program slicing [1]. The event abstraction tool combines information derived by a static source analysis with information about the execution to derive abstractions. The tool projects the static structure of the source on the events in the execution trace. It uses the fact that most primitive events are created when speci c statements in the application source are executed. For example, a call event is created whenever a call statement in the source is executed. It follows, that statements in the source can be matched with one or more primitive events in the event trace. Figures 5 and 6 give a high-level description of how the abstraction tool works. For a more detailed description see [39]. Before the abstraction process starts, control ow graphs for each application process are derived by a static analysis. Statements in the same clause, a sequence of statements with single entrance and single exit, are grouped into abstract statements. Hermes processes consist of a single top-level or outermost clause, potentially with nested subclauses. Grouping statements according to the clauses to which they belong creates a unique tree-structured static hierarchy. The initial match between statements and primitive events is determined by matching those statements whose execution create a primitive event with the event trace. The abstraction process starts with the lowest-level abstract statements, i.e., abstract statements that contain only primitive statements. In Figure 5, these initial abstract statements are A, B , and C . Consecutive events in the same process that match statements in the same abstract statement are grouped. Event set a, for example, consists of a sequence of primitive events that match constituent statements of the abstract statement A. And event sets c and d both match the abstract statement C . Next, following message links, these sequential event sets are combined. In Figure 5, event sets a and c as well as event sets b and d are combined. Each event set forms one abstract event and the data structures are updated accordingly. Figure 6 shows the result of this update. The abstraction focus in each static hierarchy is raised to the next level, here the root abstractions. In Figure 5, matches only exist between primitive events and primitive statements. At higher abstraction levels, such as the one depicted in Figure 6, matches also exist between abstract events and abstract statements. Note that abstract events in general contain primitive events from various processes and can therefore be matched by abstract statements in di�erent static hierarchies. Again, the sequential event sets for each application process are formed by grouping all consecutive primitive or abstract events in this process that match the constituent statements of an abstract statement in the current focus. As before, these event sets are then combined by following message links. Furthermore, event sets that contain the same abstract event are combined too. In Figure 6, the resulting abstract event contains all primitive or abstract events in the two event sets a and b and forms the top-level abstraction for this example. The tool stops because the abstraction focus reached the top-level abstract statement for each application process. Figure 7 shows the high-level design of the complete event abstraction tool. It consists of a number of programs that share information via les. The rst program, Flowgraph collect, is written in Hermes. It loads a compiled Hermes process and writes out the information necessary to construct control ow graphs and to determine a static statement hierarchy. This 14
Static Statement Hierarchy for Process1 A
B
a
b
Process1 c
d
Process2
C Static Statement Hierarchy for Process2
abstract statement abstract statement in focus primitive statement primitive event set of events matching abstr. statement match between statement and event
Figure 5: First Abstraction Step
15
Static Statement Hierarchy for Process1
a Process1 Process2 b
Static Statement Hierarchy for Process2 abstract statement abstract statement in focus primitive statement primitive event abstract event set of events matching abstr. statement match between statement and event
Figure 6: Second Abstraction Step
16
General preprocessing (independent of execution trace)
Process Objects
FLOWGRAPH_ COLLECT
Raw Flow Graph Data
FLOW
Flow
Trace
Graphs
Files
UNROLL
Event Abstr.
COMBINE
Hierarchy
Potential Exec. Histories
Figure 7: Architecture of the Event Abstraction Tool
17
is possible because Hermes allows compiled processes to be read in as data, using the data type The other programs are implemented in C. Flow uses this raw data to construct a control ow graph and to derive the static statement hierarchy as discussed above. While this analysis is independent of a speci c application execution, the following steps utilize the trace information provided by a modi ed Hermes interpreter which contains all information about process creation and interprocess communication for one speci c execution. Unroll performs the initial match of primitive events and primitive statements. Combine brings everything together, using information about the static statement hierarchies, the event trace, and the initial matches to derive the event abstraction hierarchy. Note that only the rst processing step uses a language-dependent tool. program.
5 Results Abstract visualizations of a distributed execution are based on the notions of process clusters and abstract events. Ideally, these entities should have properties identical to those of their primitive counterparts, processes and primitive events. This, however, is not the case. The individual processes are always sequential, but process clusters might exhibit concurrency in their interface. Consequently, they may have to be displayed with multiple lines. Understanding parallel entities, however, is in general more di�cult than understanding a sequential entity. Similarly, abstract events do not occur instantaneously, but extend in time. Consequently, the precedence relation on abstract events is not necessarily transitive, which might make reasoning about the causality harder. One possible remedy for this additional complexity of the abstract visualizations is to restrict the abstraction operation. Restricting the abstraction operator could ensure that only a set of processes with a sequential interface could be clustered together. Similarly, such restrictions could limit abstract events to structures that guarantee transitivity of the precedence relation. This approach, however, severely limits the expressiveness of our abstraction tools. For example, interesting sequences of primitive events could not be grouped to form an abstract event. To retain exibility in the derivation of abstractions, we deliberately accept the potentially higher complexity of the resulting abstract visualizations. The visualization tool provides gra cal representations designed to minimize this additional complexity. Visualizing process clusters is done with the minimal number of lines. Frequently, process clusters can be visualized with a single line, indicating that the cluster has a sequential interface. Judging from our experience to date, it appears that good process clusters have only a limited degree of concurrency in their interface. Similarly, the set of predecessors and successors for each (primitive or abstract) event can be highlighted on the display, facilitating reasoning about causality. To demonstrate the results obtained with out tools, various abstract visualizations of the execution of one distributed application, makehermes, are given. The following few paragraphs also show that the abstractions derived represent meaningful entities. Makehermes is the Hermes version of the Unix make tool. A Hermes application consists of separately compiled process and de nition modules which are imported by \linking" and \usage" lists respectively. 18
Parsing these lists in the source reveals all dependencies, and so a separate makefile is not necessary. Makehermes builds a graph structure representing the dependencies and checks, starting from the leaves, whether a source module must be recompiled. To limit the extent of this recursive dependency check, an environment variable restricts its scope as follows: only sources in the current directory and in directories speci ed by the environment variable are scanned for further dependencies. In the traced execution, the dependencies for a single de nition module are checked. The source modules included by this de nition module are outside the current scope, that is, in directories that are neither the local directory nor in the list speci ed by the appropriate environment variable. Makehermes determines that an object le for this de nition module exists and is more recent than all the source modules on which it depends. Therefore, no compiler is invoked. This execution creates a total of 175 processes, and the event trace contains 2534 primitive events.
Figure 8: Low-level Visualization of the makehermes Execution Figure 8 depicts a segment of the execution history at the lowest abstraction level, using the 19
tool described in [61, 62]. This tool draws a set of horizontal lines, one for each process, placing a symbol on the appropriate line for each event. Time ows from left to right, and a scrollbar allows for scrolling in the vertical (process) dimension. (Scrolling in the time dimension is more complex since it depends on the actual partially{ordered execution; it has also been implemented by the tool.) The lines are preceded by the process name. Events that represent the two endpoints of a communication activity are connected by an arrow, using a vertical arrow for synchronous communication and a sloping arrow for asynchronous communication. The arrow points from the sending to the receiving event. Di�erent symbols are used to distinguish di�erent types of events. Filled squares indicate process creation events, open squares depict process termination events. Filled circles represent (synchronous or asynchronous) message sends and receives. Open circles are used for the return and receive of a return for synchronous messages. The process lines are drawn in three di�erent states, approximating the process state. Before a process starts (indicated by a lled square) and after its termination (the open square), the line is invisible. After sending a synchronous message, a process is blocked until it receives the return message. This is represented by a dashed line. In all other cases, a process is assumed to be active, displayed by a solid line. The execution segment depicted in Figure 8 occurs at the end of the makehermes execution. For this window size, not all relevant processes t on the screen, as indicated by the arrows leaving the window at the top and bottom boundaries. A higher-level visualization of the same execution segment is shown in Figure 9. In Figure 9, lines preceded by a name in capital letters indicate process clusters. (On a colour display, clusters are highlighted compared to processes.) Only events with a partner outside the cluster are displayed, while events purely internal to a cluster are ignored. Process clusters therefore not only reduce the display space in the process dimension, but also in the time dimension. The cluster is always represented by one ore more solid lines, the display details are discussed in [62]. In this gure, all processes are shown, either by displaying them individually or as part of a process cluster. Using such a high-level visualization, it becomes far easier to analyze and reason about the execution behaviour. The execution in Figure 9 shows the following sequence of actions. After scanning the source of the de nition module, the process make knows all sources modules it imports. It repeatedly invokes GETDEP to detect the dependencies of these modules. Cluster GETDEP uses the process File Modification Time and processes within the standard Hermes runtime system to locate these sources. In this execution segment, the sources are not within the current scope, so GETUSES is not invoked to scan a source le. After checking all dependencies, make determines that the existing object le is more recent than any of the source les on which it depends and returns to makehermes without invoking the Hermes de nition module compiler (via process dcomshell). Figure 9 contains four large clusters. SYSTEM clusters all processes that form the Hermes runtime system. The other three clusters group application processes. Figure 10 displays the internal structure of these clusters, representing subclusters with boxes. All three clusters encapsulate processes that together o�er a single service. The cluster STDIO PROGLIT, for example, groups all 19 processes involved in le I/O activities during the 20
Figure 9: Intermediate Process Cluster View of the makehermes Execution
21
GETDEP
GETDEP
FINDFILE
GETUSES
FINDFILE
getdep findfile_proglit findfile findfile findfile_proglit initcheckscope findfile_proglit findfile_proglit findfile_proglit
STDIO_ PROGLIT
tokenstrings stdio_proglit GETUSES LAYER_5 uptolow uptolow readstream getuses uptolow uptolow getnoncommentline writestream readword uptolow getnoncommentline writeword uptolow fclose, pclose uptolow freopen uptolow clearerr tokenstrings ferror, ferrno uptolow feof, fflush fseek, rewind ftell setlinebuf fstat, fileno
Figure 10: Three Process Clusters of the makehermes Execution scan of a source module. The common interface to all processes is stdio proglit, which forwards le I/O requests to the appropriate process in the subcluster LAYER 5. GETUSES determines and returns all dependencies for a single source le (the contents of the \linking" and \usage" lists). The third cluster, GETDEP, obtains the timestamp for a speci c source le and invokes GETUSES to scan it for additional dependencies if the source le is in the current scope. The list of dependencies is returned to the make process, which builds and maintains the global dependency graph. Next, we will give two examples of abstract visualizations containing abstract events. To reduce the amount of display space necessary, these examples will show the same process clusters as Figure 9. The examples show di�erent parts of the execution at intermediate event abstraction levels. Figure 11 shows three abstract events, involving processes from GETUSES and STDIO PROGLIT as well as events in tokenize. Abstract events generally involve primitive events from a number of di�erent processes. Therefore, they are displayed as vertical rectangles, stretching over the range of all processes involved. The intersection of this open rectangle with a process is blackened in case events from this process are part of the abstract event. Otherwise, the intersection is left open, see process tokenize and the rst abstract event in Figure 11. The displayed segment of the execution corresponds to initialization and source scan of the target de nition module. At its end, GETUSES returns the list of dependencies to GETDEP. Figure 12 displays the end of the execution, similar to Figure 9. Due to the display space saved by event abstraction, a larger piece of the execution ts on the screen. The same execution history segment without event abstraction occupies approximately two and a half windows in the horizontal (time) dimension. Figure 12 shows that make invokes GETDEP 22
Figure 11: Source Scan in the makehermes Execution
23
Figure 12: Dependency Checks in the makehermes Execution
24
multiple times to determine dependencies for a speci c source le. In each case, GETDEP checks whether the source le is in the current directory (the rst call and associated reply to File Modification Time). Since this is not the case, GETDEP then proceeds to nd the source le, obtains its timestamp, and checks whether it is in the current scope. The three abstract events in Figure 12 group all primitive events involved in this activity. Because none of the sources imported by the target module are in the current scope, GETUSES is never invoked. Figure 12 displays three such iterations before make has exhausted all dependencies derived from the source scan shown in Figure 11. It then determines that the existing object le is up-to-date and returns to makehermes without invoking a compiler. To indicate the reduction in the display space needed, a few statistics were collected for this execution. Using the same window size as in Figure 8, the lowest-level visualization of the complete execution application occupies 65 windows in time (horizontal) dimension. In the process dimension, seven windows are necessary. Using process clustering, all process and cluster traces t into one window, the execution spans 15 windows in the time dimension. Using a combination of process clustering and event abstraction, the complete execution history ts into twelve windows in the time dimension. Of course, reductions in these numbers could also be achieved by arbitrarily grouping processes into clusters and primitive events into abstract events. However, the discussion above shows that the abstractions derived not only result in a reduction of the display space needed, but also correspond to meaningful entities in terms of the application domain. The resulting abstract visualizations are therefore both useful and meaningful.
6 Conclusions and Future Work Design recovery is a complex and abstract activity. In view of this, it seems unlikely that completely automatic abstraction tools will ever provide a de nitive abstract view of the execution of an application. However, the tools and heuristics suggested here can provide valuable assistance in the semi{automatic construction of good initial abstraction hierarchies. One area of future work is to examine whether additional information sources will increase the quality of the cluster hierarchies derived. A variety of additional information sources can be imagined: prede ned xed abstractions, information about standard abstractions in the runtime system, expected abstractions based on previous runs, or a more detailed semantic analysis of the application processes. Our abstraction tools have been used in conjunction with the process and event visualization component of a distributed debugger. The debugger allows the user to create and save abstraction hierarchy description les through an X{window interface, and to use such les to reduce the apparent complexity of the behaviour as presented. As one example, there is a cluster description le for the system processes in the standard Hermes runtime environment (the SYSTEM cluster in Figure 9). Our automatic tools also produce description les which can be read and modi ed as the user re nes his/her understanding of the design. As design recovery evolves over a number of executions, the manual and machine resources 25
invested to construct appropriate abstraction hierarchy descriptions are repaid in improved understanding and user productivity. Currently, the debugger itself has been used to present behaviour in ve di�erent programming language environments, of which Hermes is only one. While the tools have currently been implemented only for Hermes, we see no conceptual di�culties porting them to environments such as OSF/DCE, for example. Hermes has served as a vehicle for our experiments, but our debugger is already being used in much more practical multi{threaded and distributed programming environments where the complexity of the distributed applications imposes a need for suitable abstraction.
References [1] Hiralal Agrawal, Richard A. Demillo, and Eugene H. Spa�ord. Debugging with Dynamic Slicing and Backtracking. Software { Practice and Experience, 23(6):589{616, June 1993. [2] Mohan Ahuja, Ajay D. Kshemkalyani, and Timothy Carlson. A Basic Unit of Computation in Distributed Sytems. In Proceedings of the 10th International Conference on Distributed Computing Systems, pages 12{19, Paris, France, May 1990. [3] Allen L. Ambler, Margaret M. Burnett, and Betsy A. Zimmermann. Operational Versus De nitional: A Perspective on Programming Paradigms. IEEE Computer, 25(9):28{43, September 1992. [4] David F. Bacon and Robert E. Strom. Implementing the Hermes Process Model. Technical Report RC 14518(#64891) 3/20/89, IBM T.J.Watson Research Center, Yorktown Heights, New York, USA, March 1989. [5] Henri E. Bal, Jennifer G. Steiner, and Andrew S. Tanenbaum. Programming Languages for Distributed Computing Systems. ACM Computing Surveys, 21(3):261{322, September 1989. [6] Henri E. Bal, Andrew S. Tanenbaum, and M. Frans Kaashoek. Orca: A Language for Distributed Programming. ACM SIGPLAN Notices, 25(5):17{24, May 1990. [7] Rajiv D. Banker, Srikant M. Datar, Chris F. Kemerer, and Dani Zweig. Software Complexity and Maintenance Costs. Communications of the ACM, 36(11):81{94, November 1993. [8] A. A. Basten. Hierarchical Event{Based Behavioral Abstraction in Interactive Distributed Debugging: A Theoretical Approach. Master's thesis, Eindhoven University of Technology, August 1993. [9] Peter Bates. Debugging Heterogeneous Distributed Systems Using Event{Based Models of Behavior. In Proceedings of the ACM SIGPLAN/SIGOPS Workshop on Parallel and Distributed Debugging, pages 11{22, Madison, Wisconsin, May 1988. Appeared as ACM SIGPLAN Notices, 24(1), January 1989. 26
[10] P. Benedusi, A. Cimitile, and U. De Carlini. A Reverse Engineering Methodology to Reconstruct Hierarchical Data Flow Diagrams for Software Maintenance. In Proceedings of the Conference on Software Maintenance, pages 180{189, Los Alamitos, CA, 1989. [11] Marc H. Brown. Algorithm Animation. The MIT Press, Cambridge, Massachusetts { London, England, 1987. [12] Michael Burke, Ron Cytron, Jeanne Ferrante, Wilson Hsieh, Vivek Sarkar, and David Shields. Automatic Discovery of Parallelism: A Tool and an Experiment. In Proceedings of the ACM SIGPLAN Conference on Parallel Programming: Experiences with Applications, Languages and Systems, pages 77{84, New Haven, Connecticut, July 1988. [13] Erich Buss and John Henshaw. A Software Reverse Engineering Experience. In Proceedings of the 1991 CAS Conference, pages 55{73, Toronto, Ont., Canada, October 1991. IBM Canada Ltd. Laboratory, Centre for Advanced Studies. [14] David Bustard, John Elder, and Jim Welsh. Concurrent Program Structures. Prentice Hall International Ltd, 1988. [15] Eric J. Byrne. Software Reverse Engineering: A Case Study. Software|Practice and Experience, 21(12):1349{1364, December 1991. [16] Nicholas Carriero and David Gelernter. How to Write Parallel Programs: A Guide to the Perplexed. ACM Computing Surveys, 21(3):323{357, September 1989. [17] K. Mani Chandy and Leslie Lamport. Distributed Snapshots: Determining Global States of Distributed Systems. ACM Transactions on Computer Systems, 3(1):63{75, February 1985. [18] Yih-Farn Chen, Michael Y. Nishimoto, and C. V. Ramamoorthy. The C Information Abstraction System. IEEE Transactions on Software Engineering, 16(3):325{334, March 1990. [19] Wing Hong Cheung. Process and Event Abstraction for Debugging Distributed Programs. PhD thesis, University of Waterloo, Ontario, Canada, September 1989. Also available as Technical Report T{189, Computer Communications Network Group, University of Waterloo. [20] Aniello Cimitile and Ugo de Carlini. Reverse Engineering: Algorithms for Program Graph Reduction. Software|Practice and Experience, 21(5):519{537, May 1991. [21] T. A. Corbi. Program understanding: Challenge for the 1990s. IBM Systems Journal, 28(2):294{306, 1989. [22] Amr El-Kadi and Shmuel Rotenstreich. An Overview of Hermes. Technical Report GWU{IIST{91{24, Department of Electrical Engineering and Computer Science, The George Washington University, December 1991. 27
[23] Richard Fairley. Software Engineering Concepts. McGraw{Hill Series in Software Engineering and Technology. McGraw{Hill Book Company, New York, 1985. [24] Colin Fidge. Logical Time in Distributed Computing Systems. IEEE Computer, 24(8):28{33, August 1991. [25] Robert W. Floyd. The Paradigms of Programming. Communications of the ACM, 22(8):455{460, August 1979. 1978 ACM Turing Award Lecture. [26] Jason Gait. A Probe E�ect in Concurrent Programs. Software|Practice and Experience, 16(3):225{233, March 1986. [27] Hector Garcia-Molina, Frank Germano, Jr, and Walter H. Kohler. Debugging a Distributed Computing System. IEEE Transactions on Software Engineering, 10(3):210{219, March 1984. [28] Kurt Geihs. Infrastrukturen fur heterogene verteilte Systeme. Informatik{Spektrum, 16:11{23, 1993. [29] David Gelernter and Nicholas Carriero. Coordination Languages and their Signi cance. Communications of the ACM, 35(2):97{107, February 1992. [30] W. Morven Gentleman. Message Passing Between Sequential Processes: The Reply Primitive and the Administrator Concept. Software|Practice and Experience, 11:435{ 466, 1981. [31] Rajiv Gupta and Mary Lou So�a. Region Scheduling: An Approach for Detecting and Redistributing Parallelism. IEEE Transactions on Software Engineering, 16(4):421{431, April 1990. [32] Mehdi T. Harandi and Jim Q. Ning. Knowledge{Based Program Analysis. IEEE Software, 7(1):74{81, January 1990. [33] The Institute of Electrical and Electronics Engineers, Inc., New York, NY, USA. IEEE Standard Glossary of Software Engineering Terminology, 1983. ANSI/IEEE Std 729. [34] Je�rey Joyce, Greg Lomow, Konrad Slind, and Brian Unger. Monitoring Distributed Systems. ACM Transactions on Computer Systems, 5(2):121{150, May 1987. [35] David W. Krumme, Alva L. Couch, and George Cybenko. Debugging Support for Parallel Programs. In Jack Dongarra, Iain Du�, Patrick Ga�ney, and Sean McKee, editors, Vector and Parallel Computing: Issues in Applied Research and Development, pages 205{214. Ellis Horwood Limited, Chichester, 1989. [36] Thomas Kunz. Developing a Measure for Process Cluster Evaluation. Technical Report TI{2/93, Technical University Darmstadt, February 1993.
28
[37] Thomas Kunz. Process Clustering for Distributed Debugging. In Proceedings of the ACM/ONR Workshop on Parallel and Distributed Debugging, pages 75{84, San Diego, California, May 1993. Appeared as ACM SIGPLAN Notices, 28(12), December 1993. [38] Thomas Kunz. Programming Paradigms and Clustering Rules. Technical Report TI{ 3/93, Technical University Darmstadt, February 1993. [39] Thomas Kunz. An Event Abstraction Tool: Theory, Design, and Results. Technical Report TI{1/94, Technical University Darmstadt, January 1994. [40] Robert Chi Tau Lai. Ada Task Taxonomy Support for Concurrent Programming. ACM SIGSOFT Software Engineering Notes, 16(1):73{91, January 1991. [41] Leslie Lamport. Time, Clocks, and the Ordering of Events in a Distributed System. Communications of the ACM, 21(7):558{565, July 1978. [42] Thomas J. LeBlanc and John M. Mellor-Crummey. Debugging Parallel Programs with Instant Replay. IEEE Transactions on Computers, 36(4):471{482, April 1987. [43] Norbert Leser. The distributed computing environment naming architecture. Distributed Systems Engineering, 1(1):19{28, 1993. [44] Michael J. Manthey. Hierarchy in Sequential and Concurrent Systems. In Leah H. Jamieson, Dennis Gannon, and Robert J. Douglas, editors, The Characteristics of Parallel Algorithms, pages 139{164. The MIT Press, Cambridge, Massachusetts and London, England, 1987. [45] Sape Mullender, editor. Distributed Systems. Addison{Wesley Publishing Company, New York, New York, 1989. [46] Robert H. B. Netzer and Barton P. Miller. Optimal Tracing and Replay for Debugging Message{Passing Parallel Programs. Technical report, Computer Science Department, University of Wisconsin{Madison, 1992. [47] Cherri M. Pancake. Debugger Visualization Techniques for Parallel Architectures. In Proceedings of COMPCON, pages 276{284, San Francisco, February 1992. [48] F. N. Parr and R. E. Strom. NIL: A high{level language for distributed systems. IBM Systems Journal, 22(1):111{127, January 1983. [49] Sukesh Patel, William Chu, and Rich Baxter. A Measure for Composite Module Cohesion. In Proceedings of the 14th International Conference on Software Engineering, pages 38{48, Melbourne, Australia, May 1992. [50] Santanu Paul, Atul Prakash, Erich Buss, and John Henshaw. Theories and Techniques of Program Understanding. In Proceedings of the 1991 CAS Conference, pages 37{ 53, Toronto, Ont., Canada, October 1991. IBM Canada Ltd. Laboratory, Centre for Advanced Studies. 29
[51] Michel Raynal. Distributed Algorithms: Their Nature & The Problems Encountered. In Michel Cosnard, Yves Robert, Patrice Quinton, and Michel Raynal, editors, Parallel and Distributed Algorithms, pages 179{185. Elsevier Science Publishers B.V. (North{ Holland), 1989. [52] Michel Raynal. Order Notions and Atomic Multicast in Distributed Systems: A short survey. In Proceedings of the Second IEEE Workshop on Future Trends of Distributed Computing Systems, pages 420{426, Cairo, Egypt, September 1990. [53] Charles Rich and Linda M. Wills. Recognizing a Program's Design: A Graph{Parsing Approach. IEEE Software, 7(1):82{89, January 1990. [54] D. J. Robson, K. H. Bennett an B. J. Cornelius, and M. Munro. Approaches to Program Comprehension. Journal of Systems and Software, 14:79{84, February 1991. [55] Spencer Rugaber, Stephen B. Ornburn, and Richard J. LeBlanc Jr. Recognizing Design Decisions in Programs. IEEE Software, 7(1):46{54, January 1990. [56] A. Schill, L. Heuser, and M. Muhlhauser. Using the object paradigm for distributed application development. In Kommunikation in verteilten Systemen. Springer{Verlag, Berlin et al., 1989. [57] Reinhard Schwarz and Friedemann Mattern. Detecting Causal Relationships in Distributed Computations: In Search of the Holy Grail. Technical Report SFB124{15/92, Sonderforschungsbereich 124, Universitat Saarbruecken und Universitat Kaiserslautern, December 1992. [58] Rudolph E. Seviora. Knowledge{Based Program Debugging Systems. IEEE Software, 4(3):20{32, May 1987. [59] Robert E. Strom, David F. Bacon, Arthur P. Goldberg, Andy Lowry, Bill Silvermann, Daniel Yellin, Jim Russell, and Shaula Yemini. Hermes: Unix User's Guide, Version 0.8alpha. Technical report, IBM T.J.Watson Research Center, Yorktown Heights, New York, USA, March 1992. [60] James Alexander Summers. Precedence{Preserving Abstraction for Distributed Debugging. Master's thesis, University of Waterloo, 1992. [61] David J. Taylor. A Prototype Debugger for Hermes. In Proceedings of the 1992 CAS Conference, Volume I, pages 29{42, Toronto, Ont., Canada, November 1992. IBM Canada Ltd. Laboratory, Centre for Advanced Studies. [62] David J. Taylor. The Use of Process Clustering in Distributed{System Event Displays. In Proceedings of the 1993 CAS Conference, pages 505{512, Toronto, Ont., Canada, October 1993. IBM Canada Ltd. Laboratory, Centre for Advanced Studies. [63] Scott R. Tilley. Management Decision Support Through Reverse Engineering Technology. In Proceedings of the 1992 CAS Conference, Volume I, pages 319{328, Toronto, Ont., Canada, November 1992. IBM Canada Ltd. Laboratory, Centre for Advanced Studies. 30
[64] Je�rey J. P. Tsai, Kwang-Ya Fang, Horng-Yuan Chen, and Yao-Dong Bi. A Noninterference Monitoring and Replay Mechanism for Real{Time Software Testing and Debugging. IEEE Transactions on Software Engineering, 16(8):897{916, August 1990. [65] Peter Wegner and Scott A. Smolka. Processes, Tasks, and Monitors: A Comparative Study of Concurrent Programming Primitives. In Ellis Horowitz, editor, Programming Languages: A Grand Tour, pages 360{376. Computer Science Press, Inc., Rockville, MD, 3 edition, 1987. [66] Gio Wiederhold, Peter Wegner, and Stefano Ceri. Toward Megaprogramming. Communications of the ACM, 35(11):89{99, November 1992. [67] Shaula A. Yemini, German S. Goldszmidt, Alexander D. Stoyenko, and Yi-Hsiu Wei. CONCERT: A High{Level{Language Approach to Heterogeneous Distributed Systems. In Proceedings of the 9th International Conference on Distributed Computing Systems, pages 162{171, Newport Beach, California, USA, June 1989. [68] Dror Zernik, Marc Snir, and Dalia Malki. Using Visualization Tools to Understand Concurrency. IEEE Software, 9(3):87{92, May 1992.
31