Review
Review of commonly used remote sensing and ground-based technologies to measure plant water stress M Govender1,2*, PJ Dye1, IM Weiersbye1, ETF Witkowski1 and F Ahmed3
School of Animal, Plant and Environmental Sciences, University of the Witwatersrand, Johannesburg, PO Wits 2050, South Africa 2 CSIR Natural Resources and the Environment, c/o School of Environmental Sciences, University of KwaZulu-Natal, Private Bag X01, Scottsville, 3209, South Africa 3 Remote sensing GIS and spatial modelling, School of Environmental Sciences, University of KwaZulu-Natal, Durban 4041, South Africa 1
Abstract This review provides an overview of the use of remote sensing data, the development of spectral reflectance indices for detecting plant water stress, and the usefulness of field measurements for ground-truthing purposes. Reliable measurements of plant water stress over large areas are often required for management applications in the fields of agriculture, forestry, conservation and land rehabilitation. The use of remote sensing technologies and spectral reflectance data for determining spatial patterns of plant water stress is widely described in the scientific literature. Airborne, space-borne and hand-held remote sensing technologies are commonly used to investigate the spectral responses of vegetation to plant stress. Earlier studies utilised multispectral sensors which commonly collect four to seven spectral bands in the visible and near-infrared region of the electromagnetic spectrum. Advances in sensor and image processor technology over the past 3 decades now allow for the simultaneous collection of several hundred narrow spectral bands resulting in more detailed hyperspectral data. The availability of hyperspectral data has led to the identification of several spectral indices that have been shown to be useful in identifying plant stress. Such studies have revealed strong linear relationships between plant pigment concentration and the visible (VIS) and near-infrared (NIR) reflectance, while plant water content has been linked to specific bands in the short-wave infrared (SWIR) region of the spectrum. Ground-truthing is essential to identifying useful reflectance information for detecting plant water stress, and four commonly used ground-based methods viz. predawn leaf water potential, leaf chlorophyll fluorescence, leaf pigment concentrations and leaf water content are reviewed for their, usefulness and practical application.
Keywords: leaf chlorophyll fluorescence, leaf-water content, plant pigment concentrations, plant water stress, predawn leaf water potential, remote sensing
Introduction All living organisms including plants need an adequate supply of water to ensure both their growth and survival. Water in plants is required to permit vital processes such as photosynthesis, respiration and nutrient uptake. Plants absorb water from the soil through their roots, which is then transported to their stems, leaves and flowers for the maintenance of the different vital processes. When water supply is insufficient, plants may suffer water stress which could then compromise their growth production, reproduction and survival. Water stress in plants is a complex physiological response to the limited availability of water to a plant. When plants suffer from water stress, a series of harmful plant-water interactions occur, which may disrupt a plant’s physiology. These include a decrease in cell water potential, cell turgor and relative water content (Hsiao, 1973). The available water to plants is usually expressed in terms of water potential. Water potential is commonly assessed by measuring predawn leaf water potential; a direct measure of * To whom all correspondence should be addressed. +2733 2605276; fax: +2733 260 5266; e-mail:
[email protected] Received 1 August 2008; accepted in revised form 14 September 2009.
Available on website http://www.wrc.org.za ISSN 0378-4738 (Print) = Water SA Vol. 35 No. 5 October 2009 ISSN 1816-7950 (On-line) = Water SA Vol. 35 No. 5 October 2009
plant water stress. Measurements at predawn directly evaluate the water status of the plant, because during night-time hours under zero transpiration, plant water potential equilibrates to the available soil water (Cleary and Zaerr, 1984). Cleary and Zaerr (1984) suggested that a predawn leaf water potential of less than -0.8 MPa is an indication of stressed vegetation. Indirect measurements may also be used to detect plant water stress. The more commonly used techniques include measurements of relative leaf water content, plant chlorophyll pigment content and chlorophyll fluorescence. Other, less frequently applied measurements used in verifying remote sensing studies include variations in trunk or stem diameters or even xylem vessel characteristics. Although characterising cavitations in xylem vessels is potentially a useful technique for understanding the response to water stress in a plant, this method is time-consuming, costly and not suitable for use over large spatial scales. It has been shown in many plant species that roots are more vulnerable to cavitation than stems, and thus root cavitation is more suited to characterise plant water stress between species (Sperry and Saliendra, 1994; Alder et al., 1996; Hacke and Sauter, 1996; Linton et al., 1998). Reliable detection and prediction of plant water stress is desirable for numerous agricultural, forestry, conservation and land rehabilitation applications. Various remote and groundbased technologies are available for the measurement of plant water stress.
741
Detection of plant water stress using remote sensing The application of remote sensing technologies for plant and environmental studies became widespread during the 1980s. These studies made use of low spatial and spectral resolution (60 m to 80 m and 4 spectral bands) multispectral data. Multispectral remote sensing data commonly consist of 4 to 7 broad spectral bands in the visible (VIS) and near infrared (NIR) regions of the electromagnetic spectrum. These datasets were acquired using airborne, satellite and ground-based spectrometers. Early airborne systems consisted of a multispectral camera mounted on board a light aircraft. Spectrometers at this time were bulky, heavy instruments which were not easily transportable in the field; therefore most measurements were taken in laboratories. Remote sensing technologies have advanced significantly over the past 10 to 15 years. With the development of hyperspectral remote sensing technologies, researchers have benefited from significant improvements in the spectral and spatial properties of the data, allowing for more detailed plant and environmental studies. These technologies acquire many hundreds of spectral bands across the spectrum from 400 nm to 2 500 nm, using satellite, airborne or hand-held devices. The Casi or Hymap airborne imagers are examples of commonly used hyperspectral imagers which acquire high spectral and spatial resolution images. A distinct advantage of most airborne imagers is their capability to acquire at least 200 or more spectral bands at less than 5 m spatial resolution. Advances in spectrometry have also resulted in state-of-the-art portable field instruments which allow for the collection of hand-held hyperspectral signatures. The Hyperion sensor is currently the only hyperspectral satellite system available for research. In recent years, there has been an expanding body of literature concerning the relationship between the spectral
742
Leaf pigments
Spectral reflectance (%)
Remote sensing technologies which utilise spectral reflectance data have increasingly been used for determining spatial patterns of plant water stress (Yamasaki and Dillenburg, 1999; Ceccato et al., 2001; Sims and Gamon, 2002; Pu et al., 2003; Jackson et al., 2004; Stimson et al., 2005; Chun-Jiang et al., 2006; Clay et al., 2006; De Tar et al., 2006; Eitel et al., 2006; Fitzgerald et al., 2006; Harris et al., 2006; Sepulcre-Cantó et al., 2006; Campbell et al., 2007; Hope et al., 2009). Important advantages of remote sensing technologies include cost-effectiveness, efficiency in displaying spatial patterns at a variety of scales, and versatility in revealing a variety of structural and physiological characteristics of water-stressed plants. Despite numerous successful case studies, the selection of suitable remote sensing methodologies and reflectance algorithms remains difficult, due to the influence of vegetation diversity and site conditions on vegetation spectral reflectance. This paper reviews the detection of plant water stress using remote sensing technologies and ground-based techniques commonly used to identify water stress in plants and which are suitable for ground-truthing remotely-sensed imagery. Within the scope of this review, no distinction is made between the technologies used for acquiring the remote sensing data, but rather the focus is on highlighting vegetative spectral sensitivities which have been used to detect plant water stress. The ground-based techniques reviewed are based on measurements of predawn leaf water potential (Dixon, 1914), leaf chlorophyll fluorescence (Muller, 1874), leaf water content (Weatherley, 1950) and leaf pigment concentrations (Lichtenthaler, 1987).
60 50
Visible
Cell structure
Water content
Near infrared
Shortwave infrared
40 30 20 10 400 600 800 1000 1200 1400 1600 1800 2000 2200 2400 Spectral wavelength (nm)
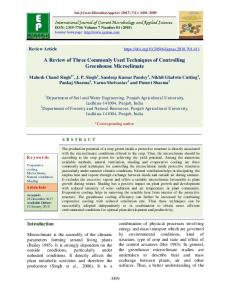
Figure 1 Typical reflectance sensitivities as controlled by leaf pigments, cell structure and water content (adapted from Gaussman, 1977)
reflectance properties of vegetation and the structural characteristics of vegetation and pigment concentration in leaves. The spectral characteristics of vegetation are governed primarily by scattering and absorption characteristics of the leaf internal structure and biochemical constituents, such as pigments, water, nitrogen, cellulose and lignin (Asner, 1998; Coops et al., 2002). Pigments are the main determinants controlling the spectral responses of leaves in the visible wavelengths (Gaussman, 1977). Chlorophyll pigment content, in particular, is directly associated with photosynthetic capacity and productivity (Gaussman, 1977; Curran et al., 1992). Reduced concentrations of chlorophyll are indicative of plant stress (Curran et al., 1992). On the other hand, cellular structure and water content of leaves are the main determinants in the near- and mid-infrared wavelengths as shown in Fig. 1. A summary of important findings since the early 1980s which highlights specific regions of the electromagnetic spectrum and their relation to vegetation spectral reflectance properties is presented in Table 1. Many of the earlier studies focused on broad spectral bands such as the VIS and NIR regions (350 nm to 1 300 nm), which could be used in vegetation studies. More recent work has highlighted the importance of more specific narrow-band regions such as the red edge (maximum slope of vegetation reflectance from 690 nm to 740 nm) for predicting plant stress (Clay et al., 2006; Fitzgerald et al., 2006; Blackburn, 2007; Campbell et al., 2007). The extent of the literature is indicative of the importance of relationships between plant stress and both plant chlorophyll and water content. Plant chlorophyll and water content have thus been used as ‘surrogates’ of plant stress, under the assumption that decreases in chlorophyll and water content are indicative of plant stress. Numerous individual spectral bands and vegetation spectral reflectance indices have been identified for use in predicting plant chlorophyll content and water content.
Spectral indicators of plant chlorophyll content In stressed vegetation, leaf chlorophyll content decreases, thereby changing the proportion of light-absorbing pigments, leading to a reduction in the overall absorption of light (Murtha, 1982; Zarco-Tejada et al., 2000). These changes affect the spectral reflectance signatures of plants through a reduction in green reflection and an increase in red and blue reflections, resulting in changes in the normal spectral reflectance patterns of plants (Murtha, 1982; Zarco-Tejada et al., 2000). Thus,
Available on website http://www.wrc.org.za ISSN 0378-4738 (Print) = Water SA Vol. 35 No. 5 October 2009 ISSN 1816-7950 (On-line) = Water SA Vol. 35 No. 5 October 2009
Table 1 Some milestones in the historical development of understanding of vegetation spectral reflectance characteristics in specific regions of the electromagnetic spectrum Region of the spectrum
Vegetation spectral reflectance characteristics
Author(s)
VIS, NIR and MIR 1 550 to 1 750 nm SWIR (1 400 to 2 500 nm)
Pigments, cellular structure and water content of leaves Correlation of MIR reflectance to leaf water contents Reflectance is influenced by liquid water in plant tissue
Gaussman (1977) Tucker (1980) Tucker (1980) Ceccato et al. (2001)
VIS
Changes in red, green and blue reflectance due to chloroplast deterioration Movement of red edge towards shorter wavelengths during senescence or stress induced chlorosis
Murtha (1982)
Red Edge Red Edge
Red edge defined from 690 to 740 nm is also sensitive to chlorophyll content
Red Wavelengths
Displacement in the slope of the red wavelengths towards longer wavelengths as chlorophyll content increases Ratio of Band 5 to 7 highly correlated with water content of soils and vegetation
Thematic Band 5 to 7 (1 550 to 1 750 nm and 2 080 to 2 350 nm) VIS and NIR Red Edge NIR (700 to 1300 nm) and MIR (1 300 to 2 500 nm) 820 and 1 600 nm 550 and 700 nm
Collins et al. (1983) Rock et al. (1988); Milton and Mouat (1989) Horler et al. (1983) Curran et al. (1990) Blackburn (1999) Horler et al. (1983) Musick and Pelletier (1986; 1988)
Estimated chlorophyll a, b and total carotenoid content using equations Lichtenthaler (1987) and specific extinction coefficients Increase in the relative proportion of chlorophyll a will result in move- Guyot and Baret (1988) ment of red edge towards longer wavelengths, independent of total chlorophyll content and vice versa Detection of plant water stress in oak, sweetgum and conifers Hunt and Rock (1989) Significant relationship between the equivalent water thickness and a moisture stress index between reflectance value measured at 1 600 nm and reflectance value measured at 820 nm Maximum sensitivity to a wide range of chlorophyll contents
Chlorophyll content of branches of slash pine (Pinus elliottii engelm) predicted using red edge VIS (491 to 575 nm); Red (647 to Increased reflectance in response to plant stress regardless of the stress 760 nm) agent NIR plateau Weak water absorption features at 1 000 and 1 200 nm Deepening of the 2 water-absorption features as leaf area index increased 860 nm and 1240 nm Normalised difference water index as an estimate of vegetation water content 550, 700 and longer than 750 nm Specific wavelengths sensitive to pigment variations and chlorophyll assessment at leaf level for maple and chestnut leaves Reflectance at 550 and 700 nm, and Highly correlated in yellow-green to dark green leaves 500 and 670 nm Maximum reflectance at 750 nm, Highly correlated in chestnut leaves lowest reflectance between 400 to 500 nm. 670 to 680 nm Reflectance at 670 to 680 nm was insensitive to chlorophyll a above 70 mg∙m-2 in tobacco leaves (Nicotiana tabacum L.) due to saturation of the relationship between light absorption and pigment concentration. VIS, NIR Reflectance at wavelengths with high absorption coefficients should be more sensitive to low concentrations of chlorophyll a, while spectral regions with low absorption should be more sensitive to higher chlorophyll a concentrations 550, 700 and 750 nm The reflectance indices (R750/ R700 and R750/ R550) were identified as having strong linear relationships with total chlorophyll concentration at the leaf scale in horse chestnut (Aesculus hippocastanum L.) and Norway maple (Acer platanoides L.) leaves SWIR (1530 and 1720 nm) Reflectance is influenced by liquid water in plant tissue and can be used as an estimate for vegetation water content Red Edge
Available on website http://www.wrc.org.za ISSN 0378-4738 (Print) = Water SA Vol. 35 No. 5 October 2009 ISSN 1816-7950 (On-line) = Water SA Vol. 35 No. 5 October 2009
Hunt and Rock (1989) Curran et al. (1990) Gitelson and Merzlyak (1996) Lichtenthaler et al. (1996) Datt (1999) Curran et al. (1990) Carter (1993) Gao (1995) Asner (1998) Gao (1995) Gitelson and Merzlyak (1996) Gitelson and Merzlyak (1996) Gitelson and Merzlyak (1996) Lichtenthaler et al. (1996) Lichtenthaler et al. (1996) Blackburn (1999) Lichtenthaler et al. (1996) Gitelson and Merzlyak (1996) Gitelson et al. (2002) Blackburn (1999) Foutry and Baret (1997)
743
VIS, NIR, SWIR
1 700 nm, 2 000 nm, 2 200 nm 650, 635, and 470 nm
676 and 810 nm
740 to 820 nm; 680 and 760 nm
Red and NIR Red Edge
VIS VIS (Green) and NIR Red Edge
Red, NIR (850 nm, 710 nm, 680 nm) 850, 710 and 680 nm Red Edge VIS, NIR
900 and 970 nm NIR, Red Edge NIR and VIS Thermal bands NIR and SWIR
Red Edge
Variability in tissue optical properties is wavelength dependent Green foliage lowest variation in VIS, highest NIR Standing litter minimum variation in VIS and NIR, highest in SWIR Woody stems lowest variation in SWIR, highest in NIR Features associated with lignin and other organic compounds Concentrations of chlorophyll a, chlorophyll b, and carotenoids were best correlated with reflectance indices (R650, R635, and R470), respectively in the leaves of 4 deciduous tree species at different stages of senescence Chlorophyll a and chlorophyll b concentrations were strongly correlated with reflectance index (R676) in the visible wavelengths and reflectance index (R810) in the near-infrared on bracken (Pteridium aquilinum) canopies. Possible correlation to canopy structural development which has a direct influence on near-infrared reflectance. Higher reflectance values between 740 to 820 nm; and more pronounced maximum slope between 680 and 760 nm (red edge) is related to vegetation with healthier green leaf development, i.e. higher biomass and leaf area index Relation between water deficiency (stress) to spectral features in the 740 to 820 nm and red edge range in wheat The first derivative of pseudoabsorbance, d(Log 1/Reflectance), was highly correlated with canopy pigment concentration per unit area in the red edge region. Canopy and leaf scale concentrations per unit mass of chlorophyll a, chlorophyll b, and carotenoids were strongly related to d(Log 1/Reflectance) and the second derivative of pseudoabsorbance (dd(Log 1/Reflectance), but different wavelengths were optimal at each scale. Moderately correlated to chlorophyll concentration Ratio indices highly correlated to chlorophyll concentration Wavelength position of red edge related to chlorophyll concentration, and characteristics of the amplitude of the 1st and 2nd derivatives of reflectance and pseudo absorbance were more strongly correlated with chlorophyll Vegetation indices used to predict chlorophyll content of eucalypt vegetation at the leaf and crown scale 850, 710 and 680 nm wavelengths produced the highest correlations with leaf chlorophyll content With decreasing chlorophyll content, senescence or stressed induced chlorosis the red edge moves to shorter wavelengths, and is due to a reduction in the depth and breadth of the chlorophyll absorption feature Relationships between spectral reflectance properties of Eucalyptus vegetation and a range of physiological and morphological parameters. Results indicate a shift of red edge towards shorter wavelengths with decreasing chlorophyll content. Water index is derived from the ratio between reflectance measured at 900 nm and 970 nm and used as a measure of plant water content Canopy level spectral and thermal estimation of water status and nitrogen content using spectral and thermal indices Degree of water stress strongly correlated to spectral bands from VIS and NIR regions viz. 686, 811, 860, 850 bands using hyperspectral and multispectral data Detection of water stress using thermal remote sensing imagery Indices formulated from the weaker NIR liquid water absorption bands (980 and 1200) are linear in response to moisture fluctuations, and are strongly correlated to hydrological measures. Could be used to estimates near-surface and surface wetness at the landscape scale. Detection of plant water stress using wavelengths associated with red edge
Asner (1998)
Asner (1998) Blackburn (1998a)
Blackburn (1998b)
Lelong et al. (1998) Jacquemoud (1993) Baret and Jacquemoud (1994) Baret et al. (1994) Filella and Penuelas (1994) Lelong et al. (1998) Blackburn (1999)
Blackburn (1999) Blackburn (1999) Blackburn (1999)
Datt (1999) Datt (1999) Stone et al. (2001) Rock et al. (1988) Datt (1999) Stone et al. (2001)
Champagne et al. (2003) Fitzgerald et al. (2006) De Tar et al. (2006) Sepulcre-Cantó et al. (2006) Harris et al. (2006)
Clay et al. (2006) Blackburn (2007) Campbell et al. (2007)
VIS = Visible; NIR = Near Infrared; MIR = Middle Infrared; SWIR = Shortwave Infrared
detecting changes from the normal (unstressed) spectral reflectance patterns is the key to interpreting plant stress. Specific reflectance wavelengths in the red and near infrared region of the spectrum, which are sensitive to plant chlorophyll pigment variation, have been identified. Reflectance from 550 nm
744
and 700 nm shows maximum sensitivity to a wide range of chlorophyll contents (Curran et al., 1990; Carter, 1993; Gitelson and Merzlyak, 1996; Lichtenthaler et al., 1996, Datt, 1999). However, there is little agreement on the optimum wavelengths to be used in the remote assessment of plant chlorophyll content.
Available on website http://www.wrc.org.za ISSN 0378-4738 (Print) = Water SA Vol. 35 No. 5 October 2009 ISSN 1816-7950 (On-line) = Water SA Vol. 35 No. 5 October 2009
Indices have been derived using a combination of specific reflectance wavelengths for the remote assessment of chlorophyll content (Curran et al., 1990; Jacquemoud, 1993; Baret and Jacquemoud, 1994; Baret et al., 1994; Filella and Penuelas, 1994; Gitelson and Merzylak, 1996; Lichtenthaler et al., 1996; Blackburn, 1998a; Blackburn, 1998b; Lelong et al., (1998); Blackburn, 1999; Datt, 1999; Stone et al., 2001; Coops et al., 2003). These indices have been typically derived through correlations between leaf reflectance and leaf chlorophyll content, and are often developed for a single species with constant leaf size and shape, leaf surface and internal structure (Datt, 1999). However, the relationship between chlorophyll content and leaf or canopy reflectance is not necessarily generic and caution needs to be taken when applying these indices over different vegetation types or biomes for the prediction of plant water stress (Coops et al., 2003). In the remote assessment of plant water stress, total chlorophyll and chlorophyll a content have been identified as key spectral indicators. Chlorophyll a absorbs strongly in the red wavelengths because of electron transitions of the chlorophyll molecules. As the chlorophyll concentration increases, there is an apparent displacement in the slope of the spectral curve in the red wavelengths towards longer wavelengths (Horler et al., 1983). However, in a stressed plant there is a shift towards shorter wavelengths, often reported as the ‘blue shift’ (Carter, 1993). The interdependence of chlorophyll a and total chlorophyll provide an appropriate measure of changes in spectral reflectance due to plant water stress. If the relative proportion of chlorophyll a were to increase there would be a movement of the red edge to longer wavelengths, independent of total chlorophyll content. Likewise, a decrease in the relative proportion of chlorophyll a would result in a movement of the red edge to shorter wavelengths, also independent of total chlorophyll content. However, the effect of a changing chlorophyll a/chlorophyll b ratio on the red edge is likely to be minor and has proved difficult to observe compared to the effect of the total chlorophyll content (Guyot and Baret, 1988). Therefore, red reflectance is considered a reliable metric for total chlorophyll content and changes in leaf pigments (Horler et al., 1983). When chlorophyll content is used as a measure of plant water stress, the placement and shape of the spectral red edge are important indicators of plant water stress (Horler et al., 1983, Curran et al., 1990, Blackburn, 1999; Blackburn, 2007). This relationship is used to explain the movement of the red edge to shorter wavelengths during different expressions of plant water stress, such as senescence or stress-induced chlorosis (Collins et al., 1983; Rock et al., 1988; Milton and Mouat, 1989; Clay et al., 2006; Campbell et al., 2007).
Spectral indicators of plant water content Plant water content at the leaf and canopy scales is often estimated using specific spectral reflectance bands and spectral reflectance indices from near infrared, middle infrared (MIR) and short-wave infrared (SWIR) regions of the electromagnetic spectrum (Tucker, 1980; Hunt and Rock, 1989; Gao, 1995; Zarco-Tejada et al., 2003; Jackson et al., 2004; Shen et al., 2005; Chun-Jiang et al., 2006). NIR and MIR spectral bands are highly correlated to water content of vegetation and soils (Tucker, 1980; Hunt and Rock, 1989; Musick and Pelletier, 1986; 1988). Spectral bands from these regions have been used to delineate stressed trees from non-stressed trees (Tucker, 1980; Hunt and Rock, 1989; Musick
Available on website http://www.wrc.org.za ISSN 0378-4738 (Print) = Water SA Vol. 35 No. 5 October 2009 ISSN 1816-7950 (On-line) = Water SA Vol. 35 No. 5 October 2009
and Pelletier, 1986; 1988). In these regions of the electromagnetic spectrum, leaf water content has been remotely assessed using bands 1 550 nm to 1 750 nm (Tucker, 1980), as well as the ratio of spectral bands 1 550 nm to 1 750 nm and 2 080 to 2 350 nm (Musick and Pelletier, 1986; 1988). However, in laboratory experiments a good relationship was identified between water content, leaf area, and the spectral index derived using 820 nm and 1 600 nm spectral reflectance bands (Hunt and Rock, 1989). In these experiments MIR reflectance increased with decreasing leaf water content in California oak, blue spruce, soybean and sweetgum (Hunt and Rock, 1989). In the SWIR region (1 400 nm to 2 500 nm), field measurements have shown significant changes to this region of the spectrum resulting from changes in the water content of plants (Tucker, 1980; Ceccato et al., 2001). Several relationships have been identified between specific spectral bands in the SWIR region and different ground-based measurements of plant water stress such as relative water content, leaf water potential, stomatal conductance, and cell wall elasticity (Foutry and Baret, 1997; Pu et al., 2003). In particular, Foutry and Baret (1997) reported that the spectral wavelengths at 1 530 nm and 1 720 nm are most appropriate for assessing plant water content in both woody and herbaceous plant species. Several spectral indices have been derived to detect changes in plant water content for the remote assessment of plant water stress. The sensitivity of such spectral indices to changes in plant water content is influenced by the internal leaf structure. Therefore, some spectral indices may not be suitable for the detection of low or moderate levels of plant water stress (Eitel et al., 2006). Two spectral indices that have been successfully used are the normalised difference water index (Gao, 1995) and water band index (Penuelas et al., 1995). The normalised difference water index (Gao, 1995) is commonly used and accepted as an accurate estimate of plant water content. This index consists of the ratio of the difference between reflectance measured at 860 nm and 1 240 nm, and the sum of reflectance measured at 860 nm and 1 240 nm respectively (Gao, 1995). At these narrowband wavelengths, vegetation canopies have similar radiation-scattering properties, but slightly different liquid water absorption properties. Therefore, this index has been successfully applied to remotely detect plant water content for various tree species (Gao, 1995; Jackson et al., 2004; Stimson et al., 2005; Eitel et al., 2006). The water band index is derived from the ratio of reflectance measured at 900 nm and 970 nm (Penuelas et al., 1995). This spectral index has been correlated with ground-based measurements of plant water content at both the leaf and canopy scales. It is, however, more sensitive to leaf water content than the water content of the whole plant. This is advantageous in agricultural applications, where leaf water content changes more noticeably in response to drought conditions than the water content of the entire plant foliage (Champagne et al., 2003).
Factors affecting spectral reflectance from leaf to canopy scales The levels of spectral reflectance from a plant leaf or canopy are determined by a variety of factors. The factors that play a role in the spectral reflectance from a plant leaf or canopy include: species, site, age or maturity of plants or foliage, nutrient status, and leaf orientation, effects of variable irradiance, variable background, and the geometrical arrangement of the object/scene, sensor, and surface, orientation of the ground
745
surface in relation to the location of the sun and remote sensing device and meteorological conditions (Asner, 1998; Coops et al., 2003). Their individual or combined effects are relevant for measurements with ground-based field spectrometers, airborne and satellite remote sensing technologies. Remote sensors differ extensively in their ability to discriminate targets. Spatial resolution varies from less than a metre to several kilometres, with some models requiring input parameters from various data sources with different spatial resolutions (Chen, 1999). Furthermore, vegetation cover can be spatially highly heterogeneous, and variability within a pixel is likely to introduce uncertainties when processing and applying remote sensing imagery at different spatial resolutions (Jiang et al., 2006). Spectral data collected at the leaf scale usually contain the least amount of variability and are most easily correlated to ground-truthing experiments at the same spatial scale. Groundtruthing in conjunction with remote sensing surveys is often undertaken at the leaf scale, due to the complexity of groundtruthing at larger spatial scales, and the difficulty in accounting for the significant variability in canopy reflectance. Therefore, spectral features and relationships which have been identified at the leaf scale in such studies have often also been applied generically at canopy and landscape scales (Mohammed et al., 1997; Datt, 1999; Zarco-Tejada et al., 2000; Coops et al., 2003). Despite the difficulty in reproducing canopy reflectance, attempts have been made by stacking leaves on top of each other for below-canopy spectral measurements (Blackburn, 1999; Datt, 1999; Coops et al., 2003). The disadvantage of the leaf-stacking method is that it is unable to represent the absolute radiation interactions which occur at the canopy scale. It also fails to replicate, for example, canopy architecture, leaf angle distribution, the reflectance of trunks and branches, and the contribution of the wider canopy outside of the instrument field of view. Thus, its use is limited. It does, however, assist in controlling the impact of variables such as background reflectance, irradiation levels and sun-target-sensor geometry which do affect spectral reflectance measurements of the canopy scale. The removal of atmospheric and background interferences is necessary when processing remote sensing data. Various types of calibration models can be applied depending upon the quantity and quality of calibration data recorded during the remote sensing acquisition surveys. Alternatively, the removal of atmospheric and background interferences could be omitted when vegetation spectral reflectance indices, which account for differences in atmospheric and background effects, were applied in sparsely vegetated environments (Giannico, 2004). Furthermore, the magnitude of atmospheric and background interferences is greater as spatial resolution decreases from ground to stand and canopy levels; and spectral resolution increases from multispectral to hyperspectral data.
Detection of plant water stress using groundbased measurements Simple and quick ground-truthing methods which utilise portable instruments are needed for the measurement of plant water stress. Commonly used techniques address aspects of the plant water status and plant pigment concentration. Predawn leaf water potential Predawn leaf water potential measurements, often undertaken with a pressure chamber, are useful for determining plant water
746
stress. At predawn, xylem water potential has equilibrated with soil water potential after a night of negligible transpiration. At this time, plant water potential is usually at its minimum for the day (Cleary and Zaerr, 1984). The pressure chamber is most commonly used for estimating leaf water potential, having the advantage of simplicity, reliability, instantaneous measurements, low capital cost and portability (Scholander et al., 1965; Boyer, 1968; Ritchie and Hinckley, 1975). The equipment design has not changed significantly over the past 4 decades since Scholander et al. (1965) used this technique to measure the water relations of trees and shrubs. Manual operation is still required, therefore this technique is considered slow and time-consuming for any commercial or operational applications (Jones, 2004). Measurement of predawn leaf water potential has gained wide acceptance among researchers. It is commonly used as a plant water stress indicator (Aranda et al., 2005; Nortes et al., 2005; Intrigliolo and Castel, 2006; Pellegrino et al., 2006) and has also been used to describe the water status of different species within a habitat (Scholander et al., 1965; Lamont and Witkowski, 1995). Predawn leaf water potentials have been shown to differ among species in the same habitat (Witkowski et al., 1992; Lamont and Witkowski, 1995), within a species across different habitats, and with leaf age (Witkowski et al., 1992) and within a species across different plant sizes (Lamont et al., 1994). Typical plant water potential measurements of unstressed plants range from -0.15 MPa for plants under saturated soil conditions and low atmospheric demand (Cleary and Zaerr, 1984) to -2.0 MPa for ‘tank’ plants such as cactus, which can store water (Scholander et al., 1965). Conversely, stressed plants such as creosote bush and juniper growing in more arid regions could achieve plant water potentials of -8.0 MPa (Scholander et al., 1965), while for desert plants it can be much higher. Predawn leaf water potential measurements have also been successfully used in agricultural applications to evaluate plant water stress. Such applications have included estimates of transpiration of soil water and assessments of crop water stress resulting from irrigation scheduling of grapevine field sites and fruit orchards (Intrigliolo and Castel, 2006; Pellegrino et al., 2006). Predawn leaf water potentials have also been coupled with stem water potential measurements and fluctuations in trunk diameters to quantify water stress of young almond trees for irrigation management (Nortes et al., 2005). Despite the wide application of predawn pressure chamber measurements, numerous sources of error and measurement problems have been identified (Ritchie and Hinckley, 1975). These need to be minimised in order to ensure accurate readings, and can be grouped into 4 categories, viz. speed of measurement in the field; appropriate selection and processing of samples; reduction in pressurisation problems with the chamber; and correct identification of the end point. In the field, speed of measurement is of major importance. Moisture loss between time of sampling and measurement must be minimised (Ritchie and Hinckley, 1975; Turner, 1988; Campbell, 1990; Hsiao, 1990; Smith and Prichard, 2003). Measurements should take place directly after excision of the plant sample. If this is not possible, samples should be enclosed in plastic bags immediately after cutting and stored in a cool dark place until required. However, if time-delays occur between predawn sampling and actual measurements, this could result in inaccurate measurements (Clear and Zaerr, 1984; Turner, 1988). Great care should be taken in selecting and processing samples. It is important to standardise the sampling process
Available on website http://www.wrc.org.za ISSN 0378-4738 (Print) = Water SA Vol. 35 No. 5 October 2009 ISSN 1816-7950 (On-line) = Water SA Vol. 35 No. 5 October 2009
with respect to leaf age and development stages when making a comparison between plant species (Witkowski et al., 1992). Damaged samples (crushed leaf petiole or torn leaf blades) and re-cutting of sample stems (Scholander et al., 1965), lead to a break in the tension in the xylem water, and should thus be avoided (Clear and Zaerr, 1984; Turner, 1988). Furthermore, the portion of the leaf or stem external to the seal in the pressure chamber unit must be minimised to reduce exclusion errors (Miller and Hansen, 1975; Hsiao, 1990). Several technical guidelines must be adhered to in order to reduce pressurisation problems within the chamber. Failure to achieve pressure equilibrium should be addressed by ensuring that the seal used in the pressure chamber is made of rubber that is sufficiently elastic to fill the indentations of irregularly shaped petioles, but not so soft that it disintegrates under pressure. For very irregular petioles, a quick-setting silicon compound can be used. However, this slows down the number of leaves that can be measured (Turner, 1988). High-pressure grease or a silicon adhesive compound should be used on the stopper to prevent or reduce leakage and to prevent leaf damage. Studies on the optimal rates of pressurisation of the chamber and the effects of rapid pressure and heat build-up within the chamber have shown that fast rates of pressurisation can lead to both underestimates or overestimates of water potential depending on the gradients of water potential in the sample (Waring and Cleary, 1967; Blum et al., 1973; Tyree and Dainty, 1973; Turner, 1981). Therefore, Turner (1981) suggested an average pressurisation rate of 0.025 MPa∙s-1. Furthermore, caution must be taken in the use of the compressed gas within the pressure chamber. Pressure-release valves protect the pressure gauges and also help prevent over-pressurisation of the chamber (Turner, 1988). A binocular microscope or safety glasses should be used to protect the operator’s eyes if any material is forced out through the seal during pressurisation (Turner, 1988). Correct identification of the endpoint, when the xylem sap just returns to the cut surface of the xylem, is critical for accurate estimation of the water potential (Ritchie and Hinckley, 1975; Turner, 1988; Campbell, 1990; Hsiao, 1990; Smith and Prichard, 2003). Use of a binocular microscope or magnifying glass may be necessary to minimise poor endpoint recognition. Field equipment required for leaf water potential measurements is relatively easy to set up within a specific location, but can be cumbersome when there are many sample sites which are not in close proximity to each other. When accounting for the time required for setting up of the instrument, gathering of samples and the actual measurement at predawn, only a limited number of measurements is possible within this timeframe. Therefore, from a practical view point this method would be more appropriate for localised measurements, as compared to large-scale measurements. Leaf chlorophyll fluorescence Over the past decade, chlorophyll fluorescence kinetics has been used more extensively to provide considerable information on the organisation and function of the photosynthetic apparatus (Govindjee et al., 1981). Information is gathered more readily and repeatedly outside the laboratory using portable optical systems and compact chlorophyll fluorescence meters. The functioning of the photosynthetic apparatus is dependent on the process of photosynthesis, whereby light energy is absorbed and converted into organic compounds. Several environmental factors, including water, light and nutrients,
Available on website http://www.wrc.org.za ISSN 0378-4738 (Print) = Water SA Vol. 35 No. 5 October 2009 ISSN 1816-7950 (On-line) = Water SA Vol. 35 No. 5 October 2009
affect this process and may lead to plant stress. Therefore, the photosynthetic apparatus has been recognised as being a good indicator of stress and stress adaptation of a plant and is associated with the measurement of chlorophyll fluorescence (Salisbury and Ross, 1992; Strasser and Tsmilli-Michael, 2001; Strasser et al., 2001). Also, because changes in chlorophyll fluorescence may occur before any physical signs of tissue or chlorophyll deterioration are manifested in the plant, stress can be detected before the onset of physical damage (Lichtenthaler et al., 2007). Chlorophyll fluorescence measurements can be described using the typical phases of a temporary fluorescence signal or transient. During a typical fluorescence transient, the fluorescence rises rapidly from a ground state, O (or Fo) initial or minimal fluorescence, when all electron acceptors are fully oxidised, or open, to a maximum level, P (or Fm), when all electron acceptors are highly reduced, or closed and are unable to accept and transfer electrons (Rolando and Little, 2003). Various parameters representing subsequent phases in a typical fluorescence transient can yield information on how stress affects the functioning of the photosynthetic system (Strasser et al., 2001; Rolando and Little, 2003). Photochemical efficiency is a common parameter used to assess the effect of environmental stresses on the photosynthetic mechanism (Strasser and Tsmilli-Michael, 2001). The photochemical efficiency of Photosystem II (PSII) is estimated by Fv /Fm, which is the ratio of variable fluorescence (Fv) to maximum fluorescence (Fm). Most healthy plants exhibit Fv /Fm values of around 0.8 (Peterson et al., 2001). In most studies on the applications of chlorophyll fluorescence, the Fv /Fm ratio is used as an indicator of water stress (Govindjee et al., 1981; Havaux and Lannoye, 1983; Ögren, 1990; Van Rensburg et al., 1996; Van der Mescht et al., 1997; Lu and Zhang, 1999; Peterson et al., 2001; Rolando and Little, 2003; Cifre et al., 2005). In these studies, it has been well documented that at the chloroplast level, the function of the thylakoid membrane is sensitive to environmental stress (Öquist, 1987). Studies which have focused on deep-rooted exotic tree species have suggested that a decrease in Fv /Fm is due to drought-induced injury to the thylakoid structures affecting photosynthetic electron transport (Van Rensburg et al., 1996; Van der Mescht et al., 1997; Lu and Zhang, 1999). These results indicated that Fv /Fm of drought-stressed trees was lower than the control trees, especially in the more drought-intolerant trees. Van Rensburg et al. (1996) found that the decrease in Fv /Fm was due largely to an increase in Fo, an indication of permanent damage to the PSII. PSII appears to be particularly sensitive to a number of stress factors including freezing temperatures and drought (Öquist and Wass, 1988). Rolando and Little (2003) also showed a decrease in Fv /Fm of water-stressed Eucalyptus grandis seedlings, resulting from a rise in Fo and a decrease in Fm. Since this ratio is a reflection of the maximum yield of primary photochemistry, Fv /Fm is also used as an indicator of tree or seedling vigour. Water stress leads to several other changes in the photosynthetic apparatus of plants. Low water potential has been observed to cause a decrease in the quantum yield of O2 evolution in chloroplasts and leaves from sunflower plants; a decrease in the ability of the coupling factor isolated from spinach leaves to bind fluorescent nucleotides; and a decrease in the ratio of the maximum to the minimum fluorescence in the red algae Porphyrs sanjuanesis (Govindjee et al., 1981). Data presented on the relationship between maximum to minimum fluorescence ratios and the water potential of leaves of
747
Nerium oleander, Atriplex triangularis and Tolmiea menziesii, suggest that water stress blocks electron flow to the reaction centre chlorophyll a of PSII (Govindjee et al. (1981). It was clear from these results that the ratio of maximum to minimum fluorescence decreases from a high value of 4.0 in well-watered Nerium oleander plants (water potential -0.8 MPa) to a low value of 1.1 in a severely stressed plant (water potential -3.9 MPa). In all cases examined, the ratio decreased as the water potential decreased. Because of these results, Govindjee et al. (1981) concluded that water stress inhibited electron flow of PSII in the 3 species examined, and that this ratio serves as a qualitative indicator of leaf water potential. The use of chlorophyll fluorescence ratios as an index of plant water stress has gained increasing acceptance in recent years, and is commonly measured using hand-held relatively low-cost portable instruments which are simple, rapid and nondestructive (Peterson et al., 2001; Strasser et al., 2001; Strasser and Tsmilli-Michael, 2001; Rolando and Little, 2003; Cifre et al., 2005; Lichtenthaler et al., 2007). With the development of an internal saturating light source in portable field fluorescence meters, chlorophyll fluorescence measurements can now be undertaken at any time of the day, from shaded or sunlit samples. Chlorophyll fluorescence measurements can be used in conjunction with other techniques as a relatively quick initial screening method for assessing plant stress within a localised area. There have also been significant advances in the application of chlorophyll fluorescence at larger spatial scales over the past decade, allowing for spatial detection of chlorophyll fluorescence parameters using laser-based fluorometers (Ounis et al., 2001; Cifre et al., 2005). Such technological improvements in chlorophyll fluorescence measurements would complement the ground-truthing of remote sensing imagery. However, further investigations are needed to establish its applicability for different crops under different conditions (Cifre et al., 2005). A disadvantage is that these instruments have not yet been designed for commercial or operational use. Chlorophyll and carotenoid pigment concentration Plant pigment concentrations vary with species, ecotype and phenology, and are also affected by season and various kinds of natural and anthropogenic stresses (Gitelson and Merzylak, 1997). Healthy plants, those capable of maximum growth, are generally expected to have higher chlorophyll pigment concentrations than unhealthy plants. Reduced chlorophyll concentrations are often associated with stressed plants, with variations in total chlorophyll to carotenoid ratios used as stress indicators (Netto et al., 2005; Lichtenthaler et al., 2007). Carotenoids play an important role in protecting the photosynthetic apparatus, and regulate the flow of energy into and out of the photosynthetic system (Sims and Gamon, 2002; Netto et al., 2005). Two commonly used approaches have been adopted to quantify chlorophyll and carotenoid pigment concentrations in plants, viz. conventional chemical methods and field chlorophyll meters. Conventional chemical methods of pigment quantification require destructive sampling and time-consuming laboratory analyses, whereas chlorophyll meters are simple, portable field instruments which permit rapid non-destructive measurements. Conventional analytical chemistry methods used for estimating chlorophyll and carotenoid pigment concentrations are seen to be most accurate, provided that correct sampling and laboratory procedures are followed. These methods make
748
use of spectrophotometry to estimate pigment concentrations in plant extractions from the linear absorption characteristics of these pigments in polar extractants at specific wavelengths. Concentrations are calculated taking cognisance of the extractant and the specific extinction coefficients as described in Lichtenthaler (1987). Two precautions are recommended when sampling and during laboratory analysis: rapid and efficient collection of samples which must be immediately frozen using liquid nitrogen to prevent pigment deterioration, and minimal loss of pigment during laboratory extraction and dilution procedures in order to reduce the variability of the results. If the research is taking place in remote areas, liquid nitrogen can be substituted with sufficient dry ice or ice packs (Curran et al., 1990; Datt, 1998; Pinkard et al., 2006). Chlorophyll meters are portable field instruments that allow for non-destructive repetitive sampling; they have successfully been used to estimate the chlorophyll content of many plant species (Schaper and Chacko, 1991; Netto et al., 2005; Pinkard et al., 2006). A chlorophyll index derived from two peak reflectance wavelengths, 650 nm and 940 nm, is used to estimate the observed chlorophyll content in a sample. However, several factors such as different plant species, leaf weight, leaf age and growing conditions may affect the relationship between the chlorophyll index and actual chlorophyll concentration. Therefore, calibration curves are required for many species, site and experimental conditions (Pinkard et al., 2006). Leaf-water content Relative leaf water content is an indirect and gross estimate of the changes in the water content in leaves (Canny and Huang, 2006). Most water in leaves resides in mesophyll cells. Volumetric changes in these cells occur as the balance shifts between the rate of evaporation from leaves and the rate of water supply to the leaves. Volumetric changes in the leaves of plants affect many internal plant conditions such as tension in the cell walls, exchange of water and carbon dioxide across cell membranes, osmotic pressure of vacuole contents, cell and tissue turgor, cell-to-cell contact and transport of water. Measurements of the relative water content of leaf tissue are commonly used to assess the water status of plants (Barrs and Weatherley, 1962; Catsky, 1969; Turner, 1981; Joly, 1985; Yamasaki and Dillenburg, 1999; Shen et al., 2005; Canny and Huang, 2006). Relative leaf water content is expressed as the ratio of three weight determinations viz. fresh weight; dry weight and turgid weight of the leaf sample. It is calculated as the ratio of fresh weight minus dry weight to turgid weight minus dry weight. It is mportant that sampling procedures are meticulous to prevent evaporative losses of water from the leaf samples (Barrs and Weatherley, 1962; Catsky, 1969; Turner, 1981; Joly, 1985; Yamasaki and Dillenburg, 1999; Shen et al., 2005; Canny and Huang, 2006). Samples must be stored immediately in plastic bags and kept in a cool, dark place to reduce moisture loss prior to fresh weight measurements. Furthermore, the validity of relative water content measurements depends on the precision of the three weight determinations; a reliable estimate of turgid weight being the most critical (Joly, 1985). A typical water absorption curve for a leaf shows a high initial rate of absorption, followed by a prolonged period of slow absorption (Yamasaki and Dillenburg, 1999). The amount of water initially absorbed has been commonly interpreted as being the amount of water needed to compensate for the water deficit of the plant tissue. Further water absorption is driven
Available on website http://www.wrc.org.za ISSN 0378-4738 (Print) = Water SA Vol. 35 No. 5 October 2009 ISSN 1816-7950 (On-line) = Water SA Vol. 35 No. 5 October 2009
by cell expansion, so that mass changes occurring during this phase are not used in the estimation of the relative water content of the sample. Therefore, an accurate measurement of turgid weight should be determined at the end of the first initial phase of water absorption (Yamasaki and Dillenburg, 1999). Water absorption periods usually recommended for conifers range from 12 to 48 hours, which is much longer than the 4 hour period usually required for most broad leaved plants (Yamasaki and Dillenburg, 1999). To reduce water absorption periods, smaller leaf disks which absorb water more quickly are commonly used instead of larger whole leaves (Barrs and Weatherley, 1962). This method may however, also allow more water infiltration through intercellular spaces, thereby resulting in a greater water absorption per unit of leaf mass, when compared to absorption in whole leave (Barrs and Weatherley, 1962; Joly, 1985). Measuring the relative leaf water content of plants is a simple yet time-consuming process. Comparative measurements between stressed and unstressed plants should be undertaken during the morning when differences in water potentials between plants are greatest (Cleary and Zaerr, 1984). Due to these time constraints this method is most appropriate for localised ground-truthing measurements.
Comparison of ground-based measurement techniques for measuring plant water stress It has been suggested in this review that all 4 ground-based measurements, viz. predawn leaf water potentials, chlorophyll fluorescence, chlorophyll and carotenoid pigment concentrations and leaf water content can be used successfully to measure or assess plant water stress. However, these 4 methods are not suitable for large spatial scale sampling, and would be most
useful for localised studies or for localised ground-truthing of remote sensing applications. Sampling protocols for groundtruthing applications are dependent upon the spatial scales at which the remote sensing studies are being undertaken, viz. leaf, canopy, stand or landscape scale and, hence sample sizes will differ accordingly. A summary of some of the advantages and disadvantages of each ground-based method is listed in Table 2. These 4 ground-based measurements vary in their practical use as well as in the physiological processes measured. Differences in these methods as well as the processes measured may be affected by different sources of variability, which in turn may affect the strength of the relationship to spectral indices (Stimson et al., 2005). As a result, strong relationships may exist between certain ground measurements and spectral indices, while others may be poorer for a specific plant species. For example the water band index derived by Gao (1995) focused on water content of vegetation and therefore could be more strongly correlated to leaf water content measurements than plant pigment concentrations and vice versa. Different ground-based measurements of plant water stress may be preferred depending upon the research conditions under which a particular method is being applied. For airborne and satellite remote sensing vegetation studies, ground-truthing techniques which are cost effective, efficient and reliable and can be applied over localised ground-truthing regions within a reasonable time-frame of acquiring the remote sensing images would be preferred. Under such research conditions measurements of chlorophyll fluorescence or leaf water content would be more suited. On the other hand, measurements of predawn leaf water potential or chlorophyll pigment concentrations could be used for smaller-scale intensive sampling. However, should costs be constraining factor predawn leaf water
Table 2 Advantages and disadvantages of 4 ground-based methods for measuring plant water stress Ground-based method for measuring plant water stress
Advantages
Predawn leaf water Simple, reliable, instantaneous measurement, low capital potential cost, portable, direct indication of plant water stress. All parts of plant at predawn should be at same water potential. Leaf chlorophyll fluorescence
Hand-held portable, lightweight field instruments, simple, rapid non-destructive sampling, relatively low capital cost, internal saturating light source present in latest models, measurements can be taken at any time of the day, technology advances for remote sensing applications using laserbased fluorometers. Chlorophyll and a. Conventional analytical chemistry methods carotenoid pigment Foundations in well-researched methodologies of concentrations spectrophotometry.
Leaf water content
b. Chlorophyll meter Simple, portable, non-destructive sampling, allows for repeated measurements on the same sample over time, instantaneous measurement Simple, no capital costs, low precision analytical measurements
Available on website http://www.wrc.org.za ISSN 0378-4738 (Print) = Water SA Vol. 35 No. 5 October 2009 ISSN 1816-7950 (On-line) = Water SA Vol. 35 No. 5 October 2009
Disadvantages
Slow and time-consuming for landscapescale measurements; not suitable for use over large spatial scales; can be cumbersome when sampling sites are not in close proximity to each other; destructive sampling. Pre-dawn sampling is inconvenient. Not designed for use over large spatial scales.
Problem in keeping leaves fresh to avoid chlorophyll degradation. Destructive sampling, time consuming. Calibration required to obtain actual chlorophyll concentrations for different species and environments. Validity dependent on precision of weight determinations, time-consuming, destructive sampling
749
potential measurements would be preferred over laboratory analyses of plant chlorophyll pigment concentrations. In summary it is recommended that a more complete but practical approach to assessing plant water stress is adopted. At least one ground-based technique such as plant pigment concentrations, chlorophyll fluorescence or relative leaf water content should be used for localised ground-truthing measurements to identify gradients in plant water stress, followed by intensive predawn leaf water potential measurements along these gradients to identify the extremes in plant water stress.
Concluding remarks This review demonstrates that there has been extensive research on the detection and measurement of plant water stress using ground-based and remote sensing technologies. Ground-based techniques are more suited for localised measurements and for ground-truthing of remotely sensed data. Remote sensing research has identified several individual spectral bands and vegetation spectral reflectance indices which have been used to detect plant water stress. Many of the earlier studies have focused on broad spectral bandwidths and it is recommended that plant stress researchers utilise the spectral findings to further investigate the potential of narrow hyperspectral bandwidths to detect and interpret patterns of plant stress. Furthermore, the importance of the red edge defined as the region between 690 and 740 nm has gained increasingly more attention over the years, and is seen as one of the most important regions of the spectrum when investigating plant stress. It is also recommended that the results from hyperspectral studies should be incorporated in multispectral technologies through modified imaging systems or spectral filters to allow for specialised high spectral resolution investigations to be undertaken with reduced data volumes in a cost-effective manner. Most spectral indices have been derived for a single species with constant leaf size and shape, leaf surface and internal structure, implying that their usefulness varies with respect to species and site conditions. Therefore, the most commonly used indices reported in the literature must be evaluated against ground-truthing data. Ground-truthing of remote sensing data is not an easy task especially when considering different temporal and spatial scales. Depending upon the scale at which an investigation is being undertaken, it is recommended that a practical approach to assessing plant water stress is adopted through the use of at least one ground-based measurement, viz. plant pigment concentrations, chlorophyll fluorescence or relative leaf water content to identify gradients in plant stress, and to then undertake predawn leaf water potential measurements along this gradient, specifically to identify the extremes in plant water stress.
Acknowledgements Acknowledgement for funding for this work is made to the Mine Woodlands Project (School of Animal, Plant and Environmental Sciences, University of the Witwatersrand, Johannesburg, South Africa), the South African Department of Trade and Industry (THRIP funding), AngloGold Ashanti Ltd. and the CSIR.
References ALDER NN, SPERRY JS and POCKMAN WT (1996) Root and stem xylem embolism, stomatal conductance, and leaf turgor in Acer
750
grandidentatum populations along a soil moisture gradient. Oecol. 105 293-301. ARANDA I, CASTRO L, PARDOS M, GIL L and PARDOS JA (2005) Effects of the interaction between drought and shade on water relations, gas exchange and morphological traits in cork oak (Querucus suber L.) seedlings. For. Ecol. Manage. 210 117-129. ASNER GP (1998) Biophysical and biochemical sources of variability in canopy reflectance. Remote Sens. Environ. 64 234-253. BARET F and JACQUEMOUD S (1994) Model inversion to retrieve canopy characteristics from high spectral resolution data. Proc. 6th Int. Symp. Physical Measurements and Signatures in Remote Sensing. 17-21 January 1994, Val d’Isère, France. BARET F, VANDERBILT VC, STEVEN MD and JACQUEMOUD S (1994) Use of spectral analogy to evaluate canopy reflectance sensitivity to leaf optical properties. Remote Sens. Environ. 48 253-260. BARRS HD and WEATHERLY PE (1962) A re-examination of the relative turgidity technique for estimating water deficits in leaves. Aus. J. Biol. Sci. 15 413-428. BLACKBURN GA (1998a) Quantifying chlorophylls and carotenoids at leaf and canopy scales: an evaluation of some hyperspectral approaches. Remote Sens. Environ. 66 273-285. BLACKBURN GA (1998b) Spectral indices for estimating photosynthetic pigment concentrations: a test using senescent tree leaves. Int. J. Remote Sens. 19 657-675. BLACKBURN GA (1999) Relationship between spectral reflectance and pigment concentrations in stacks of deciduous broadleaves. Remote Sens. Environ. 70 224-237. BLACKBURN GA (2007) Hyperspectral remote sensing of plant pigments. J. Exp. Bot. 58 855-867. BLUM A, SULLIVAN CY and EASTIN JD (1973) On the pressure chamber technique for estimating leaf water potential in sorghum. Agron. 65 337-338 BOYER JS (1968) Relationship of water potential to growth of leaves. Plant Phys. 43 1056-1062. CAMPBELL GS (1990) Instrumentation of studying vegetation canopies for remote-sensing in optical and thermal infrared regions water potential in soils and plants. Remote Sens. Rev. 5 249-261. CAMPBELL PKE, MIDDLETON EM, McMURTREY JE, CORP LA and CHAPPELLE EW (2007) Assessment of vegetation stress using reflectance or fluorescence measurements. J. Environ. Qual. 36 832-845. CANNY MJ and HUANG CX (2006) Leaf water content and palisade cell size. New Phytol. 170 75-85. CARTER GA (1993) Responses of leaf spectral reflectance to plant stress. Am. J. Bot. 80 239-243. CATSKY J (1969) Temperature effects in the measurement of water saturation deficit (relative water content) in tobacco and kale. Biol. Plantarum 11 381-383. CECCATO P, FLASSE S, TARANTOLA S, JACQUEMOUD S and GREGOIRE J-M (2001) Detection vegetation leaf water content using reflectance in the optical domain. Remote Sens. Environ. 77 22-33. CHAMPAGNE CM, STAENZ K, BANNARI A, McNAIRIN H and DEGUISE JC (2003) Validation of a hyperspectral curve fitting model for the estimation of plant water content of agricultural canopies. Remote Sens. Environ. 87 148-160. CHEN J (1999) Spatial scaling of a remotely sensed surface parameter by contexture. Remote Sens. Environ. 69 30-42. CHUN-JIANG Z, JI-HUA W, LIANG-YUN L, WEN-JIANG H and QI-FA Z (2006) Relationship of 2 100-2 300nm spectral characteristics of wheat canopy to leaf area index and leaf N as affected by leaf water content. Pedosphere 16 333-338. CIFRE J, BOTA J, ESCALONA JM, MEDRANO H and FLEXAS J (2005) Physiological tools for irrigation scheduling in grapevine (Vitis vinifera L.) An open gate to improve water-use efficiency. Agric. Ecosys. Environ. 106 159-170. CLAY DE, CHANG KKJ, CLAY SA, and DALSTED K (2006) Characterizing water and nitrogen stress in corn using remote sensing. Agron. J. 98 579-587. CLEARY B and ZAERR J (1984) Guidelines for Measuring Plant Moisture Stress with a Pressure Chamber. PMS Instrument
Available on website http://www.wrc.org.za ISSN 0378-4738 (Print) = Water SA Vol. 35 No. 5 October 2009 ISSN 1816-7950 (On-line) = Water SA Vol. 35 No. 5 October 2009
Company. Royal Oaks Drive, Corvallis, Oregon, USA. COLLINS W, CHANGE SH, RAINES G, CANNEY F and ASHLEY R (1983) Airborne biogeophysical mapping of hidden mineral deposits. Ecol. Geol. 78 737-749. COOPS N, DURY S, SMITH ML, MARTIN M and OLLINGER S (2002) Comparison of green leaf eucalypt spectra using spectral decomposition. Aust. J. Bot. 50 567-576. COOPS N, STONE C, CULVENOR DS, CHISHOLM LA and MERTON RN (2003) Chlorophyll content in eucalypt vegetation at the leaf and canopy scales as derived from high resolution spectral data. Tree Physiol. 23 23-31. CURRAN PJ, DUNGAN JL and GHOLZ HL (1990) Exploring the relationship between reflectance red edge and chlorophyll content in slash pine. Tree Physiol. 7 33-48. CURRAN PJ, DUNGAN JL, MACLER BA and PLUMMER SE (1992) The effect of a red leaf pigment on the relationship between red-edge and chlorophyll concentration. Remote Sens. Environ. 35 69-75. DATT B (1998) Remote sensing of chlorophyll a, chlorophyll b, chlorophyll a + b, and total carotenoid content in Eucalyptus leaves. Remote Sens. Environ. 66 111-121. DATT B (1999) A new reflectance index for remote sensing of chlorophyll content in higher plants: tests using Eucalyptus leaves. J. Plant Physiol. 154 30-36. DE TAR WR, PENNER JV and FUNK HA (2006) Airborne remote sensing to detect plant water stress in full canopy cotton. Trans. Soc. Agric. Bio. Eng. 49 655-665. DIXON HH (1914) Transpiration and the Ascent of Sap in Plants. Macmillan, London. 75p. EITEL JUH, GESSELER PE, SMITH AMS and ROBBERECHT R (2006) Suitability of existing and novel spectral indices to remote detect water stress in Populus spp. For. Ecol. Manage. 229 170-182. FILELLA I and PENUELAS J (1994) The red edge position and shape as indicators of plant chlorophyll content, biomass and hydric status. Int. J. Remote Sens. 15 1459-1470. FITZGERALD GJ, RODRIGUEZ D, CHRISTENSEN LK, BELFORD R, SADRAS VO and CLARKE TR (2006) Spectral and thermal sensing for nitrogen and water status in rainfed and irrigated wheat environments. Precis. Agric. 7 233-248. FOUTRY T and BARET F (1997) Vegetation water and dry matter contents estimated from top of the atmosphere reflectance data: a simulation study. Remote Sens. Environ. 61 34-45. GAO BC (1995) Normalized difference water index for remote sensing of vegetation liquid water from space. Proc. Int. Soc. Optical Eng. 2480 225-236. GAUSSMAN HW (1977) Reflectance of leaf components. Remote Sens. Environ. 6 1-9. GIANNICO C (2004) Remote sensing of vegetation in the calabrian region. Acta Astronaut. 60 119-131. GITELSON AA and MERZLYAK MN (1996) Signature analysis of leaf reflectance spectra: algorithm development for remote sensing of chlorophyll. J. Plant Physiol. 148 494-500. GITELSON AA and MERZLYAK MN (1997) Remote estimation of chlorophyll content in higher plant leaves. Int. J. Remote Sens. 18 2691-2697. GITELSON AA, ZUR Y, CHIVKUNOVA OB and MERZLYAK MN (2002) Assessing carotenoid content in plant leaves with reflectance spectroscopy. Photochem. and Photobiol. 75 272-281. GOVINDJEE DOWNTON WJS, FORK DC and ARMOND PA (1981) Chlorophyll a fluorescence transient as an indicator of water potential of leaves. Plant Sci. Letter 20 191. GUYOT G and BARET F (1988) Utilization of high spectral resolution to follow the state of vegetable cover. Proc. 4th Int. Symp. Spectral Signatures of Objects in Remote Sens. 18-22 January, Aussois, France. pp. 54-61. HACKE U and SAUTER JJ (1996) Drought-induced xylem dysfunction in petioles, branches and roots of Populus balsamifera L. and Alnus glutinosa (L.) Gaertn. Plant Physiol. 111 413-417. HARRIS A, BRYANT RG and BAIRD AJ (2006) Mapping the effects of water stress on Sphagum: Preliminary observations using airborne remote sensing. Remote Sens. Environ. 100 363-378.
Available on website http://www.wrc.org.za ISSN 0378-4738 (Print) = Water SA Vol. 35 No. 5 October 2009 ISSN 1816-7950 (On-line) = Water SA Vol. 35 No. 5 October 2009
HAVAUX M and LANNOYE R (1983) Chlorophyll fluorescence induction: a sensitive indicator of water stress in maize plants. Irrig. Sci. 4 147-151. HOPE A, BURVALL A, GERMISHUYSE T and NEWBY T (2009) River flow responses to changes in vegetation cover in a South Africa fynbos catchment. Water SA 35 55-60. HORLER DNH, DOCKRAY M and BARBER J (1983) The red edge of plant reflectance. Int. J. Remote Sens. 4 273-288. HSIAO TC (1973) Plant responses to water stress. Ann. Rev. Plant Physiol. 24 519-570. HSIAO TC (1990) Plant-atmosphere interactions, evapo-transpiration, and irrigation scheduling. Acta Hort. 278 55-66. HUNT ER and ROCK BN (1989) Detection of changes in leaf water content using near- and middle infrared reflectances. Remote Sens. Environ. 30 43-54. INTRIGLIOLO DS and CASTEL JR 2006 Performance of various water stress indicators for prediction of fruit size response to deficit irrigation in plum. Agric. Water Manage. 83 173-180. JACKSON TJ, CHEN D, COSH M, LI F, ANDERSON M, WALTHALL C, DORIASWAMY P and HUNT ER (2004) Vegetation water content mapping using Landsat data derived normalized difference water index for corn and soybeans. Remote Sens. Environ. 92 475-482. JACQUEMOUD S (1993) Inversion of the PROSPECT + SAIL canopy reflectance model from AVIRIS equivalent spectra: theoretical study. Remote Sens. Environ. 44 281-292. JIANG Z, HUETE AR, CHEN J, CHEN Y, LI J, YAN G and ZANG X (2006) Analysis of NDVI and scaled difference vegetation index retrievals of vegetation fraction. Remote Sens. Environ. 101 366-378. JOLY RJ (1985) Techniques for determining seedling water status and their effectiveness in assessing stress. Proc. Evaluating Seedling Quality: Principles, Procedures and Predictive Abilities of Major Tests. 16-18 October 1984, Forest Research Laboratory, Oregon State University, Corvallis, US. JONES HG (2004) Irrigation scheduling: advantages and pitfalls of plant-based methods. J. Exp. Bot. 55 2427-2436. LAMONT BB, REES RG, WITKOWSKI ETF and WHITTEN VA (1994) Comparative size, fecundity and ecophysiology of roadside plants of Banksia hookeriana. J. App. Ecol. 31 137-144. LAMONT BB and WITKOWSKI ETF (1995) A test for lottery recruitment among four Banksia species based on their demography and biological attributes. Oecol. 101 299-308. LELONG CCD, PINET PC and POILVÉ H (1998) Hyperspectral imaging and stress mapping in agriculture: a case study on wheat in Beauce (France). Remote Sens. Environ. 66 179-191. LICHTENTHALER HK (1987) Chlorophyll and carotenoids: Pigments of photosynthetic biomembranes. Methods Enzym. 148 331-382. LICHTENTHALER HK, ALEXANDER AC, MAREK MV, KALINA J and URBAN O (2007) Differences in pigment composition, photosynthetic rates and chlorophyll fluorescence images of sun and shade leaves of four tree species. Plant Physiol. Biochem. 1-12. LICHTENTHALER HK, BUSCHMANN C, RINDERLE U and SCHMUCH G (1996) Application of chlorophyll fluorescence in ecophysiology. Radiat. Environ. Biophys. 25 297-308. LINTON MJ, SPERRY JS AND WILLIAMS DG (1998) Limits to water transport in Juniperus osteosperma and Pinus edulis: implications for drought tolerance and regulation of transpiration. Funct. Ecol. 12 906-911. LU C and ZHANG J (1999) Effects of water stress on photosystem II photochemistry and its thermostability in wheat plants. J. Exp. Bot. 50 1199-1206. MILLER BD and HANSEN GK (1975) Exclusion errors in pressure chamber estimates of leaf water potential. Ann. Bot. 39 915-920. MILTON NM and MOUAT DA (1989) Remote sensing of vegetation responses to natural and cultural environmental conditions. Photogramm. Eng. Remote Sens. 55 1167-1173. MOHAMMED GH, SAMPSON PH, COLOMBO SJ, NOLAND TL and MILLER J.R., (1997) Bioindicators of Forest Sustainability: Development of a Forest Condition Rating System for Ontario. Forest Research Information Paper No. 137, Ontario Forest Research Institute, Ontario, Canada. 22 pp.
751
MULLER NJC (1874) Investigations about the diffusion of the atmospheric gases and the gas removal under different lighting terms. Ann. Sci. Bot. 9 36-49. MURTHA PA (1982) Detection and analysis of vegetation stress. In: CJ Johannsen and JL Sanders (eds.) Remote Sensing for Resource Management. Soil Conservation Society of America. Ankeny, Iowa, USA. pp 141-158. MUSICK HB and PELLETIER RE (1986) Response of some Thematic Mapper band ratios to variation in soil water content. Photogramm. Eng. Remote Sens. 52 1661–1668. MUSICK HB and PELLETIER RE (1988) Response to soil moisture of spectral indexes derived from bidirectional reflectance in Thematic Mapper wavebands. Remote Sens. Environ. 25 167-184. NETTO AT, CAMPOSTRINI E, DE OLIVEIRA JG and BRESSANSMITH RE (2005) Photosynthetic pigments, nitrogen, chlorophyll a fluorescence and SPAD-502 readings in coffee leaves. Sci. Hortic. 104 199-209. NORTES PA, PASTOR-PÉREZ A, EGEA G, CONEJERO W and DOMINGO R (2005) Comparison of changes in stem diameter and water potential values for detecting water stress in young almond trees. Agric. Water Manage. 77 296-307. ÖGREN E (1990) Evaluation of chlorophyll fluorescence as a probe for drought stress in willow leaves. Plant Physiol. 93 1280-1285. ÖQUIST G and WASS R (1988) A portable, microprocessor operated instrument for measuring chlorophyll fluorescence kinetics in stress physiology. Physiol. Plantarum 73 211-217. ÖQUIST G (1987) Environmental stress and photosynthesis. In: J Biggins (ed.) Progress in Photosynthesis Research. Martinus Nijhoff Publishers, Dordrecht, The Netherlands. Vol. IV 1-10. OUNIS A, EVAINS, FLEXAS J, TOSTI J and MOYA I (2001) Adaptation of a PAM-fluorometer for remote sensing of chlorophyll fluorescence. Photosyn. Res.68 113-120. PELLEGRINO A, GOZÉ E, LEBON E and WERY J (2006) A model based diagnostic tool to evaluate the water stress experienced by grapevine in field sites. Eur. J. Agron. 25 49-59. PENUELAS J, FILELLA I, BIEL C, SERRANO L and SAVE R (1995) The reflectance at the 950-970 region as an indicator of plant water status. Int. J. Remote Sens. 14 1887-1905. PETERSON JA, GRONINGER JW, SEILER JR and MOU P (2001) Utility and limitations of chlorophyll fluorescence for the determination of growth limitations in trees. Proc. 10th Bienn. Southern Silvicult. Res. Conf. LA, USA?. USDA Technical Report. SRS-30. 480-484. PINKARD EA, PATEL V and MOHAMMED C (2006) Chlorophyll and nitrogen determination for plantation-grown Eucalyptus nitens and Eucalyptus globules using a non-destructive meter. For. Ecol. Manage. 223 211-217. PU R, GE S, KELLY NM and GONG P (2003) Spectral absorption features as indicators of water status in coast live oak (Quercus agrifolia) leaves. Int. J. Remote Sens. 24 1799-1810. RITCHIE GA and HINCKLEY TM (1975) The pressure chamber as an instrument for ecological research. Adv. Ecol. Res.9 165-255. ROCK BN, HOSHIZAKI T and MILLER JR (1988) Comparison of in situ and airborne spectral measurements of the blue shift associated with forest decline. Remote Sens. Environ. 24 109-127. ROLANDO CA and LITTLE KM (2003) Using chlorophyll fluorescence to determine stress in Eucalyptus grandis seedlings. S. Afr. For. J. 197 5-12. SALISBURY FB and ROSS CW (1992) Plant Physiology (4th edn.). Wadsworth Publishing Company, California, USA. 682 pp. SCHAPER H and CHACKO EK (1991) Relation between extractable chlorophyll and portable chlorophyll meter readings in leaves of eight tropical and subtropical fruit tree species. J. Plant Physiol. 138 674-677. SCHOLANDER PF, HAMMEL HT, BRADSTREET EA and HEMMINGSEN EA (1965) Sap pressure in vascular plants. Sci. 148 339-346. SEPULCRE-CANTÓ G, ZARCO-TEJADA PJ, JIMÉNEZ-MUNOZ JC, SOBRINO JA, DE MIGUEL E and VILLALOBOS FJ (2006)
752
Detection of water stress in an olive orchard with thermal remote sensing imagery. Agric. For. Meteorol. 136 31-44. SHEN Y, ZHENG RS and YAN CY (2005) Estimation models for vegetation water content at both leaf and canopy levels. Inst. Elec. Electron. Eng. 2 1387-1389. SIMS DA and GAMON JA (2002) Relationships between leaf pigment content and spectral reflectance across a wide range of species, leaf structures and development stages. Remote Sens. Environ. 81 337-354. SMITH R and PRICHARD T (2003) Using a pressure chamber in winegrapes: UC Cooperative Extension. www.cesonoma.ucdavis. edu/vitic/pdf/wine_grape_pressure_chamber.pdf (Accessed 2 October 2006). SPERRY JS and SALIENDRA NZ (1994) Intra- and inter-plant variation in xylem cavitation in Betula occidentalis. Plant, Cell Environ. 17 1233-1241. STIMSON HC, BRESHEARS DD, USTIN SL and KEFAUVER C (2005) Spectral sensing of foliar water conditions in two co-occurring conifer species: Pinus edulis and Juniperus monosperma. Remote Sens. Environ. 96 108-118. STONE C, CHISHOLM L and COOPS N (2001) Spectral reflectance characteristics of eucalypt foliage damaged by insects. Aust. J. Bot. 49 687-698. STRASSER RJ and TSIMILLI-MICHAEL M (2001) Stress in plants, from daily rhythm to global changes detected and quantified by the JIP-Test. J. Chim. Nouv. 75 3321-3326. STRASSER RJ, STRIVASTAVA A and TSIMILLI-MICHAEL M (2001) Analysis of the fluorescent transient. In: GC Papageorgiou and WJS Govindjee (eds.) Chlorophyll Fluorescence: A Signature of Photosynthesis. Kluwer Academic Publishers, Dordrecht, The Netherlands. TUCKER CJ (1980) Remote sensing of leaf water content in the near infrared. Remote Sens. Environ. 10 23-32. TURNER NC (1981) Techniques and experimental approaches for the measurement of plant water status. Plant and Soil 58 339-366. TURNER NC (1988) Measurement of plant water status by the pressure chamber technique. Irrig. Sci. 9 289-308. TYREE MT and DAINTY J 1973 The water relations of hemlock (Tsuga canadiensis). II. The kinetics of water exchange between symplast and apoplast. Can. J. Bot. 51 1481-1489. VAN DER MESCHT A, DE RONDE K, VAN DER MERWE T, LAURIE R, BESTER C and WENZEL C (1997) Evaluation of chlorophyll fluorescence as a measure of drought tolerance in Eucalyptus grandis. Proc. 4th IUFRO Conf. on Siviculture and Improvement of Eucalypts. August 1997, Embrapa, Salvador, Brazil. 117-124. VAN RENSBURG L, KRUGER GHJ, EGGENBERG P and STRASSER RJ (1996) Can screening criteria for drought resistance in Nicotiana tabacum L. be derived from the polyphasic rise of the chlorophyll a fluorescent transient (OJIP). S. Afr. J. Bot. 62 337-341. WARING RH and CLEARY BD (1967) Plant moisture stress: evaluation by pressure bomb. Sci. 155 1248-1254. WEATHERLEY PE (1950) Studies in the water relations of the cotton plant. I. The field measurement of water deficits in leaves. New Phytol. 49 81-97. WITKOWSKI ETF, LAMONT BB, WALTON C and RADFORD S (1992) Leaf demography, sclerophylly and ecophysiology of two banksias with contrasting leaf life spans. Aust. J. Bot. 40 849-62. YAMASAKI S and DILLENBURG LR (1999) Measurements of leaf relative water content in Araucaria Angustifolia. Rev. Bras. Fisiol. Veg. 11 69-75. ZARCO-TEJADA PJ, MILLER JR, MOHAMMED GH and NOLAND TL (2000) Chlorophyll fluorescence effects on vegetation apparent reflectance. I. Leaf-level measurements and model simulation. Remote Sens. Environ. 74 582-595. ZARCO-TEJADA PJ, RUEDA CA and USTIN SL (2003) Water content estimation in vegetation with MODIS reflectance data and model inversion methods. Remote Sens. Environ. 85 109-124.
Available on website http://www.wrc.org.za ISSN 0378-4738 (Print) = Water SA Vol. 35 No. 5 October 2009 ISSN 1816-7950 (On-line) = Water SA Vol. 35 No. 5 October 2009