We present a review of methods for increasing discrimination between efficient DMUs in Data. Envelopment Analysis. These methods were classified into two ...
Annals of Operations Research 116, 225–242, 2002 2002 Kluwer Academic Publishers. Manufactured in The Netherlands.
Review of Methods for Increasing Discrimination in Data Envelopment Analysis LIDIA ANGULO-MEZA and MARCOS PEREIRA ESTELLITA LINS
Programa de Engenharia de Produção, COPPE/UFRJ, Caixa Postal 68507, CEP 21945-970, Rio de Janeiro, RJ, Brazil
Abstract. We present a review of methods for increasing discrimination between efficient DMUs in Data Envelopment Analysis. These methods were classified into two groups: those that incorporate a priori information and those that do not use or minimize the use of such a priori information. We also compare these methodologies regarding their specific characteristics. Keywords: Data Envelopment Analysis, weight restrictions, Value Efficiency Analysis, cross-evaluation, super efficiency, multiple objectives model
Introduction Since the appearance of Data Envelopment Analysis [5], this methodology has been applied in real life studies, revealing some drawbacks, amongst which we can highlight: (a) lack of discrimination among efficient DMUs that occurs when the number of DMUs is small in comparison with the total number of variables in the analysis; (b) unfitness of the weighting scheme, which frequently can be unreal, giving a big weight to variables with less importance or giving a small (or zero) weight to important variables; (c) multiple optimal solutions for the weighting scheme of extreme efficient DMUs. This review was made with emphasis on the first problem (a) bearing in mind that it is closely related to problems (b) and (c). Some of the methodologies reviewed are not designed specifically for the purpose of increasing discrimination, this being rather a side-effect. We classified the methodologies into two groups: the first group comprises those methods that incorporate a priori information provided by a decision-maker or expert into the model, while the second group of methods does not require such a priori information. Within the first group we considered three streams: weight restrictions, preference structure and Value Efficiency Analysis. Within the second group we present three methodologies: super efficiency, cross-evaluation, and a multiple objective linear programming approach.
226
ANGULO-MEZA AND LINS
The work is organized as follows: in section 1, we introduce the methods with a priori information: weight restrictions, preference structure and Value Efficiency Analysis. In section 2, we view the three methodologies that do not require a priori information: super efficiency, cross-evaluation and a multiple objective model. The last section, consists of a summary and future directions. 1.
Methods with a priori information
We consider that the suitability of DEA results often depends on decision-maker preferences. The information provided by a decision-maker or an expert about the importance of the variables can be introduced into the DEA model. We review three methods devoted to incorporating a priori information or value judgements in DEA: weight restrictions, preference structure and Value Efficiency Analysis. 1.1. Weight restrictions The weight flexibility has been considered one of the main advantages of DEA. Total weights flexibility, allowed by classical DEA models, is also important to identify the inefficient DMUs that have low performance, even when choosing their best conceivable weights. However, there is a drawback: important factors could be ignored in the analysis, which happens when giving a zero weight to the corresponding variable or when the weight found is in contradiction with a priori knowledge, according to Allen et al. [1]. This deficiency in DEA has been overcome by weight restriction as a kind of value judgement procedure. The main objective of the weight restrictions methods is to establish bounds within which the weights can vary, preserving some flexibility or some uncertainty about the real value of the weights. Given that these restrictions are introduced in the original problem, the efficiency scores obtained with the new formulation will be less than or equal to the scores obtained with the original formulation. The number of efficient DMUs is reduced, improving discrimination. This by-product of weight restrictions is emphasized here, considering that the objective of this work is to identify how several methods can contribute to improving discrimination among DMUs. Pedraja-Chaparro et al. [22] and Allen et al. [1], present a review with several methods to do this, which we shall reproduce in a concise form. 1.1.1. Direct weight restrictions This approach was initially developed by Dyson and Thanassoulis [11], used by Beasley [4] and generalized by Roll, Cook and Golany [23]. In this approach the restrictions are of the type: αi � vi � βi αr � ur � βr
for input i, for output r.
REVIEW OF METHODS
227
As we can see, the restrictions impose numerical limits on the weights. The purpose of these limits is to ensure that some or all variable inputs and outputs would not be overestimated or ignored in the analysis. The values of the bounds depend on the context and on the information provided by an expert. Such bounds could be established only after analyses of the resulting weights of the original DEA problem, i.e., the problem was performed without restrictions. It is important to note that these models produce different efficiency scores depending on the orientation (input or output) of the model, even when using constant returns to scale. To apply this type of weight restrictions, we must run the DEA classic model to determine the weight dimensions for each variable (because it depends on the magnitude of the variable). Only after the analysis of the weights for all variables and all DMUs, are the restrictions introduced. If the model results are unfeasible, we can relax the restrictions until the unfeasibility disappears. 1.1.2. The Cone Ratio model The Cone Ratio Model was developed by Charnes et al. [6,7] and used by Kornbluth [20] among others. If the weights selected by the original formulation are not consistent with the objectives of some DMUs, then DEA could have overestimated the efficiency score of these DMUs. Applying restrictions of the Cone Ratio kind, one can better determine these weights, and obtain much more consistency with the objectives. This method arose from the observation of the space of the weights v and u. Let V = AT α, where AT = (a1 , . . . , ak ) ∈ �m×k and let α T = (α1 , . . . , αk ) be the polyhedral cone, where aj are the direction vectors (j = 1, . . . , k). In the same way, we can define the polyhedral cone for u as: U = B T β, where B T = (b1 , . . . , bn ) ∈ �m×n and β T = (β1 , . . . , βn ). With this information we can transform the data in the CCR model to include the Cone Ratio restrictions. Let the CCR model be: max uT y0 subject to v T x0 = 1, −v T X + uT Y � 0, v ∈ V, u ∈ U, s where V = �m + and U = �+ are the positive orthants in the m and s space, respectively. Then, using the definition of the V and U cones, we can write the model in terms of variables α and β,
max β T (By0 ) subject to α T (Ax0 ) = 1, −α T (AX) + β T (BY ) � 0, α � 0, β � 0.
228
ANGULO-MEZA AND LINS
And the dual model can be expressed as: min θ subject to θ(Ax0 ) − (AX)λ � 0, (By0 ) − (BY )λ � 0, λ � 0. In this way, the Cone Ratio model can be treated as a CCR model that evaluates the same DMUs with transformed data [8]. This allows us to use softwares that do not have the option to incorporate weight restrictions. We can also choose a DMU as a standard and use its weights to limit the weights range of other DMUs. Implementing Cone Ratio models always results in at least one efficient DMU. One disadvantage of this data transformation is that the results must be transformed back into the original form in order to interpret the results. 1.1.3. Assurance Region Thompson et al. [29] developed the concept of Assurance Regions – AR, introducing homogeneous linear restrictions. The AR approach allows successive incrementation of an assurance region until a refinement is reached in the efficiency levels that is satisfactory to the decision-maker or expert. The AR restrictions are of the form: αr u1 � ur � βr u1 , αi vi � vi � βi v1 , where the value for α and β must be provided by the expert. This AR is called the Assurance Region I, or simply ARI. Clearly, as in the previous cases, the bound values for AR are dependent on the levels of the inputs and outputs, i.e., they are sensitive to the scale measurement. We also notice that ARI is a special case of Cone Ratio. Thus, this will always result in at least one efficient DMU. The Assurance Region II – ARII was also proposed, which imposes restrictions on the ratio between input and output weights. It was shown that ARII could make the problem unfeasible. In this case there is no certainty that there will be at least one efficient DMU. 1.1.4. Virtual input and output restrictions The previous approaches imposed weight restrictions irrespective of the input or output levels used by the DMU. Weights were dependent on these levels, rendering the task of establishing a relationship among the several weights (with different scale of measurement) difficult. We shall now consider the contribution of a variable to the total efficiency as determined by its level (of input or output) times the weight. Thus, we can also consider a restriction on the virtual variable (weight times variable level) instead of directly on the weight.
REVIEW OF METHODS
229
Wong and Beasley [4] explore the use of such restrictions. Instead of restricting the weights directly, we can restrict the proportion of output r to the total virtual output of DMU j . So, for an output r we have: ur yrj � βr , αr � �s r=1 ur yrj
� where sr=1 ur yrj represents the total virtual output of the DMU j . Analogous restrictions can be obtained for the virtual inputs. Since the implementation of this kind of restriction is not direct, Wong and Beasley suggested many modifications: • To add this restriction only to the DMU being evaluated. Thus, each DMU is analyzed with two additional restrictions. • To add this restriction to all DMUs. Thus, each DMU is analyzed with 2N additional restrictions, where N is the total number of DMUs. This is computationally expensive. • To add this restriction to the proportion of the total virtual output that the “average” DMU gives to output r. Each DMU is then analyzed with two additional restrictions: � ur N j =1 (yrj /N) � ψr , φr � �s �N r=1 ur ( j =1 (yrj /N)) where
�N
j =1
(yrj /N) represents the level of the rth output of the “average” DMU.
We can note that, depending on the orientation of the model, the denominator could be necessary or not. For instance, in the input orientation, since the weighted sum of the inputs is equal to 1, the denominator is unnecessary. This kind of weight restrictions model avoids the necessity of previously running the DEA classic models. In three kinds of weights restrictions analyzed, the resulting efficiency scores, whether these restrictions are applied to the virtual inputs or to the virtual outputs, are sensitive to the model orientation (input or output). 1.2. Preference structure model Based on the Russell measure (Färe and Lovell (1979)) or the non-radial efficiency measure, Zhu [33] presented some models to introduced a preference structure in DEA models, using weights to do so. In this way, the target for inefficient DMUs is based on this preference structure given by the decision-maker. The target obtained is more meaningful than the usual target obtained for classic DEA models as a result of an equi-proportional reduction/increment of inputs/outputs. This model also provides an efficiency score. Zhu proposed three models, one with input orientation, the other with
230
ANGULO-MEZA AND LINS
output orientation and the following model that combines both input and output orientation: maximize subject to
s �
wr+ φr −
r=1 n � j =1 n �
m �
wi− ϕi
i=1
λj yrj − sr+ = φr yrj0 ,
r = 1, . . . , s,
λj xij + si− = ϕi xij0 ,
i = 1, . . . , m,
j =1
ϕi , φr free ∀i, r,
si− , sr+ � 0,
∀i, r, ε > 0,
where s �
wr+
−
r=1
m �
wi− = 1.
i=1
In this model, the reductions in inputs and increments in outputs are considered individual for each variable and a weight for every factor is given such that the sum of weights of the outputs minus the sum of the weights of the inputs is equal to one. This set of weights is called the expert’s preference structure. The resulting value of the objective function is the efficiency score for the DMU being analyzed. We emphasize that ϕi and φr are set free, which indicates that inputs can increase and outputs can decrease. This can be preferable from a managerial point of view, for instance when the target implies redundancy of workers and this cannot be done without impairing the public image. This model can be tested, interactively, trying different weight sets. Although this problem was not addressed to specifically improve the discriminating power of DEA, the inclusion of a preference structure has, as a consequence, a better differentiation among efficient units, once ϕi and φr are set free. The input orientation of this model is formulated by changing the objective function of the above model into the following one: �m wi− ϕi minimize �i=1 m − i=1 wi n � subject to λj yrj − sr+ = yrj0 , r = 1, . . . , s, j =1
n � j =1
λj xij + si− = ϕi xij0 ,
ϕi free ∀i, r,
si− , sr+ � 0,
i = 1, . . . , m, ∀i, r, ε > 0.
A DMU j0 is efficient if the optimal value of the objective function is equal to one and all the sr+∗ are equal to zero. Given that the factor of reduction for each input is
REVIEW OF METHODS
231
free, sometimes ϕi * can be greater than one, depending on the weights applied. Nondiscretionary variables can be treated in this model by setting their weight equal to zero. Output orientation can be likewise formulated. As stated by the author, the preference structure approach provides a way of preventing DMUs from becoming efficient due to unrealistic weightings. Also, further discrimination is obtained, based on the preference structure specified by the decisionmaker, as a result of a non-radial movement toward the efficient frontier. 1.3. Value efficiency analysis This method was developed by Halme et al. [14] as a way of incorporating the decisionmaker’s value judgements and preferences into the analysis, using two stages. The first stage comprises an identification of the decision-maker’s Most Preferred Solution (MPS), a solution that he/she prefers above all the others in the efficient frontier, through a multiple objective model. The second stage consists of the frontier determination based on the MPS chosen. The MPS can be defined as the point where the decision-maker’s value function (unknown) assumes its maximum when the search ends. The foundations of the method arise from the work of Joro et al. [15], where a structural comparison was made between classical DEA models and the Reference Point Approach in Multiple Objective Linear Programming. According to Halme et al. [14], this MPS can be determined using the following multiple objective linear program: � � Y max U λ = λ −X � � subject to λ ∈ $ = λ | λ ∈ �n+ e, Aλ � b . As we can see, there is an objective function that is the linear combination of the variable (input and output) for all DMUS. And the restriction, in practice becomes &λ = 1, with λ > 0 for the DMUs, i.e., a convex envelopment is formed, from which the MPS is chosen. This multiobjective model has no single solution, for it depends on an expert or decision-maker to determine which solution is more appropriate. The purpose is to help the expert to evaluate the value of each vector u = [y −x]T ∈ T , to identify the MPS, that is a (virtual or existing) DMU in the efficient frontier with input/output levels that he/she prefers. We assume that he/she has a pseudo concave, strictly increasing (i.e., strictly increasing in y and strictly decreasing in x) value function v(u), and attains a (local) maximum at v(u∗ ), u∗ = [y ∗ −x ∗ ]T ∈ �m+p with his/her MPS. It is advisable to use an interactive system to help in the selection process. The authors adopted the Pareto Race interface [16], which is implemented in the VIG software, to accomplish this task. The aim of the Value Efficiency Analysis is to evaluate each DMU with respect to an indifference contour that passes through the MPS. Since we do not know the function, we approximate this contour using all possible tangent hyperplanes passing through the MPS. These hyperplanes define a new “efficient frontier”, and the resulting efficiency scores of this new frontier are called “value efficient”.
232
ANGULO-MEZA AND LINS
Once the MPS is chosen, the formulation to determine the value efficiencies for each DMU is: � � max σ + ε 1T s + + 1T s − subject to Y λ − σ w y − s + = g y , Xλ + σ w x + s − = g x , &λ = 1, s + , s − � 0, ε > 0 (non-Archimedian), λj � 0, if λ∗j = 0, j = 1, . . . , n, where the MPS is: y ∗ = Y λ∗ , x ∗ = Xλ∗ . The variables associated with the MPS are free. The result we obtain is that only the λs associated to the DMUs, which compose the MPS, are not equal to zero. Considering the BCC model, w x = g x = x0 and w y = g y = y0 . This model can be modified changing the equivalences for w x , g x , w y and g y , and the restriction &λ = 1 to consider input, output and combined orientation for the CCR model; input, output and combined orientation for the BCC model and a general combined model [18]. Further developments of this approach incorporate weight restrictions [13] and situations where not one but several MPS are desirable to the decision-maker [17]. Also, an application to academic research evaluation was made by Korhonen et al. [19]. Considerations about practical aspects of Value Efficiency Analysis can be found in Korhonen et al. [17]. As stated previously for the other methods that incorporate a priori information, after the inclusion of preference information, a better discrimination among DMUs is obtained, whether this was the main goal or not.
2.
Methods that do not require a priori information
There are disadvantages in the methods that incorporate a priori information, concerning subjectivity: • The value judgements, or a priori information can be wrong or biased, or the ideas may not be consistent with reality. • There may be a lack of consensus among the experts or decision-makers, and this can slow down or adversely affect the study. Indeed, one may want to preserve the DEA spirit in the sense of not including a priori information. The methods we shall now describe were developed to avoid or minimize the intervention of the expert and, at the same time, to increase discrimination in DEA.
REVIEW OF METHODS
233
2.1. Super efficiency The main idea of this method, as introduced by Andersen and Petersen [2], is to compare the DMU being evaluated with a linear combination of other DMUs of the sample while excluding the observations of the DMU being evaluated. This only affects the efficiency scores of the extreme efficient DMUs. In this case, these DMUs can obtain an efficiency score greater than one. This approach provides a ranking of efficient DMUs similar to the ranking of inefficient DMUs. The proposed CRS input oriented model is: � � minimize θ − ε 1T s + + 1T s − n � λk Xk + s − , subject to θXj = Yj =
k=1 k =j n �
λk Y k − s + ,
k=1 k =j + −
λk , s , s � 0, where Xj is an m-dimensional input vector and Yj is an s-dimensional output vector. θ is a scalar, which allows equi-proportional reductions of all inputs. ε is a non-infinitesimal Archimedian and 1T is a T -dimensional vector of 1. The scores of inefficient DMUs remain as they were in the classical CRS model, since exclusion of each of these DMUs does not alter the efficient frontier. This solution has the same interpretation that Farrell measured where the DMU being analyzed can increase its input vector proportionally up to the factor θ and remain efficient, but will be dominated by the combination of DMUs that compose the efficient frontier, if the proportional increase of the input vector exceeds θ. All efficient DMUs are assigned values in an analogous way. The model can be easily adapted for the output orientation and to consider returns to scale. This methodology has the advantage of allowing discrimination among efficient DMUs with the existence of efficiency scores greater than one, and the establishment of a ranking for the units. However, it does not solve the problem of unreal weights. On the other hand, Thrall [30] and Zhu [34] observed unfeasibility in the super efficiency model, Dulá and Hickman [10] pointed out that unfeasibility shows that the DMU is efficient, though not lending itself to ranking, and it is useful in locating endpoint positions of the extreme efficient DMUs. Later, Seiford and Zhu [24] provided necessary and sufficient conditions for unfeasibility of the super-efficiency DEA models and also investigated the unfeasibility when returns to scale occurs. It is worth noting that the super efficiency approach can be used in a sensitivity analysis, a topic that was widely covered by Zhu [34].
234
ANGULO-MEZA AND LINS
2.2. Cross-evaluation Another method to increase discrimination among efficient DMUs is by using crossevaluation, initially developed by Sexton [25]. The main idea is to use DEA in a peerevaluation instead of a self-evaluation which is calculated by the classic DEA models. A peer-evaluation means that each DMU is evaluated according to the optimal weighting scheme of other DMUs. The mean of these efficiencies is the “cross-evaluation”. Then the evaluation will be the mean of the efficiencies of a DMU calculated with the weighting schemes, which we can call the “points of view” of other DMUs. To accomplish this, we use the efficiency scores calculated according to the classic DEA models and the optimal weighting scheme used to obtain such scores. In the DEA models, multiple optimal solutions can exist, and can cause the cross-efficiencies to vary (because one scheme can be favorable to one DMU and not favorable to another, or vice versa). We therefore use a secondary objective function. The idea is to obtain a weighting scheme that would be optimal in the initial model (classic DEA model), but have, as a secondary objective, minimization of the crossefficiencies of the other DMUs. This formulation is called the “aggressive formulation”. On the other hand, the weighting scheme chosen can be directed to maximizing the cross-efficiencies of other DMUs. This formulation is called the “benevolent formulation”. To see how this is done, we define: � uki ysi , (1) Eks = � i j vkj xsj as the cross-efficiency of DMU s using the weighting scheme of DMU k. Thus, Ekk would be the efficiency score for DMU k using its own weighting scheme, i.e., the efficiency score calculated by the CCR model. This efficiency would be called “standard efficiency”. The aggressive formulation for the secondary objective function can have three forms. In the simplest approach, the choice of the weighting scheme that provides the maximum efficiency obtained in the first step (classic model) for a DMU k, would attempt to minimize the mean of the cross-efficiencies of others DMUs: � � � uki ysi �i Eks = . minimize (n − 1)Ak = v x kj sj j s =k s =k This objective function leads us to a fractional non-linear program, which cannot be solved by the traditional methods of linear programming. A substitution was proposed for the previous objective function, which attempts to minimize the sum of the ratios of all other DMUs. This alternative uses the weighted sum of the numerator of each fraction minus the weighted sum of the denominator of the
REVIEW OF METHODS
235
previous objective, where the weighting scheme used to calculate these weighted sums is the scheme of DMU k that we are attempting to find. This gives:
� � � uki ysi − vkj xsj minimize Bk = s =k
=
�
i
uki
�
ysi
j
� �
xsj . − vkj
s =k
i
s =k
j
Doyle and Green [9] suggested another alternative for the objective function Ak similar to the objective function Bk : � � i (uki s =k ysi ) � . minimize Ck = � j (ukj s =k xsj ) We attempt to minimize the weighted sum of the outputs of the composite DMU divided by the weighted sum of the inputs of the composite DMU. This is also a fractional nonlinear program. However, using the standard transformation given in Cooper, Seiford and Tone [8], we can restate this as the following linear program. minimize Bk � subject to vkj xkj = 1,
(2)
j
�
uki yki − Ekk
i
�
vkj xkj = 0,
Eks � 1, ∀s = k, uki , vkj � 0.
(4) (5)
Then, considering equation (1), the formulation with the objective function Bk is:
� � � � ysi − xsj uki vkj minimize Bk = subject to
�
i
s =k
uki yki − Ekk
i
�
s =k
j
vkj xkj = 1,
j
�
uki ysi −
i
(3)
j
� j
uki , vkj � 0, where the decision variables are uki and vki .
�
vkj xkj = 0,
j
vkj xsj � 0,
∀s = k,
236
ANGULO-MEZA AND LINS
For the objective function Ck , then: �
�
minimize Ck = �
�
i (uki
j (vkj
s =k
ysi )
s =k
xsj )
.
Ck must be linearized by setting the denominator equal to 1. So we have: � �
ysi minimize uki i
subject to
s =k
� �
xsj = 1, vkj s =k
j
�
uki yki − Ekk
�
i
(6)
vkj xkj = 0,
(7)
j
Eks � 1, ∀s = k, uki , vkj � 0.
(8) (9)
Then the final model for objective function Ck is: � �
ysi uki minimize i
subject to
� j
�
s =k
vkj
�
xsj
s =k
uki yki − Ekk
i
�
uki ysi −
i
�
= 1, �
vkj xkj = 0,
j
vkj xsj � 0,
∀s = k,
j
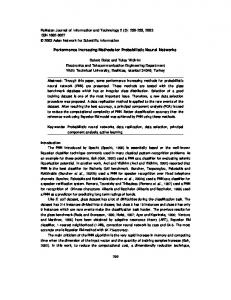
uki , vkj � 0. Later works have found that the objective functions Bk and Ck give very similar results, which is why only one of these objective functions is used, generally Ck . Once the weighting scheme and the cross-efficiencies have been found, we construct a matrix called the “cross-efficiencies matrix”, shown in table 1, where Ekk is the efficiency score calculated by the classic DEA model, Eks is the efficiency score for the DMU s calculated using the weighting scheme obtained for the DMU k, and ek is the mean cross-efficiency of the DMU k. Sometimes this ek is calculated in the following way: 1� Esk = ek , n ∀s
(10)
REVIEW OF METHODS
237
Table 1
1 2 3 4 5 ... n
1
2
3
4
5
...
n
E11 E21 E31 E41 E51 ... En1
E12 E22 E32 E42 E52 ... En2
E13 E23 E33 E43 E53 ... En3
E14 E24 E34 E44 E54 ... En4
E15 E25 E35 E45 E55 ... En5
... ... ... ... ... ... ...
E1n E2n E3n E4n E5n ... Enn
e1
e2
e3
e4
e5
...
en
i.e., the mean of the efficiencies scores of column k of the cross-efficiencies matrix, allowing self-evaluation of DMU k. Sometimes it is calculated without the diagonal of the matrix: 1 � Esk = ek� . (11) n − 1 s =k Besides using this measure as a complement or alternative to the standard efficiency in order to distinguish among efficient DMUs, we can also distinguish DMUs with the greatest difference between the standard efficiency and mean cross-efficiency, which can be done by: Mk =
(Ekk − ek ) , ek
where ek is calculated according to (11). DMUs with greater Mk are called “mavericks” by Doyle and Green. When an efficient DMU in the classic DEA model has a high Mk this is called a “false positive” [28], and shows that this DMU obtains an efficiency score just by using inappropriate weights. This method has the advantage of not requiring a priori information, but it is very complex, because a second model must be solved to calculate the mean crossefficiencies. Besides, any alteration in the set of DMUs, which involves inclusion or exclusion of a DMU, can alter the final cross-efficiency, since it is a mean. This is why this method is only appropriate for cases where changes in the set of DMUs are unlikely. On the other hand, it could happen that not all the possible combinations of weighting schemes would be studied. This happens when most of the possible weighting schemes just explore a few variables and do not consider the others. Depending on the quantity of variables, this task could be very complicated. Anderson et al. [3] applied this approach in an study of efficiency measurement of alternate machine component grouping solutions, in an attempt to increase discrimination among efficient DMUs. Also, Green et al. [12] used cross-evaluation to rank the candidates in a preferential election.
238
ANGULO-MEZA AND LINS
2.3. A multiple objective approach The researchers Xiao-Bai Li and Gary R. Reeves [21] presented a multiple objective approach that they called Multiple Criteria Data Envelopment Analysis – MCDEA, which focuses on solving two key problems presented in section 1: lack of discrimination and inappropriate weighting schemes. As mentioned, the first problem happens when the number of DMUs is smaller in comparison with the total number of inputs and outputs, causing classic models to identify too many DMUs as efficient. The second problem happens when an efficient DMU picks out a few large weights attached to some variables, and very small weights (nearly zero) to the remaining variables, thus giving rise to unrealistic weighting schemes. These two problems are related and frequently occur simultaneously. The excessive number of variables in comparison to the total of DMUs, considering multipliers DEA problem, allows each DMU to select a few variables to attach weights, and does not consider all the others, in order to achieve efficiency. Regarding the two problems mentioned, the authors included other relative efficiency measures. Two other objective functions are included in the classical DEA model. Thus, DMUs are evaluated in the Multiobjective Linear Programming context. Let us begin by considering the classic DEA CCR model to evaluate the efficiency of DMU0 : max h0 = subject to
s �
ur yrj0
r=1 m � i=1 s �
vi xij0 = 1, ur yrj −
r=1
ur , vi � 0,
m �
vi xij � 0,
j = 1, . . . , n,
i=1
∀r, i.
DMU0 is efficient if and only if h0 = 1. Defining the variable d0 = 1 − h0 as the deviation variable for the DMU0 , we can rewrite the objective function as: min d0 , which is equivalent to the objective function of the CCR model, dj being the deviation variable for the j th DMU. In this model, the DMU0 is efficient if and only if d0 = 0, which means h0 = 1. If the DMU0 is not efficient its efficiency score would be h0 = 1 − d0 . Thus, we can say that the classic DEA model minimizes the inefficiency of a DMU, measured by d0 , such that the weighted sum of outputs is less than or equal to the weighted sum of the inputs for each DMU. Taking advantage of other efficiency measures (mentioned in [25,27]), Li and Reeves introduce two other objective functions. The second objective function seeks minimization of the maximum deviation, for which the restriction included in the new formulation, M − dj � 0 (j = 1, . . . , n), makes M the maximum deviation. The
REVIEW OF METHODS
239
third objective function aims at the maximization of the deviation of all DMUs. All three objective functions are based on the deviation variable. The resulting problem is:
s � ur yrj0 min d0 or max h0 = r=1
min M n � min dj j =1
subject to
m � i=1 s � r=1
vi xij0 = 1, ur yrj −
m �
vi xij + dj = 0,
j = 1, . . . , n,
i=1
M − dj � 0, ur , vi � 0,
j = 1, . . . , n, ∀r, i, j.
Efficiency score for the DMU0 is 1 − d0 , whatever objective function we focus on. Using this model, we can find a set of non-dominated# solutions (also called efficient solutions) in opposition to the linear programming models in which there is an optimal solution, like in classic DEA CRS models. In this set of efficient solutions to the above model, we can find solutions that optimize each individual objective. For instance, observing the first objective function in the above model, we find that it results in the same optimal solution as the classic DEA model. The second objective function displays DMU0 as mini-max efficient, if the value of d0 corresponding to the solution that minimizes this function is zero. This only happens if all DMUs lie on the same efficient hyperplane, which is not a realistic situation. The same is true when we attempt to get a mini-sum efficient DMU, requiring every DMU j to have a null dj . In practice, attaching some importance to these latter two objective functions prevents DMU0 from being efficient, choosing its best unrealistic mix of weights. Therefore, the inclusion of the two additional objective functions does improve discrimination in DEA. Applications made by the authors showed that, in fact, the utilization of this multiple objective linear program presents advantages in improving discrimination over cross-evaluation and weight restrictions. Concerning the computational issues, despite the complexity of multiple objective problems, this model presents advantages over the use of problems with a single objective. First, it avoids the problem of multiple optimal solutions, which appears when solving the classic DEA models for extreme efficient DMUs. The total number of non-dominated solutions associated to a DMU generally reflects the stability of the efficiency scores of the DMU relative to changes in the efficiency criteria, that is, the greater the quantity of solutions, the more sensitive the efficiency scores of a DMU are to changes in the criteria.
240
ANGULO-MEZA AND LINS
In the work performed by Li and Reeves, the software ADBASE by Steuer [26] was used as a solution method, which provides the extreme points of the non-dominated set of solutions. Also, an interactive approach can be used in which the user intervention in the final choice of the solution can be of great help in the determination of the final solution. In conclusion, we need to mention that this method is considered within the group that does not require a priori information but the selection of one solution among the set can be seen as a way of including preferences. This is unlike the approach of Value Efficiency Analysis, where an MPS must first be chosen to determine the efficient frontier and reach the final solution. 3.
Conclusions
We presented a collection of methods that, as a purpose or a consequence, increase discrimination in Data Envelopment Analysis. The methods were classified into two groups, the first requiring a priori information to refine the analysis, the second not requiring this information. In the development of this work we can verify that only the methods from the second group were formulated specifically to improve discrimination among DMUs. They aimed to refine the analysis with the inclusion of value judgments, like the weight restrictions and Value Efficiency Analysis, or to find alternative targets based on the decision-maker’s preference structure like in the Zhu models, obtaining a non-radial efficiency score. Super efficiency was originally formulated to rank efficient DMUs to complement the rank of inefficient DMUs. Cross-evaluation uses a peer evaluation to determine an efficiency score, as an average of the efficiencies determined by all the other DMUs of the analysis. This besides increasing discrimination, provides an interesting meaning, considering a negotiation meeting among business partners in order to select criteria in a decision-making process. Each agent makes a strictly rational assessment of the other points of view, based on his own weights draw from a cross-evaluations DEA problem. Comparing optimal mixes, one can anticipate agreements or heated arguments. This, as well as the last approach, the multi-objective one, illustrates how distinctively each of the methodologies presented regards the discrimination issue. Without exhausting the plentiful diversity of DEA branches of research in existence nowadays, which impact discrimination, we established discrimination as a framework for analyzing the suitability of different methods. As a matter of fact, future directions should explore the complementariness of methods and appropriateness to the real cases as a way of overcoming DEA weaknesses. References [1] R. Allen, A. Athanassopoulos, R.G. Dyson and E. Thanassoulis, Weights restrictions and value judgements in data envelopment analysis: evolution, development and future directions, Annals of Operations Research 73 (1997) 13–34.
REVIEW OF METHODS
241
[2] P. Andersen and N.C. Petersen, A procedure for ranking efficient units in data envelopment analysis, Management Science 39 (1993) 1261–1264. [3] T.R. Anderson, A. Uslu and K.B. Holingsworth, Revisiting extensions in efficiency measurement of alternate machine component grouping solutions via data envelopment analysis, Working paper (1998). [4] J.E. Beasley, Comparing university departments, Omega International Journal of Management Science 18 (1990) 171–183. [5] A. Charnes, W.W. Cooper and E. Rhodes, Measuring the efficiency of decision-making units, European Journal of Operational Research 2 (1978) 429–444. [6] A. Charnes, W.W. Cooper, Z.M. Huang and D.B. Sun, Polyhedral cone-ratio DEA models with an illustrative application to large commercial banks, Journal of Econometrics 46 (1990) 73–91. [7] A. Charnes, W.W. Cooper, Q.L. Wei and Z.M. Huang, Cone ratio data envelopment analysis and multiple objective linear programming, International Journal of Management Science 20 (1989) 1099– 1118. [8] W.W. Cooper, L.M. Seiford and K. Tone, Data Envelopment Analysis, A Comprehensive Text with Models, Applications, References and DEA-Solver Software (Kluwer, Boston, 2000). [9] J.R. Doyle and R.H. Green, Efficiency and cross-efficiency in DEA: derivations, meanings and uses, Journal of the Operational Research Society 45 (1994) 567–578. [10] J.H. Dulá and B.L. Hickman, Effects of excluding the column being scored from the DEA envelopment LP technology matrix, Journal of the Operational Research Society 48 (1997) 1001–1012. [11] R.G. Dyson and E. Thanassoulis, Reducing weight flexibility in data envelopment analysis, Journal of the Operational Research Society 39 (1988) 563–576. [12] R. Green, J.R. Doyle and W.D. Cook, Preference voting and project ranking using DEA and crossevaluation, European Journal of the Operational Research 90 (1996) 461–472. [13] M. Halme and P. Korhonen, Restricting weights in value efficiency analysis, European Journal of Operational Research 126 (2000) 175–188. [14] M. Halme, T. Joro, P. Korhonen, S. Salo and J. Wallenius, Value efficiency analysis for incorporating preference information in DEA, Management Science 45 (2000) 103–115. [15] T. Joro, P. Korhonen and J. Wallenius, Structural comparison of data envelopment analysis and multiple objective linear programming, Management Science 44 (1998) 962–970. [16] P. Korhonen and J. Wallenius, A Pareto race, Naval Research Logistics 35 (1988) 615–623. [17] P. Korhonen, A. Siljamäki and M. Soismaa, Practical aspects of value efficiency analysis, IIASA Interim report IR-98-042, IIASA, Finland (1998). [18] P. Korhonen, A. Siljamäki and M. Soismaa, On the use of value efficiency analysis and some further developments, Journal of Productivity Analysis 17 (2002) 49–64. [19] P. Korhonen, R. Tainio and J. Wallenius, Value efficiency analysis of academic research, European Journal of Operational Research 130 (2001) 121–132. [20] J.S.M. Kornbluth, Analysing policy effectiveness using cone restricted DEA, Journal of the Operational Research Society 42 (1991) 1097–1104. [21] X.B. Li and G.R. Reeves, A multiple criteria approach to data envelopment analysis, European Journal of Operational Research 115 (1999) 507–517. [22] R. Pedraja-Chaparro, J. Salinas-Jimenes, J. and P. Smith, On the role of weight restrictions in DEA, Journal of Productivity Analysis 8 (1997) 215–230. [23] Y. Roll, W. Cook and B. Golany, Controlling factor weights in DEA, IIE Transactions 23 (1991) 2–9. [24] L.M. Seiford and J. Zhu, Infeasibility of super efficiency data envelopment analysis models, Information Systems and Operational Research 27 (1999) 174–187. [25] T.R. Sexton, Measuring Efficiency: An Assessment of Data Envelopment Analysis, ed. R.H. Silkman (Jossey–Bass, San Francisco, 1986). [26] R.E. Steuer, An interactive multiple objective linear programming procedure, TIMS Studies in the Management Sciences 6 (1977) 225–239.
242
ANGULO-MEZA AND LINS
[27] T.J. Stewart, Relationships between DEA e multicriteria decision analysis, Journal of the Operational Research Society 47 (1996) 654–665. [28] S. Talluri and J. Sarkis, Extensions in efficiency measurement of alternate machine component grouping solutions via data envelopment analysis, IEEE Transactions on Engineering Management 44 (1997) 27–31. [29] R.G. Thompson, F.D. Jr. Singleton, R.M. Thrall and B.A. Smith, Comparative site evaluations for locating a high-energy physics lab in Texas, Interfaces 16 (1986) 35–49. [30] R.M. Thrall, Duality, classification and slacks in DEA, The Annals of Operations Research 66 (1996) 109–138. [31] Y.-H. Wong and J.E. Beasley, Restricting weight flexibility in DEA, Journal of the Operational Research Society 41 (1990) 829–835. [32] J. Zhu, Robustness of the efficient DMUs in data envelopment analysis, European Journal of Operational Research 90 (1996) 451–460. [33] J. Zhu, Data envelopment analysis with preference structure, Journal of the Operational Research Society 47 (1996) 136–150. [34] J. Zhu, Super-efficiency and DEA sensitivity analysis, European Journal of Operational Research 129 (2001) 443–455.