entific applications, enterprise domains for hosting e- commerce applications ..... ARINC-653 Emulation Library is also responsible for providing temporal ...
Institute for Software Integrated Systems Vanderbilt University Nashville, Tennessee, 37203
RFDMon: A Real-Time and Fault-Tolerant Distributed System Monitoring Approach Rajat Mehrotra Abhishek Dubey Electrical and Computer Engineering Institute for Software Integrated Systems Mississippi State University, Mississippi State, MS Vanderbilt University, Nashville, TN Jim Kwalkowski, Marc Paterno, Amitoj Singh, Randolph Herber Fermi National Laboratory, Batavia, IL Sherif Abdelwahed Electrical and Computer Engineering Mississippi State University, Mississippi State, MS
TECHNICAL REPORT ISIS-11-107 October, 2011
Abstract In this paper, a systematic distributed event based (DEB) system monitoring approach “RFDMon” is presented for measuring system variables (CPU utilization, memory utilization, disk utilization, network utilization), system health (temperature and voltage of Motherboard and CPU) application performance variables (application response time, queue size, throughput), and scientific application data structures (e.g. PBS information, MPI variables) accurately with minimum latency at a specified rate and with minimal resource utilization. Additionally, “RFDMon” is fault tolerant (for fault in sensor framework), self-configuring (can start and stop monitoring the nodes, configure monitors for threshold values/changes for publishing the measurements), self-aware (aware of execution of framework on multiple nodes through HEARTBEAT), extensive (monitors multiple parameters through periodic and aperiodic sensors), resource constrained (resources can be limited for monitors), and scalable for adding extra monitors on the fly. Because this framework is built on Object Management Group (http://www.omg.org/) Data Distribution Services (DDS) implementations, it can be used for deploying in systems with heterogeneous nodes. Additionally, it provides a functionality to limit the maximum cap on resources consumed by monitoring processes such that it does not affect the availability of resources for the applications.
2
RFDMon: A Real-Time and Fault-Tolerant Distributed System Monitoring Approach December 6, 2011
Abstract
ture contains multiple autonomous computing nodes that are deployed over a network and connected through a distributed middle-ware layer to exchange the information and control commands [1]. This distributed middleware spans across multiple machines and provides same interface to all the applications executing on multiple computing nodes. The primary benefit of executing an application over a distributed infrastructure is that different instances of the application (or different applications) can communicate with each other over the network efficiently while keeping the details of underlying hardware and operating system hidden from the application behaviour code. Also, interaction in distributed infrastructure is consistent irrespective of location and time. Distributed infrastructure is easy to expand, enables resource sharing among computing nodes, and provides flexibility of running redundant nodes to improve the availability of infrastructure.
In this paper, a systematic distributed event based (DEB) system monitoring approach “RFDMon” is presented for measuring system variables (CPU utilization, memory utilization, disk utilization, network utilization, etc.), system health (temperature and voltage of Motherboard and CPU) application performance variables (application response time, queue size, throughput), and scientific application data structures (e.g. PBS information, MPI variables) accurately with minimum latency at a specified rate and with minimal resource utilization. Additionally, “RFDMon” is fault tolerant (for fault in monitoring framework), self-configuring (can start and stop monitoring the nodes and configure monitors for threshold values/changes for publishing the measurements), selfaware (aware of execution of the framework on multiple nodes through HEARTBEAT message exchange), extensive (monitors multiple parameters through periodic and aperiodic sensors), resource constrainable (computational resources can be limited for monitors), and expandable for adding extra monitors on the fly. Because this framework is built on Object Management Group (http://www.omg.org/) Data Distribution Services (DDS) implementations, it can be used for deploying in systems with heterogeneous nodes. Additionally, it provides a functionality to limit the maximum cap on resources consumed by monitoring processes such that it does not affect the availability of resources for the applications.
1
Using distributed infrastructure creates added responsibility of consistency, synchronization, and security over multiple nodes. Furthermore, in enterprise domain (or cloud services), there is a tremendous pressure to achieve the system QoS objectives in all possible scenarios of system operation. To this end, an aggregate picture of the distributed infrastructure should always be available to analyze and to provide feedback for computing control commands if needed. The desired aggregate picture can be achieved through an infrastructure monitoring technique that is extensive enough to accommodate system parameters (CPU utilization, memory utilization, disk utilization, network utilization, etc.), application performance parameters (response time, queue size, and throughput), and scientific application data structures (e.g. Portable Batch System (PBS) information, Message Passing Interface (MPI) variables). Additionally, this monitoring technique should also be customizable to tune for various type of applications and their wide range of parameters. Effective management of distributed systems require an effective monitoring technique, which
Introduction
Currently distributed systems are used in executing scientific applications, enterprise domains for hosting ecommerce applications, wireless networks, and storage solutions. Furthermore, distributed computing systems are an essential part of mission critical infrastructure of flight control system, health care infrastructure, and industrial control system. A typical distributed infrastruc3
tem that reports all the measurements in a centralized database over http interface. 2. A Ruby on Rails [4] based web service that shows the current state of the infrastructure by providing an interface to read the database and display the content of database in a graphical window on the web browser. Outline: This paper is organized as follows. Preliminary concepts of the proposed approach are presented in section 2 and issues in monitoring of distributed systems is highlighted in section 3. Related distributed monitoring products are described in section 4, while detailed description of the proposed approach “RFDMon” is given in section 5. Details of each sensor is presented in section 6 while a set of experiments are described in section 7. Application of the proposed approach is mentioned in section 9 and major benefits of the approach is highlighted in section 8. Future direction of the work is discussed in Contribution: In this paper, an event based dis- section 10 and conclusions are presented in section 11. tributed monitoring approach “RFDMon” is presented that utilizes the concepts of distributed data services 2 Preliminaries (DDS) for an effective exchange of monitoring measurements among the computing nodes. This monitoring The proposed monitoring approach “RFDMon” consists framework is built upon the ACM: ARINC-653 Comof two major modules: Distributed Sensors Frameponent Framework [2] and an open source DDS implework and Infrastructure Monitoring Database. Dismentation, Open splice [3]. The primary principles in tributed Sensors Framework utilizes Data distribution design of the proposed approach are static memory alservices (DDS) middleware standard for communication location for determinism, spatial and temporal isolation among nodes of distributed infrastructure. Specifically, it between monitoring framework and real application of uses the Opensplice Community Edition [3]. It executes different criticality, specification, and adherence to real DDS sensor framework on top of ARINC Component time properties such as periodicity and deadlines in monFramework [5]. Infrastructure Monitoring Database itoring framework, and providing well-defined composiuses Ruby on Rails [4] to implement the web service that tional semantics. can be used to update the database with monitoring data, “RFDMon” is fault tolerant (for fault in sensor frame- and display the data on administrator web browser. In work), self-configuring (can start and stop monitoring the this section, the primary concepts of publish-subscribe nodes, configure monitors for threshold values/changes mechanism, OpenSplice DDS, ARINC-653, and Ruby for publishing the measurements), self-aware (aware of on Rails are presented, which will be helpful in underexecution of the framework on multiple nodes through standing the proposed monitoring framework. HEARTBEAT messages exchange), extensive (monitors multiple parameters through periodic and aperiodic sensors), resource constrained (resources can be limited for 2.1 Publish-Subscribe Mechanism monitors), expandable for adding extra monitors on the Publish-Subscribe is a typical communication model for fly, and can be applied on heterogeneous infrastructure. distributed infrastructure that hosts distributed applica“RFDMon” has been developed on the existing OMG tions. Various nodes can communicate with each other CCM standard because it is one of the widely used com- by sending (publishing) data and receiving (subscribing) ponent model and software developers are already famil- data anonymously through the communication channel iar with it. as specified in the infrastructure. A publisher or sub-
can work in a distributed manner similar to the underlying system, and reports each event to the system administrator with maximum accuracy and minimum latency. Furthermore, the monitoring technique should not be a burden to the performance of the computing system and should not affect the execution of the applications of the computing system. Also, the monitoring technique should be able to identify the fault in itself to isolate the faulty component and correct it immediately for effective monitoring of the computing system. Distributed event based systems (DEBS) are recommended for monitoring and management of distributed computing systems for faults and system health notifications through system alarms. Moreover, the DEBS based monitoring is able to provide the notion of system health in terms of fault/status signals, which will help to take the appropriate control actions to maintain the system in safe boundary of operation.
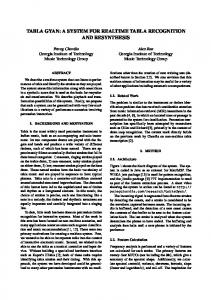
“RFDMon” is divided in two parts: 1. A distributed scriber need only the name and definition of the data in sensor framework to monitor the various system, appli- order to communicate. Publishers do not need any inforcation, and performance parameter of computing sys- mation about the location or identity of the subscribers, 4
Figure 1: Publish Subscribe Architecture and vice versa. Publishers are responsible for collecting the data from the application, formatting it as per the data definition, and sending it out of the node to all registered subscribers over the publish-subscribe domain. Similarly, subscribers are responsible for receiving the data from the the publish-subscribe domain, format it as per the data definition, and presenting the formatted data to the intended applications (see Figure 1). All communication is performed through DDS domain. A domain can have multiple partitions. Each partition can contain multiple topics. Topics are published and subscribed across the partitions. Partitioning is used to group similar type of topics together. It also provides flexibility to application for receiving data from a set of data sources [6]. Publish subscribe mechanism overcomes the typical short comings of client-server model, where client and servers are coupled together for exchange of messages. In case of client-server model, a client should have information regarding the location of the server for exchange of messages. However, in case of publish-subscribe mechanism, clients should know only about the type of data and its definition.
2.2
Figure 2: Data Distribution Services (DDS) Architecture
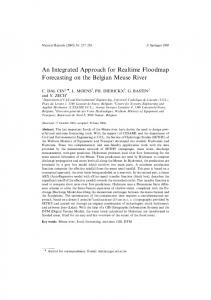
rameters include rate of publication, rate of subscription, data validity period, etc. DCPS provides flexibility to the developers for defining the different QoS requirements for the data to take control of each message, and they can concentrate only on the handling of data instead of on the transfer of data. Publisher and subscribers use DDS framework to send and receive the data respectively. DDS can be combined with any communication interface for communication among distributed nodes of application. DDS framework handles all of the communications among publishers and subscribers as per the QoS specifications. In DDS framework, each message is associated with a special data type called topic. A subscriber registers to one or more topics of its interest. DDS guarantees that the subscriber will receive messages only from the topics that it subscribed to. In DDS, a host is allowed to act as a publisher for some topics and simultaneously act as subscriber for others (see Figure 3).
Open Splice DDS Benefits of DDS
OpenSplice DDS [3] is an open source community edition version of the Data Distribution Service (DDS) specification defined by Object Management Group (http://www.omg.org/). These specifications are primarily used for communication needs of distributed Real Time Systems. Distributed applications use DDS as an interface for “Data-Centric Publish-Subscribe” (DCPS) communication mechanism ( see Figure 2). “DataCentric” communication provides flexibility to specify QoS parameters for the data depending upon the type, availability, and criticality of the data. These QoS pa-
The primary benefit of using DDS framework for our proposed monitoring framework “RFDMon” is that DDS is based upon publish-subscribe mechanism that decouples the sender and receiver of the data. There is no single point of bottleneck or of failure in communication. Additionally, DDS communication mechanism is highly scalable for number of nodes and supports autodiscovery of the nodes. DDS ensures data delivery with minimum overhead and efficient bandwidth utilization. 5
memory protection by allowing a process to access only part of the memory that belongs to the partition, which hosts the same process. Temporal partitioning [7] in Arinc-653 systems is ensured by a fixed periodic schedule to use the processing resources by different partitions. This fixed periodic schedule is generated or supplied to RTOS in advance for sharing of resources among the partitions (see Figure 5). This deterministic scheduling scheme ensures that each partition gains access to the computational resources within its execution interval as per the scheduling scheme. Additionally, it guarantees that the partition’s execution will be interrupted once partition’s execution interval will be finished, the partition will be placed into a dormant state, and next partition as per the scheduling scheme will be allowed to access the computing resources. In this procedure, all shared hardware resources are managed by the partitioning OS to guarantee that the resources are freed as soon as the time slice for the partition expires. Arinc-653 architecture ensures fault-containment through functional separation among applications and monitoring components. In this architecture, partitions and their process can only be created during system initialization. Dynamic creation of the processes is not supported while system is executing. Additionally, users can configure real time properties (priority, periodicity, duration, soft/hard deadline, etc.) of the processes and partitions during their creation. These partitions and process are scheduled and strictly monitored for possible deadline violations. Processes of same partition share data and communicate using intra-partition services. Intra partition communication is performed using buffers to provide a message passing queue and blackboards to read, write, and clear single data storage. Two different partitions communicate using inter-partition services that uses ports and channels for sampling and queueing of messages. Synchronization of processes related to same partition is performed through semaphores and events [7].
Figure 3: Data Distribution Services (DDS) Entities
Figure 4: ARINC-653 Architecture.
2.3
ARINC-653
ARINC-653 software specification has been utilized in safety-critical real time operating systems (RTOS) that are used in avionics systems and recommended for space missions. ARINC-653 specifications presents standard Application Executive (APEX) kernel and its associated services to ensure spatial and temporal separation among various applications and monitoring components in integrated modular avionics. ARINC-653 systems (see Figure 4) group multiple processes into spatially and temporally separated partitions. Multiple (or one) partitions are grouped to form a module (i.e. a processor), while one or more modules form a system. These partitions are allocated predetermined chunk of memory. Spatial partitioning [7] ensures exclusive use of a memory region by an ARINC partition. It guarantees that a faulty process in a partition cannot corrupt or destroy the data structures of other processes that are executing in other partitions. This space partitioning is useful to separate the low-criticality vehicle management components from safety-critical flight control components in avionics systems [2]. Memory management hardware ensures
2.4
ARINC-653 Emulation Library
ARINC-653 Emulation Library [2] (available for download from https://wiki.isis.vanderbilt. edu/mbshm/index.php/Main_Page) provides a LINUX based implementation of ARINC-653 interface specifications for intra-partition process communication that includes Blackboards and Buffers. Buffers provide a queue for passing messages and Blackboards enable pro6
Figure 6: Rails and Model View Controller (MVC) Architecture Interaction The module manager is responsible for checking that the Figure 5: Specification of Partition Scheduling in ACM schedule is valid before the system can be initialized i.e. Framework. all scheduling windows within a hyperperiod can be executed without overlap. cesses to read, write, and clear single message. Intrapartition process synchronization is supported through 2.5 Ruby on Rails Semaphores and Events. This library also provides process and time management services as described in the Rails [4] is a web application development framework ARINC-653 specification. that uses Ruby programming language [8]. Rails uses ARINC-653 Emulation Library is also responsible for Model View Controller (MVC) architecture for applicaproviding temporal partitioning among partitions, which tion development. MVC divides the responsibility of are implemented as Linux Processes. Each partition in- managing the web application development in three comside a module is configured with an associated period that ponents:1.Model: It contains the data definition and maidentifies the rate of execution. The partition properties nipulation rules for the data. Model maintains the state of also include the time duration of execution. The module the application by storing data in the database. 2.Views: manager is configured with a fixed cyclic schedule with View contains the presentation rules for the data and hanpre-determined hyperperiod (see Figure 5). dles visualization requests made by the application as per In order to provide periodic time slices for all parti- the data present in model. View never handles the data tions, the time of the CPU allocated to a module is di- but interacts with users for various ways of inputting the vided into periodically repeating time slices called hy- data. 3.Controller: Controller contains rules for properperiods. The hyperperiod value is calculated as the cessing the user input, testing, updating, and maintaining least common multiple of the periods of all partition in the data. A user can change the data by using controller the module. In other words, every partition executes one while views will update the visualization of the data to or more times within a hyperperiod. The temporal inter- reflect the changes. Figure 6 presents the sequence of val associated with a hyperperiod is also known as the events while accessing a rails application over web inmajor frame. This major frame is then subdivided into terface. In a rails application, incoming client request is several smaller time windows called minor frames. Each first sent to a router that finds the location of the appliminor frame belongs exclusively to one of the partitions. cation and parses the request to find the corresponding The length of the minor frame is the same as the dura- controller (method inside the controller) that will handle tion of the partition running in that frame. Note that the the incoming request. The method inside the controller module manager allows execution of one and only one can look into the data of request, can interact with the partition inside a given minor frame. model if needed, can invoke other methods as per the naThe module configuration specifies the hyperperiod ture of the request. Finally, the method sends information value, the partition names, the partition executables, and to the view that renders the browser of the client with the their scheduling windows, which is specified with the result. In the proposed monitoring framework “RFDMon”, a offset from the start of the hyperperiod and duration. 7
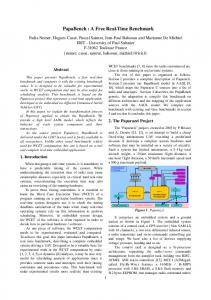
web service is developed to display the monitoring data collected from the distributed infrastructure. These monitoring data includes the information related to clusters, nodes in a cluster, node states, measurements from various sensors on each node, MPI and PBS related data for scientific applications, web application performance, and process accounting. Schema information of the database is shown in figure 7.
nodes through HEARTBEAT sensors. In future, “RFDMon” can be combined easily with a fault diagnosis module due to its standard interfaces. In next section, a few of the latest approaches of distributed system monitoring (enterprise and open source) are presented with their primary features and limitations.
3
Various distributed monitoring systems are developed by industry and research groups in past many years. Ganglia [12], Nagios [13], Zenoss [14], Nimsoft [15], Zabbix [16], and openNMS [17] are a few of them which are the most popular enteprise products developed for an efficient and effective monitoring of the distributed systems. Description of a few of these products is given in following paragraphs. According to [12], Ganglia is a distributed monitoring product for distributed computing systems, which is easily scalable with the size of the cluster or the grid. Ganglia is developed upon the concept of hierarchical federation of clusters. In this architecture, multiple nodes are grouped as a cluster which is attached to a module, and then multiple clusters are again grouped under a monitoring module. Ganglia utilizes a multi-cast based listen/announce protocol for communication among the various nodes and monitoring modules. It uses heartbeat message (over multi-cast addresses) within the hierarchy to maintain the existence (Membership) of lower level modules by the higher level. Various nodes and applications multi-cast their monitored resources or metrics to all of the other nodes. In this way, each node has an approximate picture of the complete cluster at all instances of time. Aggregation of the lower level modules is done through polling of the child nodes in the tree. Approximate picture of the lover level is transferred to the higher level in the form of monitoring data through TCP connections. There are two demons that function to implement Ganglia monitoring system. The Ganglia monitoring daemon (“gmond”) runs on each node in the cluster to report the readings from the cluster and respond to the requests sent from ganglia client. The Ganglia Meta Daemon (“gmetad”) executes at one level higher than the local nodes which aggregates the state of the cluster. Finally, multiple gmetad cooperates to create the aggregate picture of federation of clusters. The primary advantage of utilizing the Ganglia monitoring system is autodiscovery of the added nodes, each node contains the aggregate picture of the cluster, utilizes design principles, easily portable, and easily manageable.
4
Issues in Distributed System Monitoring
An efficient and accurate monitoring technique is the most basic requirement for tracking the behaviour of a computing system to achieve the pre-specified QoS objectives. This efficient and accurate monitoring should be performed in an on-line manner where an extensive list of parameters are monitored and measurements are utilized by on-line control methods to tune the system configuration which in turn keeps the system within desired QoS objectives [9]. When a monitoring technique is applied to a distributed infrastructure, it requires synchronization among the nodes, high scalability, and measurement correlation across the multiple nodes to understand the current behavior of distributed system accurately and within the time constraints. However, a typical distributed monitoring technique suffers from synchronization issues among the nodes, communication delay, large amount of measurements, non deterministic nature of events, asynchronous nature of measurements, and limited network bandwidth [10]. Additionally, this monitoring technique suffers from high resource consumption by monitoring units and multiple source and destination for measurements. Another set of issues related to distributed monitoring include the understanding of the observations that are not directly related with the behavior of the system and measurements that need particular order in reporting [11]. Due to all of these issues, it is extremely difficult to create a consistent global view of the infrastructure. Furthermore, it is expected that the monitoring technique will not introduce any fault, instability, and illegal behavior in the system under observation due to its implementation and will not interfere with the applications executing in the system. For this reason “RFDMon” is designed in such a manner that it can self-configure (START, STOP, and POLL) monitoring sensors in case of faulty (or seems to be faulty) measurements and selfaware about execution of the framework over multiple 8
Related Work
Figure 7: Schema of Monitoring Database (PK = Primary Key , FK = Foreign key). A plug-in based distributed monitoring approach “Nagios” is described in [13]. “Nagios” is developed based upon agent/server architecture, where agents can report the abnormal events from the computing nodes to the server node (administrators) through email, SMS, or instant messages. Current monitoring information and log history can be accessed by the administrator through a web interface. “Nagios” monitoring system consists of following three primary modules - Scheduler: This is the administrator component of the “Nagios” that checks the plug-ins and take corrective actions if needed. Plugin: These small modules are placed on the computing node, configured to monitor a resource, and then send the reading to the “Nagios” server module over SNMP interface. GUI: This is a web based interface that presents the situation of distributed monitoring system through various colourful buttons, sounds, and graphs. The events reported from the plug-in will be displayed on the GUI as per the critically level. Zenoss [14] is a model-based monitoring solution
for distributed infrastructure that has comprehensive and flexible approach of monitoring as per the requirement of enterprise. It is an agentless monitoring approach where the central monitoring server gathers data from each node over SNMP interface through ssh commands. In Zenoss, the computing nodes can be discovered automatically, and can be specified with their type (Xen, VMWare) for customized monitoring interface. Monitoring capability of Zenoss can be extended by adding small monitoring plug-ins (zenpack) to the central server. For similar type of devices, it uses similar monitoring scheme that gives ease in configuration to the end user. Additionally, classification of the devices applies monitoring behaviours (monitoring templates) to ensure appropriate and complete monitoring, alerting and reporting using defined performance templates, thresholds, and event rules. Furthermore, it provides an extremely rich GUI interface for monitoring the servers placed in different geographical locations for a detailed geographical view of the infrastructure. 9
Nimsoft Monitoring Solution [15](NMS) offers a light-weight, reliable, and extensive distributed monitoring technique that allows organizations to monitor their physical servers, applications, databases, public or private clouds, and networking services. NMS uses a message BUS for exchange of messages among the applications. Applications residing in the entire infrastructure publish the data over the message BUS and subscriber applications of those messages will automatically receive the data. These applications (or components) are configured with the help of a software component (called HUB) and are attached to message BUS. Monitoring action is performed by small probes and the measurements are published to the message BUS by robots. Robots are software components that are deployed over each managed device. NMS also provides an Alarm Server for alarm monitoring and a rich GUI portal to visualize the comprehensive view of the system.
ing measurements. In “RFDMon”, all monitoring sensors execute on the ARINC-653 Emulator [2]. This enables the monitoring agents to be organized into one or more partitions and each partition has a period and duration. These attributes govern the periodicity with which the partition is given access to the CPU. The processes executing under each partition can be configured for realtime properties (priority, periodicity, duration, soft/hard deadline, etc.). The details of the approach are described in later sections of the paper.
5
Architecture of the framework
As described in previous sections, the proposed monitoring framework is based upon data centric publish subscribe communication mechanism. Modules (or processes) in the framework are separated from each other through concept of spatial and temporal locality as deThese distributed monitoring approaches are signif- scribed in section 2.3. The proposed framework has icantly scalable in number of nodes, responsive to following key concepts and components to perform the changes at the computational nodes, and comprehensive monitoring. in number of parameters. However, these approaches do not support capping of the resource consumed by the 5.1 Sensors monitoring framework, fault containment in monitoring unit, and expandability of the monitoring approach for Sensors are the primary component of the framework. new parameters in the already executing framework. In These are lightweight processes that monitor a device on addition to this, these monitoring approaches are stand- the computing nodes and read it periodically or aperialone and are not easily extendible to associate with other odically to get the measurements. These sensors pubmodules that can perform fault diagnosis for the infras- lish the measurements under a topic (described in next tructure at different granularity (application level, system subsection) to DDS domain. There are various types of level, and monitoring level). Furthermore, these moni- sensors in the framework: System Resource Utilization toring approaches works in a server/client or host/agent Monitoring Sensors, Hardware Health Monitoring Senmanner (except NMS) that requires direct coupling of sors, Scientific Application Health Monitoring Sensors, two entities, where one entity has to be aware about the and Web Application performance Monitoring Sensors. Details regarding individual sensors are provided in seclocation and identity of other entity. Timing jitter is one of the major difficulties for ac- tion 6. curate monitoring of a computing system for periodic tasks when the computing system is too busy in running other applications instead of the monitoring sensors. [18] presents a feedback based approach for compensating timing jitter without any change in operating system kernel. This approach has low overhead with platform independent nature and maintains total bounded jitter for the running scheduler or monitor. Our current work uses this approach to reduce the distributed jitter of sensors across all machines.
5.2
Topics
Topics are the primary unit of information exchange in DDS domain. Details about the type of topic (structure definition) and key values (keylist) to identify the different instances of the topic are described in interface definition language (idl) file. Keys can represent arbitrary number of fields in topic. There are various topics in the framework related to monitoring information, node heartbeat, control commands for sensors, node state inThe primary goal of this paper is to present an event formation, and MPI process state information. based distributed monitoring framework “RFDMon” for 1. MONITORING INFO : System resource and distributed systems that utilizes the data distribution service (DDS) methodology to report the events or monitorhardware health monitoring sensors publish mea10
Figure 8: Architecture of Sensor Framework surements under monitoring info topic. This topic contains Node Name, Sensor Name, Sequence Id, and Measurements information in the message. 2. HEARTBEAT : Heartbeat Sensor uses this topic to publish its heartbeat in the DDS domain to notify the framework that it is alive. This topic contains Node name and Sequence ID fields in the messages. All nodes which are listening to HEARTBEAT topic can keep track of existence of other nodes in the DDS domain through this topic. 3. NODE HEALTH INFO : When leader node (defined in Section 5.6) detects change in state (UP, DOWN, FRAMEWORK DOWN of any node through change in heartbeat, it publishes NODE HEALTH INFO topic to notify all of the other nodes regarding change in status of the node. This topic contains node name, severity level, node state, and transition type in the message. 4. LOCAL COMMAND : This topic is used by the leader to send the control commands to other local nodes for start, stop, or poll the monitoring sensors 11
for measurements. It contains node name, sensor name, command, and sequence id in the messages. 5. GLOBAL MEMBERSHIP INFO : This topic is used for communication between local nodes and global membership manager for selection of leader and for providing information related to existence of the leader. This topic contains sender node name, target node name, message type (GET LEADER, LEADER ACK, LEADER EXISTS, LEADER DEAD), region name, and leader node name fields in the message. 6. PROCESS ACCOUNTING INFO : Process accounting sensor reads records from the process accounting system and publishes the records under this topic name. This topic contains node name, sensor name, and process accounting record in the message. 7. MPI PROCESS INFO : This topic is used to publish the execution state (STARTED, ENDED, KILLED) and MPI/PBS information variables of MPI processes running on the computing node.
These MPI or PBS variable contains the process Ids, number of processes, and other environment variables. Messages of this topic contain node name, sensor name, and MPI process record fields. 8. WEB APPLICATION INFO : This topic is used to publish the performance measurements of a web application executing over the computing node. This performance measurement is a generic data structure that contains information logged from the web service related to average response time, heap memory usage, number of JAVA threads, and pending requests inside the system.
5.3
Topic Managers
Topic Managers are classes that create subscriber or publisher for a pre defined topic. These publishers publish the data received from various sensors under the topic name. Subscribers receive data from the DDS domain under the topic name and deliver to underlying application for further processing.
5.4
Region
The proposed monitoring framework functions by organizing the nodes in to regions (or clusters). Nodes can be homogeneous or heterogeneous. Nodes are combined only logically. These nodes can be located in a single server rack or on single physical machine (in case of virtualization). However, physical closeness is recommended to combine the nodes in a single region to minimize the unnecessary communication overhead in the network.
5.5
Local Manager
Local manager is a module that is executed as an agent on each computing node of the monitoring framework. The primary responsibility of the Local Manager is to set up sensor framework on the node and publish the measurements in DDS domain.
5.6
Leader of the Region
Among multiple Local Manager nodes that belongs to same region, there is a Local Manager node which is selected for updating the centralized monitoring database for sensor measurements from each Local Manager. Leader of the region will also be responsible for updating the changes in state (UP, DOWN, FRAMEWORK DOWN) of various Local Manager nodes. Once
a leader of the region dies, a new leader will be selected for the region. Selection of the leader is done by Global Membership Manager module as described in next subsection.
5.7
Global Membership Manager
Global Membership Manager module is responsible to maintain the membership of each node for a particular region. This module is also responsible for selection of a leader for that region among all of the local nodes. Once a local node comes alive, it first contacts the global membership manager with node’s region name. Local Manager contacts to Global membership manager for getting the information regarding leader of its region, global membership manager replies with the name of leader for that region (if leader exists already) or assign the new node as leader. Global membership manager will communicate the same local node as leader to other local nodes in future and update the leader information in file (“REGIONAL LEADER MAP.txt”) on disk in semicolon separated format (RegionName:LeaderName). When a local node sends message to global membership manager that its leader is dead, global membership manager selects a new leader for that region and replies to the local node with leader name. It enables the fault tolerant nature in the framework with respect to regional leader that ensures periodic update of the infrastructure monitoring database with measurements. Leader election is a very common problem in distributed computing system infrastructure where a single node is chosen from a group of competing nodes to perform a centralized task. This problem is often termed as “Leader Election Problem”. Therefore, a leader election algorithm is always required which can guarantee that there will be only one unique designated leader of the group and all other nodes will know if it is a leader or not [19]. Various leader election algorithms for distributed system infrastructure are presented in [19, 20, 21, 22, 23]. Currently, “RFDMon” selects the leader of the region based on the default choice available to the Global Membership Manager. This default choice can be the first node registering for a region or the first node notifying the global membership manager about termination of the leader of the region. However, other more sophisticated algorithms can be easily plugged into the framework by modifying the global membership manager module for leader election. Global membership Manager is executed through a
12
Figure 9: Class Diagram of the Sensor Framework wrapper executable “GlobalMembershipManagerAPP” as a child process. “GlobalMembershipManagerAPP” keeps track of execution state of the Global membership manager and starts a fresh instance of Global membership manager if the previous instance terminates due to some error. New instance of Global membership manager receives data from “REGIONAL LEADER MAP.txt” file. It enables the fault tolerant nature in the framework with respect to global membership manager. UML class diagram to show the relation among above modules is shown in Figure 9. Next section will describe the details regarding each sensor that is executing at each local node.
6
Sensor Implementation
Periodic sensors are implemented for system resources and performance data while aperiodic sensors are used for MPI process state and other system events that gets triggered only on availability of the data. These sensors are executed as a ARINC-653 process on top of the ARINC-653 emulator developed at Vanderbilt [2]. All sensors on a node are deployed in a single ARINC-653 partition on top of the ARINC-653 emulator. As discussed in the section 2.4, the emulator monitors the deadline and schedules the sensors such that their periodicity is maintained. Furthermore, the emulator performs static cyclic scheduling of the ARINC-653 partition of the Local Manager. The schedule is specified in terms of a hyperperiod, the phase and the duration of execution in that hyperperiod. Effectively, it limits the maximum CPU utilization of the Local Managers. Sensors are constructed primarily with following properties:
The proposed monitoring framework implements various software sensors to monitor system resources, network resources, node states, MPI and PBS related information, and performance data of application in execution on the node. These sensors can be periodic or aperiodic depending upon the implementation and type of resource. 13
• Sensor Name : Name of the sensor (e.g. UtilizationAggregatecpuScalar). • Sensor Source Device: Name of the device to mon-
Sensor Name CPU Utilization Swap Utilization Ram Utilization Hard Disk Utilization CPU Fan Speed Motherboard Fan Speed CPU Temperature Motherboard Temperature CPU Voltage Motherboard Voltage Network Utilization Network Connection Heartbeat Process Accounting MPI Process Info Web Application Info
Period 30 seconds 30 seconds 30 seconds 30 seconds 30 seconds 10 seconds 10 seconds 10 seconds 10 seconds 10 seconds 10 seconds 30 seconds 30 seconds 30 seconds -1 -1
Description Aggregate utilization of all CPU cores on the machines. Swap space usage on the machines. Memory usage on the machines. Disk usage on the machine. Speed of CPU fan that helps keep the processor cool. Speed of motherboard fan that helps keep the motherboard cool. Temperature of the processor on the machines. Temperature of the motherboard on the machines. Voltage of the processor on the machines. Voltage of the motherboard on the machines. Bandwidth utilization of each network card. Number of TCP connections on the machines. Periodic liveness messages. Periodic sensor that publishes the commands executed on the system. Aperiodic sensor that reports the change in state of the MPI Processes. Aperiodic sensor that reports the performance data of Web Application.
Table 1: List of Monitoring Sensors itor for the measurements (e.g. “/proc/stat”). • Sensor Period : Periodicity of the sensor (e.g. 10 seconds for periodic sensors and −1 for aperiodic sensors). • Sensor Deadline : Deadline of the sensor measurements : HARD (strict) or SOFT (relatively lenient). A sensor has to finish its work within a specified deadline. A HARD deadline violation is an error that requires intervention from the underlying middleware. A SOFT deadline violation results in a warning.
mand starts the already initialized sensor to start publishing the sensor measurements. STOP command stops the sensor thread to stop publishing the measurement data. POLL command tries to get the latest measurement from the sensor. These sensors publish the data as per the predefined topic to the DDS domain (e.g. MONITORING INFO or HEARTBEAT). The proposed monitoring approach is equipped with various sensors that are listed in table 1. These sensors are categorized in following subsections based upon their type and functionality.
System Resource Utilization Monitoring Sensors
• Sensor Priority : Sensor priority indicates the priority of scheduling the sensor over other processes A numbers of sensors are developed to monitor the utiin to the system. In general, normal (base) priority lization of system resources. These sensors are periodic (30 seconds) in nature, follow SOFT deadlines, contains is assigned to the sensor. normal priority, and read system devices (e.g. /proc/state, • Sensor Dead Band : Sensor reports the value only /proc/meminfo etc) to collect the measurements. These if the difference between current value and previous sensors publish the measurement data under MONITORrecorded value becomes greater than the specified ING INFO topic. sensor dead band. This option reduces the number of sensor measurements in the DDS domain if value 1. CPU Utilization : CPU utilization sensor monitors of sensor measurement is unchanged or changing “/proc/stat” file on linux file system to collect the slightly. measurements for CPU utilization of the system. Life cycle and function of a typical sensor (“CPU utilization”) is described in figure 11. Periodic sensors pub2. RAM Utilization : RAM utilization sensor monlish data periodically as per the value of sensor period. itors “/proc/meminfo” file on linux file system to Sensors support four types of commands for publishcollect the measurements for RAM utilization of the ing the data : START, STOP, and POLL. START comsystem. 14
Figure 10: Architecture of MPI Process Sensor 3. Disk Utilization : Disk utilization sensor monitors executes “df -P” command over linux file system and processes the output to collect the measurements for disk utilization of the system.
2. CPU Temperature : CPU temperature sensor executes “ipmitool -S SDR CPU1 Temp” command over linux file system to collect the measurement of CPU temperature.
4. SWAP Utilization : SWAP utilization sensor monitors “/proc/swaps” file on linux file system to collect the measurements for SWAP utilization of the system.
3. Motherboard Temperature : Motherboard temperature sensor executes “ipmitool -S SDR Sys Temp” command over linux file system to collect the measurement of Motherboard temperature.
5. Network Utilization : Network utilization sensor monitors “/proc/net/dev” file on linux file system to collect the measurements for Network utilization of the system in bytes per second.
4. CPU Voltage : CPU voltage sensor executes “ipmitool -S SDR CPU1 Vcore” command over linux file system to collect the measurement of CPU voltage. 5. Motherboard Voltage : Motherboard voltage sensor executes “ipmitool -S SDR VBAT” command over linux file system to collect the measurement of Motherboard voltage.
Hardware Health Monitoring Sensors In proposed framework, various sensors are developed to monitor health of hardware components in the system. e.g. Motherboard voltage, Motherboard fan speed, CPU fan speed etc. These sensors are periodic (10 seconds) in nature, follow soft deadlines, contains normal priority, and read the measurements over vendor supplied Intelligent Platform Management Interface (IPMI) interface [24]. These sensors publish the measurement data under MONITORING INFO topic.
Node Health Monitoring Sensors
Each Local Manager (on a node) executes a Heartbeat sensor that periodically sends its own name to DDS domain under topic “HEARTBEAT” to inform other nodes regarding its existence in the framework. Local nodes of the region keep track of the state of other local nodes in that region through HEARTBEAT messages which is transmit by each local node periodically. If a local 1. CPU Fan Speed : CPU fan speed sensor executes node gets terminated, leader of the region will update the IPMI command “ipmitool -S SDR fan1” on linux monitoring database with node state transition values and file system to collect the measurement of CPU fan will notify other nodes regarding the termination of a local node through topic “NODE HEALTH INFO”. If a speed. 15
leader node gets terminated, other local nodes will notify the global membership manager regarding termination of the leader for their region through LEADER DEAD message under GLOBAL MEMBERSHIP INFO topic. Global membership manager will elect a new leader for the region and notify to local nodes in the region in subsequent messages. Thus, monitoring database will always contain the updated data regarding the various resource utilization and performance features of the infrastructure.
Scientific Application Health Monitoring Sensor The primary purpose of implementing this sensor is to monitor the state and information variables related to scientific applications executing over multiple nodes and update the same information in the centralized monitoring database. This Sensor logs all the information in case of state change (Started, Killed, Ended) of the process related to scientific application and report the data to administrator. In the proposed framework, a wrapper application (SciAppManager) is developed that can execute the real scientific application internally as a child process. MPI run command should be issued to execute this SciAppManager application from master nodes in the cluster. Name of the Scientific application and other arguments is passed as argument while executing SciAppManager application. (e.g. mpirun -np N -machinefile worker.config SciAppManager SciAPP arg1 arg2 .. argN ). SciAppManager will write the state information of scientific application in a POSIX message queue that exists on each node. Scientific application sensor will be listening on that message queue and log the message as soon as it receives. This sensor formats the data as pre-specified DDS topic structure and publishes it to the DDS domain under MPI PROCESS INFO topic. Functioning of the scientific application sensor is described in Figure 10.
on that message queue and log the message as soon as it receives. This sensor formats the data as pre-specified DDS topic structure and publishes it to the DDS domain under WEB APPLICATION INFO topic.
7
Experiments
A set of experiments have been performed to exhibit the system resource overhead, fault adaptive nature, and responsiveness towards fault in the developed monitoring framework. During these experiments, the monitoring framework is deployed in a Linux environment (2.6.18274.7.1.el5xen) that consists of five nodes (ddshost1, ddsnode1, ddsnode2, ddsnode3, and ddsnode4). All of these nodes execute similar version of Linux operating systems (Centos 5.6). Ruby on rails based web service is hosted on ddshost1 node. In next subsections one of these experiment is presented in detail.
Details of the Experiment In this experiment, all of the nodes (ddshost1, and ddsnode1..4) are started one by one with a random time interval. Once all the nodes have started executing monitoring framework, Local Manager on a few nodes are killed through kill system call. Once a Local Manager at a node is killed, Regional Leader reports change in the node state to the centralized database as FRAMEWORK DOWN. When Local Manager of a Regional Leader is killed, the monitoring framework elects its new leader for that region. During this experiment, the CPU and RAM consumption by Local Manager at each node is monitored through “TOP” system command and various node state transitions are reported to centralized database.
Observations of the Experiment
Web Application Performance Monitoring Sen- Results from the experiment are plotted as time series and presented in Figures 12, 13, 14, 15, and 16. sor This sensor keeps track of performance behaviour of the web application executing over the node through the web server performance logs. A generic structure of performance logs is defined in the sensor framework that includes average response time, heap memory usage, number of JAVA threads, and pending requests inside the web server. In proposed framework, a web application logs its performance data in a POSIX message queue (different from SciAppManager) that exists on each node. Web application performance monitoring sensor will be listening
Observations from the Figure 12 and 13 Figure 12 and 13 describes the CPU and RAM utilization by monitoring framework (Local Manager) at each node during the experiment. It is clear from the Figure 12 that CPU utilization is mostly in the range of 0 to 1 percent with occasional spikes in the utilization. Additionally, even in case of spikes, utilization is under ten percent. Similarly, according to Figure 13, RAM utilization by the monitoring framework is less than even two percent
16
Figure 12: CPU Utilization by the Sensor Framework at Each Node Figure 14: Transition in State of Nodes
Figure 13: RAM Utilization by the Sensor Framework at Each Node Figure 15: Leaders of the Sensor Framework during the Experiment which is very small. These results clearly indicates that overall resource overhead of the developed monitoring framework related to the regional leader, a new leader is approach “RFDMon” is extremely low. elected instantly without any further delay. This specific feature of the developed monitoring framework exhibit Observations from the Figure 14 and 15 that the proposed approach is robust with respect to failTransition of various nodes between states UP and ure of the Regional Leader and it can adapt to the faults FRAMEWORK DOWN is presented in Figure 14. Ac- in the framework instantly without delay. cording to the figure, ddshost1 is started first, then followed by ddsnode1, ddsnode2, ddsnode3, and ddsnode4. Observations from the Figure 16 At time sample 310 (approximately), Local Manager of host ddshost1 was killed, therefore its state has been Sensor framework at ddsnode1 was allowed to execute updated to FRAMEWORK DOWN. Similarly, state of during the complete duration of the experiment (from ddsnode2, and ddsnode3 is also updated to FRAME- sample time 80 to the end) and no fault or change was WORK DOWN once their Local Manager is killed on introduced in this node. The primary purpose of exetime sample 390 and 410 respectively. Local manager at cuting this node continuously was to observe the impact ddshost1 is again started at time sample 440, therefore its of introducing faults in the framework over the monistate is updated to UP at the same time. Figure 15 repre- toring capabilities of the framework. In the most ideal sents the nodes which were Regional Leaders during the scenario, all the monitoring data of ddsnode1 should be experiment. According to the figure, initially ddshost1 reported to the centralized database without any interrupwas the leader of the region, while as soon as Local Man- tion even in case of faults (leader re-election and nodes ager at ddshost1 is killed at time sample 310 (see Fig- going out of the framework) in the region. Figure 16 ure 14), ddsnode4 is elected as the new leader of the re- presents the CPU utilization of ddsnode1 from the cengion. Similarly, when local manager of the ddsnode4 is tralized database during the experiment. This data rekilled at time sample 520 (see Figure 14), ddshost1 is flects the CPU monitoring data reported by Regional again elected as the leader of the region. Finally, when Leader collected through CPU monitoring sensor from local manager at ddshost1 is again killed at time sample ddsnode1. According to the Figure 16, monitoring data 660 (see Figure 14), ddsnode2 is elected as the leader of from ddsnode1 was collected successfully during the entire experiment. Even in the case of regional leader rethe region. On combined observation of the Figure 14 and 15, it election at time sample 310 and 520 (see Figure 15), is clearly evident that as soon as there is a fault in the only one or two (max) data samples are missing from the 17
is presented in [9] where virtual machine monitoring tools, and web service performance monitors are combined with monitoring framework to manage the multidimensional QoS data for daytrader [26] web service executing over IBM Websphere Application Server [27] platform. “RFDMon” provides various key benefits that makes it a strong candidate for combining with other auFigure 16: CPU Utilization at node ddsnode1 during the tonomic performance management systems. Currently, Experiment the “RFDMon” is utilized at Fermi Lab, Batavia, IL for monitoring of their scientific clusters. database. Henceforth, it is evident that there is a minimal impact of faults in the framework over the monitoring functionality of the framework.
8
Benefits of the approach
“RFDMon” is comprehensive in type of monitoring parameters. It can monitor system resources, hardware health, computing node availability, MPI job state, and application performance data. This framework is easily scalable with the number of nodes because it is based upon data centric publish-subscribe mechanism that is extremely scalable in itself. Also, in proposed framework, new sensors can be easily added to increase the number of monitoring parameters. “RFDMon” is fault tolerant with respect to faults in the framework itself due to partial outage in network (if Regional Leader node stops working). Also, this framework can self-configure (Start, Stop, and Poll) the sensors as per the requirements of the system. This framework can be applied in heterogeneous environment. The major benefit of using this sensor framework is that the total resource consumption by the sensors can be limited by applying Arinc653 scheduling policies as described in previous sections. Also, due to spatial isolation features of Arinc-653 emulation, monitoring framework will not corrupt the memory area or data structure of applications in execution on the node. This monitoring framework has very low overhead on computational resources of the system as shown in Figure 12 and 13.
9
Application of the Framework
The initial version of the proposed approach was utilized in [25] to manage scientific workflows over a distributed environment. A hierarchical work flow management system was combined with distributed monitoring framework to monitor the work flows for failure recovery. Another direct implementation of the “RFDMon”
10
Future Work
“RFDMon” can be easily utilized to monitor a distributed system and can be easily combined with a performance management system due to its flexible nature. New sensors can be started any time during the monitoring framework and new set of publisher or subscriber can join the framework to publish a new monitoring data or analyse the current monitoring data. It can be applied to wide variety of performance monitoring and management problems. The proposed framework helps in visualizing the various resource utilization, hardware health, and process state on computing nodes. Therefore, an administrator can easily find the location of the fault in the system and possible causes of the faults. To make this fault identification and diagnosis procedure autonomic, we are developing a fault diagnosis module that can detect or predict the faults in the infrastructure by observing and co-relating the various sensor measurements. In addition to this, we are developing a self-configuring hierarchical control framework (extension of our work in [28]) to manage multi-dimensional QoS parameters in multi-tier web service environment. In future, we will show that the proposed monitoring framework can be combined with fault diagnosis and performance management modules for fault prediction and QoS management respectively.
11
Conclusion
In this paper we have presented the detailed design of “RFDMon” which is a real-time and fault-tolerant distributed system monitoring approach based upon data centric publish-subscribe paradigm. We have also described the concepts of OpenSplice DDS, Arinc-653 operating system, and ruby on rails web development framework. We have shown that the proposed distributed monitoring framework “RFDmon” can efficiently and accurately monitor the system variables (CPU utilization,
18
[7] A. Goldberg and G. Horvath. Software fault protection with arinc 653. In Aerospace Conference, 2007 IEEE, pages 1 –11, march 2007.
memory utilization, disk utilization, network utilization), system health (temperature and voltage of Motherboard and CPU) application performance variables (application response time, queue size, throughput), and scientific application data structures (e.g. PBS information, MPI variables) accurately with minimum latency. The added advantages of using the proposed framework have also been discussed in the paper.
12
[8] Ruby. http://www.ruby-lang.org/en/ [Sep2011]. [9] Rajat Mehrotra, Abhishek Dubey, Sherif Abdelwahed, and Weston Monceaux. Large scale monitoring and online analysis in a distributed virtualized environment. Engineering of Autonomic and Autonomous Systems, IEEE International Workshop on, 0:1–9, 2011.
Acknowledgement
R. Mehrotra and S. Abdelwahed are supported for this work from the Qatar Foundation grant NPRP 09-778[10] Lorenzo Falai. Observing, Monitoring and Evalu2299. A. Dubey is supported in part by Fermi National ating Distributed Systems. PhD thesis, Universita Accelerator Laboratory, operated by Fermi Research Aldegli Studi di Firenze, December 2007. liance, LLC under contract No. DE-AC02-07CH11359 with the United States Department of Energy (DoE), [11] Monitoring in distributed systems. http: and by DoE SciDAC program under the contract No. //www.ansa.co.uk/ANSATech/94/ DOE DE-FC02-06 ER41442. We are grateful to the Primary/100801.pdf[Sep2011]. help and guidance provided by T. Bapty, S. Neema, J. Kowalkowski, J. Simone, D. Holmgren, A. Singh, N. [12] Ganglia monitoring system. http://ganglia. sourceforge.net/[Sep2011]. Seenu and R. Herber.s
References
[13] Nagios. [Sep2011].
http://www.nagios.org/
[14] Zenoss, the cloud management company. http: [1] Andrew S. Tanenbaum and Maarten Van Steen. //www.zenoss.com/[Sep2011]. Distributed Systems: Principles and Paradigms. Prentice Hall, 2 edition, October 2006. [15] Nimsoft unified manager. http: //www.nimsoft.com/solutions/ [2] Abhishek Dubey, Gabor Karsai, and Nagabhushan nimsoft-unified-manager[Nov2011]. Mahadevan. A component model for hard-real time systems: Ccm with arinc-653. Software: Practice [16] Zabbix: The ultimate open source monitorand Experience, (In press), 2011. accepted for pubing solution. http://www.zabbix.com/ lication. [Nov2011]. [3] Opensplice dds community edition. http: [17] Opennms. http://www.opennms.org/ //www.prismtech.com/opensplice/ [Sep2011]. opensplice-dds-community. [18] Abhishek Dubey et al. Compensating for timing jit[4] Ruby on rails. http://rubyonrails.org/ ter in computing systems with general-purpose op[Sep2011]. erating systems. In ISROC, Tokyo, Japan, 2009. [5] Arinc specification 653-2 : Avionics application [19] Hans Svensson and Thomas Arts. A new leader software standard interface part 1required services. election implementation. In Proceedings of the Technical report, Annapolis, MD, December 2005. 2005 ACM SIGPLAN workshop on Erlang, ERLANG ’05, pages 35–39, New York, NY, USA, [6] Bert Farabaugh Gerardo Pardo-Castellote and 2005. ACM. Rick Warren. An introduction to dds and data-centric communications, 2005. http: [20] G. Singh. Leader election in the presence of link failures. Parallel and Distributed Systems, IEEE //www.omg.org/news/whitepapers/ Transactions on, 7(3):231 –236, mar 1996. Intro_To_DDS.pdf. 19
[21] Scott Stoller Dept and Scott D. Stoller. Leader election in distributed systems with crash failures. Technical report, 1997. [22] Christof Fetzer and Flaviu Cristian. A highly available local leader election service. IEEE Transactions on Software Engineering, 25:603–618, 1999. [23] E. Korach, S. Kutten, and S. Moran. A modular technique for the design of efficient distributed leader finding algorithms. ACM Transactions on Programming Languages and Systems, 12:84–101, 1990. [24] Intelligent platform management interface (ipmi). http://www.intel.com/design/ servers/ipmi/[Sep2011]. [25] Pan Pan, Abhishek Dubey, and Luciano Piccoli. Dynamic workflow management and monitoring using dds. In 7th IEEE International Workshop on Engineering of Autonomic & Autonomous Systems (EASe), 2010. under Review. [26] Daytrader. http://cwiki.apache.org/ GMOxDOC20/daytrader.html[Nov2010]. [27] Websphere application server community edition. http://www-01.ibm.com/software/ webservers/appserv/community/ [Oct2011]. [28] Rajat Mehrotra, Abhishek Dubey, Sherif Abdelwahed, and Asser Tantawi. A Power-aware Modeling and Autonomic Management Framework for Distributed Computing Systems. CRC Press, 2011.
20
Figure 11: Life Cycle of a CPU Utilization Sensor 21