Scientific Journals
Zeszyty Naukowe
Maritime University of Szczecin
Akademia Morska w Szczecinie
2011, 25(97) pp. 77–85
2011, 25(97) s. 77–85
Risk assessment of LNG carrier systems failure using fuzzy logic Ocena ryzyka awarii systemów statku LNG przy pomocy logiki rozmytej Paweł Zalewski Maritime University of Szczecin, Faculty of Navigation, Institute of Marine Traffic Engineering Akademia Morska w Szczecinie, Wydział Nawigacyjny, Instytut Inżynierii Ruchu Morskiego 70-500 Szczecin, ul. Wały Chrobrego 1–2, e-mail:
[email protected] Key words: fuzzy logic, risk assessment, LNG carrier Abstract The failure data available for power, navigation, propulsion and steering systems onboard LNG carriers, during critical manoeuvres in the final harbour and berth approach phase, are often accompanied with a high degree of uncertainty. For this reason the use of conventional probabilistic risk assessment methods may not be well suited. The approach described uses fault tree analysis to calculate the fuzzy probability of systems failure. The risks associated with failure events are determined by combining their occurrence likelihood (probability) and possible consequences to produce a risk ranking. Słowa kluczowe: logika rozmyta, ocena ryzyka, zbiornikowiec LNG Abstrakt Dane dotyczące zawodności systemów energetycznych, nawigacyjnych, napędowych i sterowych zbiornikowców LNG podczas manewrów w fazie podejścia i cumowania do nabrzeża są często obarczone dużą miarą niepewności. Z tego powodu tradycyjne, probabilistyczne metody oceny ryzyka mogą nie być w tych sytuacjach adekwatne. Zaprezentowana metoda wykorzystuje analizę drzewa niezdatności w celu wyznaczenia rozmytego prawdopodobieństwa awarii systemu. Ryzyka związane z sytuacjami awaryjnymi są kwantyfikowane na podstawie ich prawdopodobieństwa zajścia oraz możliwych skutków i kategoryzowane.
Introduction
vance of data. In the case of data relating to human error, equipment or material failure, the attributes of the equipment are often not recorded and insufficient data is given in the context of its use. Almost invariably, failures are assumed to be random in time, that is, the observed number of failures is divided by an exposure period to give a failure rate and this is assumed to be age independent [3]. In reality, some modes of failure are more common in the earlier or later years of the life of a component or a system, and some modes of failure are rectified in newer versions of a system though others can be generated. Even where data is of high quality, sample sizes are often small and statistical uncertainties are correspondingly large. As such, the fuzzy logic modelling approach may be more
Where a major decision regarding cost or safety implication has to be made, the quantification of risks and costs becomes necessary. In the quantification of risk, two parameters are considered: probability of failure event, consequence severity. These two parameters are evaluated in many risk assessments utilised in contemporary marine FSA (formal safety assessment) [1, 2, 3]. The frequencies of hazardous events are usually based on historical failure data. Often, little is known of the sources of the data or its processing and interpretation. That insufficient knowledge often raises doubts as to the quality, completeness and releZeszyty Naukowe 25(97)
77
Paweł Zalewski
appropriate to model the probability of a hazardous event. The quantification of severity can be accomplished in several ways, subjective reasoning and expert judgement is one of the common methods. As many accidents in the marine industry, especially on LNG carriers, can lead even to catastrophic consequences, it may be difficult to quantify the severity of an accident. Once again, similarly as in risk assessment of dynamic positioning systems in offshore vessels [4], the use of the fuzzy logic modelling approach integrating expert knowledge may be well suited for this purpose.
The vagueness in these estimates may lead the captain and pilot to use different judgements to carry out the operation (Fig. 1) and hence there will be a non-uniform approach to safe limits within the ship management. Disagreement in choosing out of several alternatives (actions) can be also defined as a conflict of evaluations. For example, in the probability distribution P(x), each probability measure is for a specific alternative in a set of mutually exclusive alternatives. Each P(x) expresses the “degree of belief” (based on some evidence) that a particular alternative is the correct one. Thus, the beliefs expressed in a probability distribution may be in conflict with each other. For instance, a belief of 90% (probability) that the lateral thruster will fail under certain conditions is in conflict with a belief of 10% that the thruster will not fail. Non-specificity is a lack of information resulting from not clearly stated or distinguished alternatives. Non-specificity is characterised by sizes of relevant sets of alternatives. The more possible alternatives a situation has, the less specific the situation is (a situation is completely specific if there is only one possible alternative). Because each probability in a probability distribution is completely specific to a particular alternative, the probability theory is not capable of conceptualising non-specificity [7, 8, 9].
Uncertainty of system failure Uncertainty arises when information or knowledge is deficient. There is a close relationship between complexity and uncertainty and it is said that as complexity increases, certainty decreases. Uncertainty can be divided into [5]: fuzziness, ambiguity resulting from disagreement, ambiguity resulting from non-specificity. Fuzziness is uncertainty resulting from vagueness or lack of precision in statements. Most natural language descriptors are vague and somewhat uncertain, rather than precise. Because collision, grounding and contact are together responsible for about 90% of the total LNG carriers’ incidents [6], the following are examples of fuzzy, uncertain assumptions while navigating the LNG carrier in restricted waters: a certain degree of subjectivity in quantitative estimates or qualitative considerations and expert judgement of navigational safety, a certain degree of subjectivity in quantitative estimates or qualitative considerations and expert judgement of manoeuvrability, a certain degree of subjectivity in quantitative estimates or qualitative considerations and expert judgement of collision avoidance.
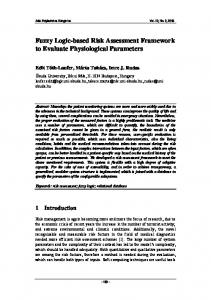
Risk assessment using fuzzy logic A combination of the fuzzy logic theory and expert judgement can be used to accomplish the modelling of the probability and severity of consequences. The outcome can be used to rank the risk associated with failure events according to their priority. Figures 2, 3 and 4 show the block diagram of a risk ranking procedure. Available data
Evaluation of probability
Evaluation of consequences
Risk synthesis & ranking
Fig. 1. The LNG Rivers navigating in the river fairway during harbour approach Rys. 1. Zbiornikowiec LNG na torze wodnym podczas podejścia do portu [LNG Rivers]
Fig. 2. Procedure of risk ranking Rys. 2. Schemat wyznaczenia ryzyka
78
Scientific Journals 25(97)
Risk assessment of LNG carrier systems failure using fuzzy logic
Evaluation of probability (Fig. 3) involves Fault Tree Analysis (FTA) to identify the critical components of a system [3, 5]. With the use of this FTA, fuzzy arithmetic calculation can be performed on the basic events to obtain the fuzzy probability estimates of the primary events. The results are left in the linguistic state to enable integration with the analysis of severity of consequences. Structure selection
List of consequences completed
No
Use expert judgement
Yes Assign consequence score for each group
FTA construction
Membership function and estimation
Personnel
Equipment
Operation
Environment
Fuzzy calculation
Calculate total score for each event
Event probability
Fuzzy rules, membership function and estimation
Fig. 3. Procedure of probability evaluation based on [4, 5] Rys. 3. Schemat wyznaczenia prawdopodobieństwa zdarzenia na podstawie [4, 5]
Fuzzy calculation
The severity of a failure (Fig. 4) is assessed for its effect on four categories: personnel (people involved in LNG operations), equipment, environment, and operation performed (usually a cost of stand down from operational status). The results of the probability and consequences analysis can be combined using the min-max inference rule to obtain a linguistic term for the risk. The procedure is very similar to the one commonly used in fuzzy control [10]. Afterwards, this linguistic term can be defuzzified using the weighted mean of maximum method to produce the risk ranking. The first step of the described approach is to establish the type of data that is available for analysis. Depending on the size and organisational structure of the vessel and company, such data will vary in terms of its format and availability. Such data should be restructured to enable analysis using the fuzzy set approach. The consequences of an event may not be documented in a format where it is readily usable for analysis. The severity of the consequences could be determined by the cost incurred from the failure consequence. This however may only be limited to equipment loss, production loss, environmental clean up cost, etc. The injury or loss of life is normally expressed in terms of number of casualties and the extent of the injury (bruises etc. treated on board, required shore medical assistance, permanent disability or death). The cost in such case is usually limited to insurance or values stipulated in relevant employment contracts. Zeszyty Naukowe 25(97)
Severity of consequences Fig. 4. Procedure of consequences evaluation based on [4, 5] Rys. 4. Schemat wyznaczenia skutków zdarzenia na podstawie [4, 5] Probability of failure event
After failure data collection, the fault tree construction is commenced – data must be grouped and sorted by its equipment / sub-system and finally the system to which the component belongs. The top event of the fault tree will be the failure of the equipment (e.g. gyrocompass) while the initiating events and basic events will be the component failures (e.g. too high internal DC power supply, exceeding limits of the gyro rate of turn). It is best to construct a fault tree for equipment within a system separately, as it enables data handling and analysis to be conducted. The individual fault trees can later be combined to analyse the total system failure. In the structure selection phase, the linguistic variable is determined with respect to the aim of the modelling of an undesired critical event. Informally, a linguistic variable is a variable whose values are words or sentences rather than numbers. Considering the available data at hand and the aim of this approach, the linguistic variable is determined to be the likelihood of an undesired critical event. The linguistic terms to describe this variable are then decided, for example: very high, high, moderate, low and remote. 79
Paweł Zalewski
Six types of experimental methods help to determine membership functions: horizontal approach, vertical approach, pair-wise comparison, inference based on problem specification, parametric estimation and fuzzy clustering [10].The method selected depends heavily on the specifics of an application, in particular, the way the uncertainty is manifested and captured during the sampling of data. The membership function chosen must be able to represent the available data in the most suitable and accurate manner. As no mathematically rigorous formulas or procedures exist to accomplish the design of input fuzzy sets – the proper determination of design parameters is strictly dependent on the experience with system behaviour. For simplification of the arithmetic involved, the shape of the membership function suited for the approach would either be triangular or trapezoidal, therefore the horizontal or vertical approach for function determination can be applied. The vertical method “constructs” a fuzzy set via identifying its α-cuts [4]. The α-cut of set A, denoted by Aα, is a set consisting of those elements in the universe X whose membership values exceed the threshold level α. This is formally represented by: A x Ax
Given the critical event or undesired condition (top event), a fault tree can be developed backwardly to create a network of intermediate events linked by logic operators (usually AND and OR operators) down to the basic events, and to enable fuzzy calculation. The fault tree itself is the logic structure relating the top event to the primary events. These primary/basic events may be related to human error (operators, design or maintenance), hardware or software failures, environmental conditions or operational conditions. The probability of the fuzzy set A as the expected value of the membership function for A can be defined as: ~ PA A x d P (2)
X
in a discrete space X x1 , x2 , x3 ... xn , this gives: ~ PA
n
x Px A
i
(3)
i
i 1
Equations (2) and (3) define the probability of a fuzzy event as the summation over all elements, or as the probability the event occurs weighted by the degree to which the element is a member of the event. Alternatively, it can be viewed as the probability of the possibility of the fuzzy event. For most systems, the organisational structure can be described as either “parallel” or “series” or a combination of series and parallel. System reliability can be analysed probabilistically as follows: if Pi = probability of failure of component i, then Ri = reliability of component = 1 – Pi. If Psys = system probability of failure, then Rsys = system reliability = 1 – Psys. In a parallel system of two components A and B with fuzzy probabilities the system probability failure will be the product of the individual component failure probabilities similarly as is traditionally assumed [3, 6, 8]: ~ ~ ~ Psys PA PB (4) ~ where: Psys is fuzzy system probability of failure, ~ ~ PA and PB are fuzzy probabilities of failure events A and B. In a series system, all constituent components must be operational in order for the system to work. Series systems are analysed in terms of their component reliabilities. The analysis of a series system using reliabilities is identical to that of a parallel system using failure probabilities. In terms of failure probabilities for a series system of two components A and B with fuzzy probabilities, the system probability failure will be: ~ ~ ~ Psys 1 1 PA 1 PB (5)
(1)
In other words, Aα consists of elements of x identified with A to a degree of at least α. In particular, the highest level, α = 1, determines a set of x totally belonging to A. After several levels of α are selected, the investigator is required to identify the corresponding subset of X whose elements belong to A to a degree not less than α. The fuzzy set is built by stacking up the successive α-cuts (Fig. 5).
Fig. 5. Vertical approach for a membership function determination based on α-cuts Rys. 5. Wyznaczenie wartości przynależności do zbioru rozmytego techniką α-cięcia
80
Scientific Journals 25(97)
Risk assessment of LNG carrier systems failure using fuzzy logic
When two basic events represent the input to an AND gate in a fault tree, it can be assumed that these two events are in a parallel configuration. It denotes that the occurrence of both events will cause the AND gate to be operative and the probability will be given by Equation (4). For an OR gate with two basic events as its input in a fault tree, it can be considered that the two events are in a series configuration. This denotes that if either event occurs, the OR gate will be operative and the probability will be given by equation (5). Fuzzy arithmetic operations are equivalent to basic operations on real numbers extended to those on fuzzy intervals. A fuzzy interval A is a normal fuzzy set on R (set of real numbers) whose α-cuts for all (0,1] are closed intervals of real numbers and whose support is bounded by A [4]. When α-cut representation is employed, arithmetic operations on fuzzy intervals are defined in terms of arithmetic operations on closed intervals. An example addition operation on the α-cut: ( x) 0.5 is presented in figure 5. Using symbols [a1 , a2 ] and [b1 , b2 ] to denote for each α-cuts of fuzzy intervals A and B (where (0,1] ), one example addition operation on these intervals can be defined by the following formula:
A B a1 b1 , a2 b2
event or failure, a rating describing the consequences of an event occurring in linguistic terms such as “Negligible”, “Marginal”, “Critical” and “Catastrophic” can be utilised [5]. The significance of each of the ratings can be described as follows: Personnel: effect of failure of the item on personnel (worst case always assumed): Rating 1 = Negligible (no or little damage – bruises / cuts), Rating 2 = Marginal (minor injuries – treatable on board), Rating 3 = Critical (major injuries – requires professional attention), Rating 4 = Catastrophic (death/permanent disability). Equipment: effect of failure on machinery or system in terms of down time and cost of repair: Rating 1 = Negligible (no or little attention needed – cleaning up / drying / resetting), Rating 2 = Marginal (minor repair – few hrs lost), Rating 3 = Critical (major repair – few days lost), Rating 4 = Catastrophic (destruction of equipment – total system shutdown / ship lost). Operation: effect of failure on LNG carrier operation in terms of down time: Rating 1 = No effect (no or little effect), Rating 2 = Marginal effect (operation affected for a few hours), Rating 3 = Critical effect (operation affected for a few days), Rating 4 = Catastrophic effect (operation affected for a few months). Environment: effect of failure of the item on the environment: Rating 1 = No effect (no or little effect), Rating 2 = Marginal effect (can be controlled by ship personnel), Rating 3 = Critical effect (requires shore assistance), Rating 4 = Catastrophic effect (permanent damage to the environment). Upon assigning a score for each group, a table is generated as shown in table 1. From this table, a “Total Score” is calculated by summing the score of each individual group for an event as in [5]. This total score will later be used to assign the membership function for that event using fuzzy rules. For example, the fuzzy rules determining the membership function of each event can be divided into four categories or hazard classes: HC1, HC2, HC3 and HC4. The maximum score of an event is
(6)
Fig. 6. Addition operation on the fuzzy set α-cut Rys. 6. Operacja sumowania zbiorów rozmytych dla α-cięcia Consequences evaluation
The consequences compiled for each event / failure have to be categorised or grouped for further analysis. In the general LNG carrier operations, four groups can be identified (Fig. 3): personnel, equipment, operation and environment. For each Zeszyty Naukowe 25(97)
81
Paweł Zalewski n
Table 1. Event score Tabela 1. Kwantyfikacja zdarzenia
xij 8
Personnel
Equipment
Operation
Environment
Failure y1
x11
x21
x31
x41
Σxi1
Failure y2
x12
x22
x32
x42
Σxi2
Failure y3
x13
x23
x33
x43
Σxi3
…
…
…
…
…
…
Failure yn
x1n
x2n
x3n
x4n
Σxin
xij 4 ,
Negligible
2) If max(xij ) = 2, and then
N ( x) 0.75 ,
M ( x) 0.5 ,
3) If max(xij ) = 3, and n
(M – Marginal) (HC21); n
xij 6
then
j 1
M ( x) 1.0 ,
xij 6
C ( x) 0.2 ,
xij 7 j 1
then
M ( x) 0.7 ,
then
M ( x) 0.5 ,
C ( x) 1.0 ,
then
M ( x) 0.1 ,
C ( x) 0.8 ,
j 1
(HC31);
(C – Critical) (HC22); n
Catastrophic
The minimum score possible in the HC3 category is 6, i.e. {3,1,1,1} or any variation of this score. The maximum possible score is 12, i.e. {3,3,3,3}. When assigning the linguistic membership function for HC3, it is important to compare the values with those of the HC2 to ensure that it does not contradict the rules generated for that hazard class. For the same total score in HC2 and HC3, the linguistic membership function for HC3 should logically reflect a more severe consequence. For example, for a total score of 8 for HC2 and HC3, which would have a combination of {2,2,2,2} and {3,2,2,1} respectively, using expert judgement, one would say that although both classes have the same total score, a total score of 8 for HC3 would entail a more severe consequence. Hence the membership function for HC3 and a total score of 8 can be 0.5 Critical, 0.5 Catastrophic while the membership function for HC2 with the same total score of 8 is 0.1 Marginal, 1.0 Critical, 0.2 Catastrophic. Using this method, the rules for HC3 can be generated for the other values of its total scores as are reflected below:
then the membership value of
j 1
Critical
Fig. 7. Membership functions for hazard class 2 Rys. 7. Funkcje przynależności dla zagrożenia klasy 2
“Negligible” fuzzy set: N ( x) 1.0 , (N - Negligible) (rule HC11). The minimum score possible in the HC2 category is 5, i.e. {2,1,1,1} or any variation of this score. The maximum possible score is 8, i.e. {2,2,2,2}, therefore the range of membership function between these two extremities has to be assigned so as to ensure a smooth transition between limits to have overlapping of functions. Hence, according to the example in figure 7. n
Marginal
X
j 1
xij 5
C ( x) 1.0 ,
(R)
used to assign that particular event to the appropriate hazard class. Therefore, if an event has a score of {2,2,1,1} for each group respectively, it would be assigned to HC2 (the maximum score for that event is 2 for the “Personnel” and “Environment” categories). The membership functions for each hazard category should be generated based on available historical data, experience and complemented by expert knowledge. If an event has a score of {1,1,1,1}, which means that the effect of the failure is negligible on all categories, then the total effect of that failure on the system and environment should be negligible as well. That is why, n
M ( x) 0.1 ,
Ca ( x) 0.2 , (Ca-Catastrophic) (HC24). Total Score Σxij
1) If
then
j 1
n
xij 7
C ( x) 0.85 ,
j 1
Ca ( x) 0.2 , (HC32);
(HC23);
82
Scientific Journals 25(97)
Risk assessment of LNG carrier systems failure using fuzzy logic
j 1
C ( x) 0.5 ,
Table 2. Risk assessment from the probability and consequence table [5] Tabela 2. Ocena ryzyka na podstawie tabeli prawdopodobieństwa i skutków [5]
Ca ( x) 0.5 ,
(HC33); j 1
C ( x) 0.2 ,
Severity of consequences
Ca ( x) 0.8 ,
Negligible
n
xij 9 then (HC34); n
xij 10 then Ca ( x) 1.0 , (HC35). Probability of occurrence
j 1
4) If max(xij ) = 4, and n
xij 7 j 1
then Ca ( x) 1.0 , (HC41).
Grouping each event into a hazard class allows direct comparison with other events and enables the effects of a failure to be compared based on its linguistic terms assigned to it. For example, if an event A has a score of {3,1,1,2} with a total of 7 and event B has a score of {1,2,2,2} which also gives a total of 7, from experience and expert judgements, it can be said that event A is in most cases more serious in nature. Hence, it should be assigned a linguistic term which must be “more severe” compared to event B. Therefore, the membership functions for events A and B will be obtained from Rules (HC32) and (HC23), respectively. As each event has been assigned occurrence likelihood and possible consequences, the next step would be to analyse these two parameters and provide a risk ranking number for each event.
Low
RM LM MM HM
RC LC MC HC
RCa LCa MCa HCa
VHM
VHC
VHCa
Risk Moderate Important Extreme
ship in each input class using the membership functions developed (Fig. 8). The resulting fuzzy inputs are evaluated using the linguistic rule base to yield a classification of the risk of the failure and an associated degree of membership in each class. This fuzzy conclusion is then defuzzified to give a single crisp priority (or crisp risk ranking) for the failure. (R)
Example risk assessment of LNG carrier incident
Low
Moderate
Important
Extreme
R
The risk associated with an event increases as either its severity of the consequences or its occurrence probability increases. Judgement of the severity of possible consequences is, by its very nature, highly subjective. Using the priority table (Table 2), the “riskiness” of an event in linguistic terms can be obtained. The interpretation of risk ranking is given as below: Extreme – needs immediate corrective action. Important – review and corrective action to be carried out. Moderate – review to be carried out and corrective action implemented if found to be cost effective. Low – review subject to availability of revenue and time. The fuzzy set approach may provide alternative way of risk assessment. The analysis uses linguistic variables to describe the severity and probability of failure as in table 2, but these parameters are “fuzzified” to determine their degree of memberZeszyty Naukowe 25(97)
Remote RN Low LN Moderate MN High HN Very VHN High
Catastrophic
then
Critical
xij 8
Marginal
n
Fig. 8. Example membership functions for risk evaluation Rys. 8. Przykładowe funkcje przynależności dla oceny rozmytej ryzyka
Rules are evaluated using the min-max inference to calculate a numerical conclusion to the linguistic rule based on their input value [9, 10]. Thus the value of obtaining the truth by a rule is determined from the conjunction (i.e. minimum degree of membership of the rule antecedents). Thus this value is taken to be the smallest degree of truth of the rule antecedents. It is then applied to all consequences of the rule. If any fuzzy output is a consequent of more than one rule, that output is set to the highest (maximum) truth-value of all the rules that include it as a consequent. The result of the rule evaluation is a set of fuzzy conclusions that reflect the effects of all the rules whose truth-values are greater than zero. Let us consider the risk assessment table (Table 2) and membership functions for risk evaluation (Fig. 8), where the probability of 83
Paweł Zalewski Table 3. Results from hazard identification: Top-ranked hazards [1] Tabela 3. Wyniki identyfikacji zagrożeń: najbardziej zagrażające [1]
occurrence is “High”, the severity is “Marginal” and their associated degrees of belief are 0.6 and 1.0, respectively. Thus the conclusion Risk = “Important” has a membership value of min (0.6,1.0) = 0.6. To establish how risky the hazard is, this fuzzy conclusion has to be defuzzified to obtain a single crisp result. The defuzzification process creates a single assessment from the fuzzy conclusion set expressing the risk associated with the event, so that corrective actions can be prioritised. Several defuzzification techniques have been developed [10]. The common technique is centroid or weighted mean of maximum method [9]. This technique averages the points of maximum possibility of each fuzzy conclusion, weighted by their degrees of truth. Hence, if the conclusion from the risk evaluation phase is, for example, 0.6 “Low”, 0.2 “Low” and 0.3 “Moderate”, the maximum value for each linguistic term is taken. This reduces the conclusion to 0.6 “Low” and 0.3 “Moderate” to be defuzzified. The following example demonstrates how risk of LNG carrier systems failure using fuzzy logic can be obtained. The IMO (The International Maritime Organization) report of LNG carriers incidents [1, 6] presents the results of hazard identification (HAZID) conducted as a one-day workshop with participants from various sectors within the LNG industry, i.e. ship owner / operator, shipyard, ship design office / maritime engineering consultancy, equipment manufacturer, classification society and research centre / university. The results from the hazard identification were recorded in a risk register, which contains a total of 120 hazards within 17 different operational categories. The top ranked hazards according to the outcome is presented in table 3. Each hazard is associated with a risk index based on qualitative judgement by the HAZID participants [1]. Let us suppose the event “faults in navigation equipment” during a specific LNG carrier operation has the probability of occurrence “Moderate” (0.4 High, 0.9 Moderate, 0.5 Low). It can be obtained by analysing the event fault tree of individual subsystems failures, including: gyrocompass, GPS, radar/ARPA, AIS, ECDIS. The severity of consequences of this event is “Critical” (1.0 Critical). Then from table 2, the event will be denoted by the prefix MC and therefore is associated with a risk of “Important”. However, considering all the membership functions of the two parameters, i.e. probability of occurrence and severity, the following terms of risk are generated: 0.4 High, 1.0 Critical = HC = 0.4 Extreme; 0.9 Moderate, 1.0 Critical = MC = 0.9 Important;
No. 1 2 3 4 5 6 7 8 9 10 11 12
Hazard Faults in navigation equipment (in coastal waters) Crew falls or slips onboard Shortage of crew when LNG trade is increasing Rudder failure (in coastal waters) Rudder failure (in manoeuvring) Severe weather causing vessel to ground/collide (in transit) Steering and propulsion failure (in manoeuvring) Severe weather causing vessel to ground/collide (in manoeuvring) Faults in navigation equipment (in manoeuvring) Steering and propulsion failure (in coastal waters) Collision with other ships or facilities (in port) Terrorist attacks/intentional accidents
Risk Index 7.0 7.0 6.8 6.8 6.8 6.6 6.6 6.6 6.6 6.6 6.6 6.5
0.5 Low, 1.0 Critical = LC = 0.5 Important. The risk is obtained as: Risk = (0.9 “Important”, 0.4 “Extreme”). From the figure 8, the support value for each linguistic term of risk is obtained, where: The support value for Important = 6; The support value for Extreme = 8. The support value represents an average value for a particular linguistic term. Taking the maximum value for each term of the risk, that is, 0.9 Important and 0.4 Extreme, the weighted mean is calculated as follows:
SR
0.9 6 0.4 8 6.14 1.0 0.4
(7)
From this result the risk of PRS failure event can be prioritised as being “Extreme” with a support of 6.14. Conclusions Based on the research presented herein, the following conclusions can be drawn: As the failure data available for systems onboard LNG vessels are often accompanied with a high degree of uncertainty and a human factor plays a big role in individual systems failures or misinterpretations, the fuzzy logic risk assessment technique can be well suited for safety analysis of such systems. 84
Scientific Journals 25(97)
Risk assessment of LNG carrier systems failure using fuzzy logic
The presented method quantifies risk value by linguistic terms and its corresponding fuzzy support value. Though the scale of support values is arbitrary, it can be modified freely for further analytical calculation, for instance in probabilistic navigational risk analysis. The presented method can be easily applied in the assessment of simulation scenarios during LNG carrier navigators / operators’ training or simulation based safety studies [4].
6. VANEM E., ET AL.: Analysing the Risk of LNG Carrier Operations. Reliability Engineering and System Safety 93, Elsevier 2008. 7. PIETRZYKOWSKI Z., GUCMA L.: Theoretical Foundations of the Probabilistic-Fuzzy Method for Assessment of Dangerous Situation of a Ship Manoeuvring in a Restricted Area. Annual of Navigation No. 3, Gdynia 2001. 8. PIETRZYKOWSKI Z., GUCMA L.: Application of the Probabilistic-Fuzzy Method for Assessment of a Dangerous Situation of a Ship Manoeuvring in a Restricted Area. Annual of Navigation No. 4, Gdynia 2002. 9. ZALEWSKI P.: Fuzzy Fast Time Simulation Model of Ship’s Manoeuvring. Subchapter 2.5 in the monograph “Marine Navigation and Safety of Sea Transportation” edited by Weintrit, CRC Press / Balkema, Rotterdam, Taylor & Francis Group, London 2009. 10. YING H.: Fuzzy Control and Modelling, Analytical Foundations and Applications. IEEE Press, New York 2000.
References 1. IMO: FSA – Liquefied Natural Gas (LNG) carriers submitted by Denmark. MSC83/21/1, IMO, 2007. 2. IMO: Guidelines for Formal Safety Assessment (FSA) for use in the IMO rule-making process. MSC/Circ.1023MEPC/Circ. 392, IMO, 2002. 3. KRYSTEK R. (ed.): Zintegrowany system bezpieczeństwa transportu. Tom. 2. WKiŁ, Warszawa 2009. 4. ZALEWSKI P.: Risk Assessment of DP Systems Failure Using Fuzzy Logic. Proceedings of the 8th International Probabilistic Workshop edited by Gucma, van Gelder & Proske, Szczecin 2010. 5. WANG J., EDITED BY PILLAY A.: Technology and Safety of Marine Systems. Elsevier Ocean Engineering Series, vol. 7, July 2003.
Zeszyty Naukowe 25(97)
Recenzent: dr hab. inż. Adam Weintrit, prof. AM Akademia Morska w Gdyni
85