Alex Down, Michael Coleman, Peter Absolon, Risk. Management for Software Projects, London, McGraw-. Hill Book Company, 1994. [2]. Boehm, B. W. 1988.
International Journal of Software Engineering Research & Practices Vol.5, Issue 2, October, 2015
Modelling Rate of Software Aggregative Risk Using Fuzzy Logic Technique Dr Harish Mittal Director, Sat Priya Group of Institutions, Rohtak, India mittalberi[at]yahoo.co.in
Kulbhushan Bansal M. Tech Scholar, Department of Computer Science NITTTR, Chandigarh,India Kul_bansal[at]yahoo.co.in
Abstract— despite numerous available methods of software risk management, software projects have a high rate of failure. Software risk analysis begins with the introduction of software proposal. Risk factors are added at each consecutive step. In this work we will introduce a model using fuzzy logic to efficiently evaluate the software aggregative risk based on some of these factors (risk items) in order to minimize risks in software development and enhance quality and reliability of software. Keywords- Risk Analysis, Software aggregative risk, Risk aggregation, Risk design, Risk management cycle.
1. INTRODUCTION In order to effectively manage a software project, we must learn to identify, analyze, and control software risks. Identifying and dealing with risks early lessens long term costs and helps prevent software disasters[23]. Major software risks identified may be categorized as [21]: • Technical risks • Management risks • Financial risks • Legal risks • Personnel risks
Lee’s model for evaluating rate of aggregative risk takes a large amount of time to form the fuzzy assessment and especially when the number of attributes is large, it is a tedious work. So there is a need of a more efficient and less complex method. II.
Avoiding software project disasters. Avoiding rework. Avoiding overkill. Stimulating a win-win software solution.
During the risk analysis, each risk is assessed to determine the probability that the risk will result in a loss and the size of that loss if the risk turns into a problem [3]. Lee et al. [12] uses 11 linguistic values for ranking the grades of risk of the risk items and uses them for ranking the grades of importance of the risk items. They evaluated the fuzzified rate of each individual risk item by the multiplication of these two fuzzy sets, the defuzzified result was obtained by centroid method.
Print-ISSN: 2231-2048 e-ISSN: 2231-0320 © RG Education Society (INDIA)
LITERARY REVIEW
Many researchers have focused their research on risk identification, risk analysis, risk priority, and risk management [2,4,6,7,8,10,12,15,17]. Boehm [3] pointed out four major reasons for implementing software risk management. He also pointed out 10 risk items. Lee et al. [12] uses 11 linguistic values for ranking the grades of risk of the risk items and uses 11 linguistic values for ranking the grades of importance of the risk items and represented them by triangular fuzzy numbers, Table I and Table II. Each individual risk item is represented using two fuzzy sets with TFNs: grade of risk and grade of importance.
Boehm defines four major reasons for implementing software risk management [3]: • • • •
Dr. Maitreyee Dutta Professor and Head, Dept. of CSE NITTTR, Chandigarh, India d_maitreyee[at]yahoo.co.in
S. No.
Grades of risk
1 2 3 4 5 6 7 8 9 10 11
Definitely low Extra low Very low Low Slightly low Middle Slightly high High Very high Extra high Definitely high TABLE I.
Triangular Fuzzy Number (0,0,0.1) (0,0.1,0.2) (0.1,0.2,0.3) (0.2,0.3,0.4) (0.3.,0.4,0.5) (0.4,0.5,0.6) (0.5,0.6,0.7) (0.6,0.7,0.8) (0.7,0.8,0.9) (0.8,0.9,1.0) (0.9,1.0,1.0)
GRADES OF RISK
S. No.
Grades of importance
1 2 3 4 5 6
Definitely unimportant Extra unimportant Very unimportant Unimportant Slightly unimportant Middle
Triangular Fuzzy Number (0,0,0.1) (0,0.1,0.2) (0.1,0.2,0.3) (0.2,0.3,0.4) (0.3.,0.4,0.5) (0.4,0.5,0.6)
1
International Journal of Software Engineering Research & Practices Vol.5, Issue 2, October, 2015 7 8 9 10 11
Slightly important Important Very important Extra important Definitely important
Because most decision makers or project managers usually evaluate the rate of risk factors by linguistic values, fuzzy set theory provides us a useful tool to deal with the ambiguity involved in the data evaluation process [23].
(0.5,0.6,0.7) (0.6,0.7,0.8) (0.7,0.8,0.9) (0.8,0.9,1.0) (0.9,1.0,1.0)
GRADES OF IMPORTANCE
TABLE II.
With the fast growing demand of software in almost every field there is a great scope of the study to evolve more and more efficient methods to minimise risks in the development of software. This will help to reduce the cost of the software development as well. II.
PROPOSED MODEL
In recent years, many researchers focused on the research of risk identification, risk analysis, risk priority, and risk management. Risk aggregation refers integrating multiple types/sources of risk into a single metric. Normally it is helpful to aggregate risks based on their interrelationships, and to develop options at an aggregate level.
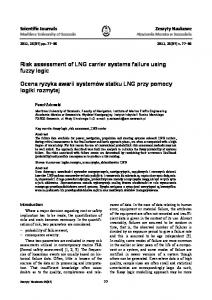
Risk Items
Fuzzification
This work will consist of various stages, starting with problem identification followed by research procedure and data collection, and will end with analysis of data. The risk items will first be fuzzified and then be processed as proposed in the model and a fuzzified result will be obtained which will then be defuzzified as per proposed model to provide aggregative risks values. Figure 1 provides an overview of methodology for modelling aggregative risk. Project managers first identify sub-metrics for each of the five metrics, technical risk, management risk, financial risk, legal risk, and personnel risk represented by M1, M2, M3, M4 and M5 respectively. Each metric can further be divided into r sub-metrics [23]. Data is collected from different sources based on a comprehensive literature review and interviewed with practitioners.
Apply Computational Rules of inference
Deffuzification
Aggregative Risk Figure 1: Methodology of evaluating Aggregative risks in software development
Potential risks associated with software development Technical Risks (M1) Financial Risks (M2) M11 Hacker gaining unauthorized access M12 Absence of firewall M13 Lack of using cryptography and Poor ‘‘key’’ management M14 Wrong project size estimation M15 Malicious code attacks M16 Disclosure of sensitive information M17 Language barrier M18 Project complexity M19 Loss of control over information technology M110 Continuous change of system requirements M111 Technological newness M112 Software or hardware problem-caused system failure M113 Poor design, code or maintenance procedure M114 Wrong functions and properties development M115 Wrong user interface development
Print-ISSN: 2231-2048 e-ISSN: 2231-0320 © RG Education Society (INDIA)
M21 Loss of audit trail M22 Wrong schedule estimation M23 Project behind schedule M24 Project over budget M25 Inadequate cash flow M26 Hidden cost Personnel risks (M3) M31 Personnel shortfalls M32 Lack of expertise and experience in e-commerce M33 Loss of key person
2
International Journal of Software Engineering Research & Practices Vol.5, Issue 2, October, 2015 Managerial Risks (M4)
Input values of risk and importance are then multiplied by the weights of the corresponding sub-metric to get pij, input value of sub-metric. The input value Pi, of a metric Mi, is taken as sum of input values of pij of sub-metrics Mij. Input values are then fuzzified and defuzzified as per rules.
•
M41 Poor project planning M42 Unclear project objectives and scope M43 Business process redesign M44 Organizational restructuring M45 Lack of trust between your organization and merchant or customer M46 Lack of top management support Legal Risks (M5) M51 Lack of international legal standards M52 New laws, regulations, and judicial decisions constantly change the online legal landscape M53 Uncertain legal jurisdiction M54 Incompletion of contract terms
• •
Complexity Of risk Very low Low Medium High Very high TABLE III.
TFN (0,0.1,0.2) (0.2,0.3,0.4) (0.4,0.5,0.6) (0.6,0.7,0.8) (0.8,0.9,1.0)
Grade of risk(Gr) 1 2 3 4 5
COMPLEXITY MATRIX OF RISK FOR SUBMETRICS
Each sub-metric is assigned a weight, wij, where i=1,2,2...5 and j=1,2,3...r. . • • •
•
The sum of weights of all the sub-metrics of any metric is taken as 1. The total weight of a metric is divided equally in all its sub-metrics. Each sub-metric is then given two grades, grade of risk (Gr) and grade of importance (Gi), as per rules given in Table III and IV. Input value of risk and importance are taken as mid values of the Triangular Fuzzy numbers corresponding to Gr and Gi.
Metric
Sub metric (Mij)
Weight (wij)
Grade of Risk (Gr)
Grade of Importance (Gi)
M1 r1=15
M11 M12 M13
1/r1 1/r1 1/r1 1/r1 1/r1 1/r2 1/r2 1/r2 1/r2 1/r3 1/r3 1/r3 1/r4 1/r4 1/r4 1/r4
4 4 4 4 4 3 3 3 3 2 2 2 2 2 2 2
5 5 5 5 5 5 5 5 5 4 4 4 3 3 3 3
M2 r2=6
M3 r3=3 M4 r4=6
M1r1 M21 M22 .. M2r2 M31 M32 M3r3 M11 M12 .. M1r4
Print-ISSN: 2231-2048 e-ISSN: 2231-0320 © RG Education Society (INDIA)
Complexity of importance
TFN
Very low Low Medium High Very high
(0,0.1,0.2) (0.2,0.3,0.4) (0.4,0.5,0.6) (0.6,0.7,0.8) (0.8,0.9,1.0)
TABLE IV.
Input value of risk of Mij 0.7 .7 .7 .7 .7 0.5 .5 .5 .5 .3 .3 .3 .3 .3 .3 .3
Grade of importance (Gi) 1 2 3 4 5
COMPLEXITY MATRIX OF IMPORTANCE FOR SUB-METRICS
Input value of importance of Mij 0.9 .9 .9 .9 .9 0.9 .9 .9 .9 0.7 0.7 0.7 0.5 .5 .5 .5
Input value of Mij (Pij) (wij*Mij risk, wij *Mij imp) 0.047 0.06 0.047 0.06 0.047 0.06 0.047 0.06 0.047 0.06 0.083 0.15 0.083 0.15 0.083 0.15 0.083 0.15 0.1 0.23 0.1 0.23 0.1 0.23 0.05 0.083 0.05 0.083 0.05 0.083 0.05 0.083
Input value of Metric Mi (Pi)
1.605
1.398
0.99
0.8
3
International Journal of Software Engineering Research & Practices Vol.5, Issue 2, October, 2015 M5 r5=4
M11 M12 .. M1r5
1/r5 1/r5 1/r5 1/r5
1 1 1 1
TABLE V.
Mi
Complexity
0-0.4 0.4-0.8 0.8 or more
Low Medium High
3 3 3 3
.1 .1 .1 .1
0.025 0.125 0.025 0.125 0.025 0.125 0.025 0.125
0.6
SUB-METRICS OF METRICS (ILLUSTRATIVE EXAMPLE)
are nott directly related to theoretical concepts and fundamentals are formulated.
Co-efficient efficient Ri w1 w2 w3
We define
COMPLEXITY MATRIX OF RISK FOR METRICS.
TABLE VI.
.5 .5 .5 .5
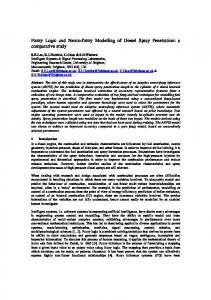
FuzzificationThe complexity attributes are taken as Triangular Fuzzy Numbers (TFN).. Membership functions are evaluated using complexity and co-efficient efficient matrices. Fuzzy pictorial representation of a TFN is shown in figure gure 2
µ
�
� �
� ∗ ��, 0 � Pi � 0.4 4 μ ∗ w� � μ� ∗ w , 0.4 � Pi � 0.8
� µ * w 2 + µ * w 3 ,0.8 < Pi < 1.2 � � μ ∗ �! , "� # 1.2
2---(2)
Here µ is grade of membership which lies between 0 and 1 �̅ 1 ' μ Pi is Input value of Metric Mi w1, w2, w3 are weights, For current example application we consider w1=0.1, w2= .15, w3=.2
1
For Example
R! µ * w 2
+ µ * w 3 ,0.8 < Pi < 1.2
= 0.95 * 0.15 + 0.05 * 0.2 = 0.1525
0
0.2
0.4
0.6
0.8
1
Figure 2: Triangular Fuzzy Number The membership function μ(x) (x) is defined as:
Aggregate Risk = ∑+* * Aggregative risk rate
=
, ∗. . ∑+� -/ ∑ ,
…(3) …(4)
0 -
Here, Wi is weight of each metric depending on grade and importance of Risk Considering Numerical Example in Table V, we get ---(1)
Using equation 3 & 4 Aggregate Risk = 0.2 + 0.198 + 0.1525 + 0.15 + 0.1 = 0.8005 Rate of Aggregative risk = 0.2127
For Example µ (0.99) =
�.�� – �.� �.� �.�
�.�� .�
�. �
DefuzzificationDefuzzification approach used in this work represents a substantive departure from the conventional fuzzy logic techniques [24,25]. 24,25]. The criteria for defuzzification which
Print-ISSN: 2231-2048 e-ISSN: ISSN: 2231 2231-0320 © RG Education Society (INDIA)
III.
CONCLUSION AND FUTURE WORK
This paper describes modified aggregative ggregative risk assessment
model which may be utilised to estimate and subsequently minimise risks in software development and enhance quality and reliability of software. The proposed assessment method in this paper uses the fuzzy numbers for the risk items to reduce the degree of subjectivity of the evaluator. The present model is an easy and effective technique to
4
International Journal of Software Engineering Research & Practices Vol.5, Issue 2, October, 2015 evaluate the aggregative risk of a software project and rate of Aggregative Risk. Future work involves case study on real projects data and involvements of groups and practitioners and experts for Aggregative Risk Assessment.
[16].
[17].
REFERENCES [18]. [1].
[2].
[3]. [4]. [5].
[6].
[7].
[8].
[9].
[10].
[11].
[12].
[13].
[14].
[15].
Alex Down, Michael Coleman, Peter Absolon, Risk Management for Software Projects, London, McGrawHill Book Company, 1994. Boehm, B. W. 1988. A spiral model of software development and enhancement. IEEE Computer 21s 5: 61- 72. Barry W. Boehm, Tutorial: Software Risk Management, Les Alamitos, CA, IEEE Computer Society, 1989. Boehm, B. W. 1991. Software risk management: Principles and practices. IEEE Software 8s 1. : 32- 41. Chen, S. M. 1994. Using fuzzy reasoning techniques for fault diagnosis of the J-85 jet engines. Proceedings of the 3rd National Conference on Science and Technology of Nation al Defence, Taoyuan, Taiwan, R.O .C., pp. 2934. Chen, S. M., and S. Y. Lin. 1995. A new method for fuzzy risk analysis. Proceedings of 1995 Artificial Intelligence Workshop, Taipei, Taiwan, R.O.C. pp. 245250. Chen, S. M. 1996. New methods for subjective mental workload assessment and fuzzy risk analysis. Cybernetics and Systems: An International Journal 27s 5.: 449-472. Chen, S. M. 1997. A new method to evaluate the rate of the aggregative risk in software development. Proceedings of the 8th International Conference on Information Management, Taipei, Taiwan, R.O.C., pp. 791- 798. Conger, S. A. 1994. The New Software Engineering. CA: Wadsworth Publishing. Gleason, J. M. 1991. Fuzzy set computational process in risk analysis. IEEE Trans. Enrgr. Manage. 38s 2.: 177-178. Kangari, R., and L. S. Riggs. 1989. Construction risk assessment by linguistics. IEEE Trans. Enrgr. Manage. 36s 2.: 126-131. Kaufmann, A., and M. M. Gupta. 1988. Fuzzy Mathematical Models in Engineering and Management Science. Amsterdam: North-Holland. Kaufmann, A., and M. M. Gupta. 1991. Introduction to Fuzzy Arithmetic Theory and Application s. New York: Van Nostrand Reinhold. Lee, H. M. 1996. Applying fuzzy set theory to evaluate the rate of aggregative risk in software development. Fuzzy Sets and Systems 79s 3.: 323-336. Martyn Ould, Strategies for Software Engineering: The Management of Risk and Quality, Chichester, England, John Wiley & Sons, 1990. Marvin J. Carr, Suresh L. Konda, Ira Monarch, F. Carol Ulrich, Clay F. Walker, Taxonomy –Based Risk Identification, CMU/SEI-93-TR-006, Pittsburgh, PA, Software Engineering Institute, 1993. Schmucker, K. J. 1984. Fuzzy Sets, Natural Language Computations, and Risk Analysis. Rockville, MD: Computer Science Press.
Print-ISSN: 2231-2048 e-ISSN: 2231-0320 © RG Education Society (INDIA)
[19]. [20].
[21]. [22].
[23].
[24].
[25].
[26].
[27].
[28].
Tom Gilb, Principles of Software Engineering Management, Wokingham, England: Addison-Wesley, 1988. Yu, P. 1993. Modelling Cost and Risk for Software Information System. Master Work. National Defence College, Taiwan, R.O .C. Zadeh, L. A. 1965. Fuzzy sets. Inform. Control 8:338-353. Zimmermann, H.-J. 1991. Fuzzy Set Theory and Its Applications. Boston: Kluwer Academic Publishers. L.A. Zadeh, Fuzzy sets, Information and Control 8 (1965) 338–353 Lin, Lily, Huey-Ming Lee, Shu-Yen Lee, and TsungYen Lee. "Fuzzy evaluation for the rate of aggregative risk in software development." In Proceedings of the 6th WSEAS International Conference on Applied Computer Science, Hangzhou, China, pp. 43-47. 2007. Team, Trinity. "Software Project Management Plan." Evolution (2012). Lee, Huey-Ming, and Lily Lin. "Fuzzy evaluating the rate of aggregative risk in software development." Machine Learning and Cybernetics (ICMLC), 2010 International Conference on. Vol. 5. IEEE, 2010. Bansal, Kulbhushan, and Harish Mittal. "Analysis and Evaluation of Software Aggregative Risk Using Soft Computing Techniques." Advanced Computing & Communication Technologies (ACCT), 2014 Fourth International Conference on. IEEE, 2014. Lima, O.S.J., Farias P.P.M. and Belchio A.D., “A Fuzzy Model for Function Point Analysis to Development and Enhancement Project Assessments”, CLEI Electronic Journal, Volume 5: Number 2, January 2002. Leekwijck, W. V., Kerre, E. E., Defuzzification: criteria and classification, Fuzzy sets and systems, 108, 2, 159178, 1999. Gupta, Deepak, Harish Kumar Mittal, and Vinay Goyal. "Comparative Study of Soft Computing Techniques for Software Quality." International Journal of Software Engineering Research and Practices 1.1 (2011): 33-37. Gupta, Deepak, Vinay Kr Goyal, and Harish Mittal. "Analysis of clustering techniques for software quality prediction." 2012 Second International Conference on Advanced Computing & Communication Technologies. IEEE, 2012. Gupta, Deepak, Vinay Kr Goyal, and Harish Mittal. "Estimating of Software Quality with Clustering Techniques." Advanced Computing and Communication Technologies (ACCT), 2013 Third International Conference on. IEEE, 2013.
5