condition and the extent of security violation was represented by a severity function. ... Key words: generalized regression neural network; line overload; low voltage; principle component ..... 5 Procedure for transmission line outage screening ...
J. Cent. South Univ. (2013) 20: 466–479 DOI: 10.1007/s11771-013-1508-9
Risk based security assessment of power system using generalized regression neural network with feature extraction M. Marsadek, A. Mohamed 1. College of Engineering, Universiti Tenaga Nasional, Selangor 43000, Malaysia; 2. Faculty of Engineering and Built Environment, Universiti Kebangsaan Malaysia, Selangor 43600, Malaysia © Central South University Press and Springer-Verlag Berlin Heidelberg 2013 Abstract: A comprehensive risk based security assessment which includes low voltage, line overload and voltage collapse was presented using a relatively new neural network technique called as the generalized regression neural network (GRNN) with incorporation of feature extraction method using principle component analysis. In the risk based security assessment formulation, the failure rate associated to weather condition of each line was used to compute the probability of line outage for a given weather condition and the extent of security violation was represented by a severity function. For low voltage and line overload, continuous severity function was considered due to its ability to zoom in into the effect of near violating contingency. New severity function for voltage collapse using the voltage collapse prediction index was proposed. To reduce the computational burden, a new contingency screening method was proposed using the risk factor so as to select the critical line outages. The risk based security assessment method using GRNN was implemented on a large scale 87-bus power system and the results show that the risk prediction results obtained using GRNN with the incorporation of principal component analysis give better performance in terms of accuracy. Key words: generalized regression neural network; line overload; low voltage; principle component analysis; risk index; voltage collapse
1 Introduction Power system operation is becoming more complex than earlier due to financial and environmental constraints that limit the expansion of transmission network. Therefore, the existing transmission networks need to be fully utilized and always required to transmit power at capacities close to their limits in order to provide greater profit without compromising the security of the power system. This scenario has resulted in a more highly stressed and unpredictable operating conditions, more vulnerable power network and an increased need to monitor the security level of the transmission system [1]. Power system security refers to the degree of risk in its ability to survive imminent contingencies without interruption of customer service. Among the factors, system operating condition and probability of contingency can affect the security of power systems [2–5]. In a power system, any contingency resulting in line overload, low voltage or voltage collapse may occur for a number of reasons at any time. The effect of less severe contingency may be compromised, but it may endanger a power system if the occurrence rate is high.
Several recent major blackouts reported in Denmark, Sweden, Italy and United Kingdom have shown that deterministic security margin does not always prevent customer outage and system collapse [5]. The occurrence of faults, failures and equipment malfunction is unpredictable and unavoidable. Due to this uncertainty, deterministic approach that has been used for many years is no longer applicable because it provides only a limited perspective on the actual level of security of a power system [6–8]. The deterministic approach is conceptually simple and easy to implement but it has significant drawbacks due to the fact that it gives highly conservative decisions and the effects of less severe operating conditions are neglected [9–10]. Furthermore, the deterministic approach does not provide information on the current operating condition and the extent of security violation, but only provides binary information as to whether the current operating condition is secure or insecure [7, 11]. To allow power system to operate closer to its limits, a more refined and realistic security assessment method is required at the planning and operating stage. Risk based security assessment (RBSA) is a probabilistic technique that evaluates the power system’s
Received date: 2012–04–23; Accepted date: 2012–08–06 Corresponding author: A. Mohamed; Tel: +603–89216006; Fax: +603–89202314; E-mail: azah@eng. ukm. my
J. Cent. South Univ. (2013) 20: 466–479
ability to deal with various contingencies. The risk index computed from RBSA technique quantitatively measures the degree of risk of a given operating condition and can be used to assess the system security level as a function of existing or near-future network conditions. RBSA is considered as a refined security assessment method that takes into account the probabilistic nature of many uncertain variables and the extent of security violations. Severity function is used to evaluate the extent of security violation. There are three types of severity functions, namely, discrete, continuous and percentage of violation severity function that can be adopted for the assessment of risk of low voltage and line overload [1]. The selection of severity function in RBSA is an important issue since it represents the extent of security violation. In voltage collapse, the extent of violation is usually represented by percentage of loading margin which can be determined using the forecasted load and loadability obtained from continuation power flow [1]. A good severity function should reflect the consequence of contingency and loading condition, simple, reflect relative severity between different problems and measure the extent of violation [1]. Based on these criteria, a new severity function for voltage collapse considering voltage collapse prediction index (VCPI) is developed. The existing online RBSA methods are developed by using the outputs of post-contingency power flow simulations which require extensive computational burden [12–14]. For that reason, a faster and accurate method for RBSA using artificial intelligent (AI) techniques is needed to be developed in order to overcome the drawbacks of the existing technique. The application of AI based techniques in power systems has gained lots of interests due to its robustness and ability to perform complex analytical process. However, only little application of AI can be seen in the RBSA. An AI technique using neural network ensemble (NNE) has been developed for assessing the risk of low voltage measurements [14]. In the NNE implementation, for quantifying the risk of low voltage within an acceptable error margin, bus voltage magnitudes at all the buses in the system are required as the NNE inputs. This technique is considered not very efficient for fast online RBSA because power flow simulation for every contingency must be first executed successively prior to the computation of risk. Furthermore, the implementation of NNE only provides the risk of a contingency but not the cumulative risk. The probabilistic risk of voltage collapse using the radial basis function network by calculating the probability of collapse without taking into account the severity of voltage collapse was developed in Ref. [12]. Online voltage collapse risk quantification using fuzzy techniques that was developed in Ref. [13]
467
did not take into account the probabilistic nature of power system operation. To achieve a fast risk assessment of voltage collapse that considers the likelihood of the triggering event as well as its severity, AI techniques that can perform parallel data processing with high accuracy and fast response times must be applied. In this research work, the generalized regression neural network (GRNN) is used to predict the risk of low voltage, line overload and voltage collapse for a given operating point of a large sized and practical power system. To select the critical transmission line outage, a new contingency screening method is proposed using the risk factor which takes into account the probability and the extent of violation. If a large number of inputs features are used, the size of the GRNN will increase, and hence the training process will be extremely slow. To reduce the training time and improve the accuracy of risk prediction by GRNN, feature extraction technique using principal component analysis (PCA) is employed due to its simplicity in application and its ability to show the strength of the transformed reduced features in improving the accuracy of the AI techniques.
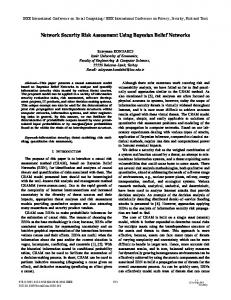
2 Risk-based security assessment framework In this work, the implementation of RBSA includes risk of low voltage, line overload and voltage collapse. The comprehensive RBSA framework proposed in this work is shown in Fig. 1. Contingency screening is performed to quickly identify those critical contingencies which may cause security violation so as to reduce the number of contingencies that need to be analyzed by full AC power flow. In critical contingency analysis stage, full AC power flows are performed to evaluate the severity of security violation. The probability of each contingency in the contingency list is estimated by considering the weather condition. The severity of a contingency is calculated based on the type of security violations which are low voltage, line overload and voltage collapse. Severity function is adopted to uniformly quantify the severity of network performance for low voltage, line overload and voltage collapse. The calculation of risk of contingency is then performed by multiplying the probability and severity of contingency. The risk index of a given operating condition is obtained by summing all risk of contingencies listed in the contingency list. 2.1 Probability estimation Under the scope of this work, only uncertainty in the transmission line outage is considered. To compute the probability of transmission line outage, a probability model characterizing the random process associated with the transmission line outage is assumed. Transmission
J. Cent. South Univ. (2013) 20: 466–479
468
Therefore, the probability for a transmission line to fail at least once in the given time interval can be derived as follows: Pr ( F ) P (0 x ) FX FX 0 1 P( x 0) 1 e
(3)
In a transmission network, with a total of N lines, the probability for N-1 contingency can be derived as follows:
Pr ( Ei ) Pr F1 F2 Fi FN N
Fig. 1 Comprehensive RBSA framework
j i
line outage is a weather dependent event, and therefore the effect of weather is considered in developing the probability model of transmission line outage. The parameter that characterizes the probability model of transmission line is known as failure rate. The likelihood of transmission line outage is influenced by weather condition. Therefore, the failure rate of each line with respect to weather condition should be used in order to capture the influence of weather so as not to underestimate the risk of security violation. For a given weather condition, the failure rate of each transmission line with respect to weather is used to compute the probability of transmission line outage. The probability of transmission line outage that can cause security violation is termed as event likelihood and it is assumed to follow the Poisson process characteristic [7, 15]. The Poisson process counts the arrival of an event within a pre-defined time interval. The probability model of a Poisson random variable describes a phenomenon that occurs randomly in time, while the time of each occurrence is completely random and the average number of occurrences per unit time is known [16]. The probability distribution function of a Poisson process is given by P ( x)
x e x!
Pr Fi Pr F j
1 e e
i
j j i
The failure rate, λ, of each transmission line is used to compute the probability of transmission line outage. 2.2 Severity function A good severity function should reflect the consequence of contingency and loading condition, simple, reflect relative severity between different problems and measure the extent of violation [1]. Severity function is adopted to uniformly quantify the extent of security violation. 2.2.1 Continuous severity function for low voltage The severity function for low voltage is defined specific to each bus. The voltage magnitude of each bus determines the low voltage severity of that bus. A power system operating at the lower voltage would require excessively high current to produce the power. In a power network, the magnitude of bus voltage should be maintained within ±5% of its nominal value. The bus voltage is considered to operate in low voltage if the magnitude is less than 0.95 per unit. The continuous severity function for low voltage is illustrated in Fig. 2. At each bus, the severity function evaluates to 1 at the deterministic limit of 0.95 per unit and increases linearly
(1)
where λ is the failure rate per unit time and x is the number of occurrence per unit time. The probability for a particular transmission line to fail at least once in a given time interval can be calculated by using the cumulative distribution function. The cumulative distribution function estimates the probability that the random variable “x” is not larger than “a” and it is given by [16] FX x P ( x a)
(2)
(4)
Fig. 2 Continuous severity function for low voltage
J. Cent. South Univ. (2013) 20: 466–479
469
as the voltage magnitude decreases. The bus voltage magnitude is at the near violating region of low voltage if its magnitude is between 0.95 to 1.0 per unit. 2.2.2 Continuous severity function for line overload An excessive line flow may cause a transmission line to loss clearance due to sag and loss of its strength during annealing process [9]. The thermal expansion of a conductor in an overloaded transmission line results in sag and the line may touch an underlying object causing a permanent fault and subsequent outage. Annealing is a recrystallization of metal, and the process is gradual and irreversible when the grain matrix established by cold working is consumed and causes loss of tensile strength. The power flow as a percentage of rating of each transmission line determines the line overload severity. The severity function for line overload is defined specific to each branch. The ratio of power flow, Lflow to line rating, Lrating, at each line, determines the overload severity. The ratio of power flow, RP, for each line, is defined as RP
Lflow Lrating
(5)
A transmission line is considered overload if the ratio of power flow exceeds 1.0. The continuous severity function of line overload is illustrated in Fig. 3. At each branch, the severity function equals 1 at the deterministic limit and increases linearly as line flow exceeds the limit. The line flow at a branch is at the near violating region of line overload if the RP is between 0.9 and 1.0.
illustrated in Fig. 4. Loadability is defined as the maximum allowable load, while the load margin quantifies the permissible load increment before a voltage collapse takes place. If the load margin is less than zero, a voltage collapse will occur in a given contingency state for a particular operating condition. The continuation power flow technique is required if the severity of voltage collapse is evaluated using the load margin.
Fig. 4 Concept of loadability and load margin
In this work, a severity function based on the voltage collapse prediction index (VCPI) is proposed because the consequences are easily understood in terms of network parameters and it only requires information obtained from the AC power flow. In addition, it also reflects the relative severity of different problems, which enables a composite risk index to be calculated. VCPI is calculated at every bus using the voltage phasor measurement and network admittance matrix and it is given by the following relationship [17]. NB
Vm
I VCP 1
m 1 mk
Vk
(7)
where IVCP is the voltage collapse prediction index, NB is the number of buses, V'm is given by Vm
Fig. 3 Continuous severity function for line overload
2.2.3 New severity function for voltage collapse The percentage of loading margin is the commonly used index to quantify the severity of voltage collapse. It is defined as the percentage difference between the load and loadability, and is expressed as mL
La L L
(6)
where mL is the load margin, La is the loadability, L is the load. The concept of loadability and load margin is
Ykm NB
Ykj
Vm
(8)
j 1 jk
where Vk is the voltage phasor at bus k, Vm is the voltage phasor at bus m and Ykm is the admittance between buses k and m. If IVCP is zero, the bus is considered voltage stable, and if IVCP is one, a voltage collapse occurs. The IVCP is zero when no load is assigned to the load bus. Table 1 gives the variation of VCPI value with respect to the load margin.
J. Cent. South Univ. (2013) 20: 466–479
470
From Table 1, it is noted that IVCP is between 0 to 1 if the assigned load is less than the loadability. If the assigned load to the load bus exceeds the loadability, a voltage collapse will take place. The bus with the largest VCPI value is the weakest bus in the network. Therefore, the severity function due to transmission line outage leading to voltage collapse utilising the VCPI index is defined as SSE,VC Ei max I VCP1 , I VCP2 , , I VCP M
(9)
where M is the number of buses in a power system. Table 1 Variation of VCPI with respect to load margin Load
Load margin
IVCP
Load < Loadability
Loadability – Load > 0
0 < IVCP < 1
Load > Loadability
Loadability – Load < 0
IVCP = 1
2.3 Contingency screening For large power system network, that is complex and highly interconnected, great number of possible transmission line outages may occur. Hence, an exhaustive power flow analysis is required in order to assess the security of a power system due to a long list of possible transmission line outages. To reduce the computational burden, transmission line outage screening is performed to quickly identify and filter out the critical transmission line outages which may cause security violation. Most of the previous contingency screening methods are based on performance index, in which a contingency is screened and ranked according to the index values and its severity towards security violation [18–20]. A transmission line outage is considered critical if the impact towards security violation is greater than zero. However, if the probability of the transmission line outage is low, then the risk resulting from this contingency becomes relatively small, and in some cases it can be neglected [21]. In this RBSA study, transmission line outage screening based on the risk factor is considered. The risk factor takes into consideration the probability of transmission line outage and its severity towards security violation so as to prioritize those transmission line outages which are reasonably severe as well as more probable. To screen the critical transmission line outages, the probability of transmission line outage and the severity of low voltage, line overload and voltage collapse at base case condition must first be computed. The probability and severity values have to be normalized between 0.1 and 0.9 using the following general equation [22]. zi zi min xi 0.1 0.9 0.1 max z zi min i
(10)
max
where x i is the normalized value of z i , and zi and min zi are the maximum and minimum values of z i in the database. The normalized values of probability of transmission line outage and its severity are then classified into low, medium or high. Tables 2 and 3 depict the classification of probability of transmission line outage and severity function value respectively. Each class in the probability of transmission line outage is assigned a probability factor value of 1, 2 or 3 corresponding to low, medium or high probability of occurrence correspondingly. Similarly, each class in the severity function value is assigned a severity factor value. Pr, norm is the normalized probability of transmission line outage and VSE, norm is the normalized severity function value. Table 2 Classification of probability of transmission line outage Range
Class
Probability factor
0.1Pr, norm0.36
Low (L)
1
0.36Pr, norm0.62
Medium (M)
2
0.62Pr, norm0.9
High (H)
3
Table 3 Classification of severity function value Range
Class
Severity factor
0.1VSE, norm0.4
Low (L)
1
0.4VSE, norm0.8
Medium (M)
2
0.8VSE, norm0.9
High (H)
3
The risk factor of a transmission line outage is calculated using Fr=F p×F s
(11)
where Fr is the risk factor, Fp is the probability factor, Fs is the severity factor. Table 4 shows all the possible risk factor values associated with probability factor and severity factor. A transmission line outage is classified as critical if its risk factor value is greater than 1. A risk factor of 1 is chosen as the threshold for critical and non-critical contingency since the risk resulting from a transmission line outage with a risk factor of 1 is relatively small. This is due to the fact that the transmission line outage is a rare event and its probability is usually in the range of 10–7 to 10–5, and the severity of a security violation can be as small as 10–2, thus by multiplying a low probability event with low severity of security violation, the risk of transmission line outage will become even smaller. Therefore, the risk of transmission line outage with low probability of occurrence and low severity of security violation can be
J. Cent. South Univ. (2013) 20: 466–479 Table 4 Risk factor values associated with probability factor and severity factor Probability factor Severity factor Risk factor 1 (L) 1 1 2 (M) 2 (L) 3 (H) 3 1 (L) 2 2 2 (M) 4 (M) 3 (H) 6 1 (L) 3 3 2 (M) 6 (H) 3 (H) 9
discarded since its risk is insignificant. Therefore, only transmission line outage with significant contribution to the risk index is considered for further analysis. The screening of each transmission line outage into critical and non-critical with respect to low voltage, line overload and voltage collapse are performed and the lists of critical transmission line outage with respect to each security violation are then developed. The flowchart shown in Fig. 5 shows the procedure for the proposed
Fig. 5 Procedure for transmission line outage screening
471
transmission line outage screening method. From Fig. 5, the estimated probability of transmission line outage is classified into L, M or H according to the classification given in Table 2. Depending on the type of security violation considered, the severity of a transmission line outage is computed and classified into L, M or H according to the classification table given in Table 3. Then, the risk factors of each transmission line outage towards low voltage, line overload and voltage collapse are computed. The transmission line outage is considered critical if the risk factor is greater than 1. The critical transmission line outages associated with low voltage, line overload and voltage collapse are stored in each respective contingency list. These procedures are carried out for all transmission line outages considered in the work. 2.4 Risk calculation Risk index of a given operating condition is evaluated by summing all risks of critical transmission line outage. Therefore, risk of critical transmission line
J. Cent. South Univ. (2013) 20: 466–479
472
outages with respect to low voltage, line overload and voltage collapse needs to be first computed at any given operating point. The risks of critical transmission line outages associated with low voltage, RLV(Ei), line overload, RLO(Ei), and voltage collapse, RVC(Ei), consist of two elements, which are the probability and severity of low voltage, line overload and voltage collapse, respectively, and are given by RLV Ei Pr Ei VSE Ei
(12)
RLO Ei Pr Ei VLO Ei
(13)
RVC Ei Pr Ei VVC Ei
(14)
target vector. The output of the dot product operation is then passed on to a special linear layer, whose transfer function is shown in Fig. 8. From Fig. 8, n2 is the output of the radial basis layer or in this case is equal to a1 . The linear transfer function, f(x) can be written in the following form f x purelin n2
(16)
where Pr Ei is the probability of critical transmission line outage, and
SSE, LV Ei ,
SSE, LO Ei
and
SSE,VC Ei are the severity of low voltage, line
overload and voltage collapse, respectively.
3 Generalized regression neural network (GRNN) GRNN has the ability to draw the function estimates directly from a given training data. The GRNN structure shown in Fig. 6 comprises of two layers, namely, radial basis and special linear layers. The input neurons are made up of p neurons and a bias vector b where p is the dimension of input vector x and b is a column vector whose elements are set to 0.8326/Vspread, where Vspread is a user defined parameter which is always determined by trial and error and it measures the distance of an input vector which must be from a neuron’s weight vector with value 0.5 [23]. All the input units are fully connected to the neurons in the radial basis layer. The input neurons receive the input vector and produce a distance vector between the input and its weight vector, w, by using the Euclidean distance weight function, d . Then, the distance vector is passed through the radial basis layer and adjusted by the bias. The radial basis layer is made up of radial basis neuron whose transfer function is shown in Fig. 7 and mathematically described by
a1 exp n12
Fig. 6 Network structure of GRNN in MATLAB toolbox
Fig. 7 Radial basis function
(15)
where n1 is the output from the input units. A pattern neuron is used to combine and process the data in a systematic fashion such that the relationship between the input and the proper response is “memorized”. The radial basis layer receives input from the input units and produces output that has a maximum of one when the input is zero. Dot product operation is then performed between the output of the radial basis layer and weight vector W2,1, where W2,1 equals the
Fig. 8 Linear transfer function
4 Feature extraction based on principal component analysis The main objective of feature extraction is to reduce the dimension of the input feature without losing the main information represented by the original input data.
J. Cent. South Univ. (2013) 20: 466–479
473
In feature extraction, the basic idea is to discard the data that are repetitive in nature, and to choose only the data components with maximum information with regards to the different variations of the whole set of input data. Principle component analysis (PCA) is one of the most widely used feature extraction techniques. PCA is a mathematical procedure that transforms a multivariate data set into a smaller number of uncorrelated variables known as principle components [24]. The original data are projected into a space such that variances of the variables are maximum along the coordinates of the transformed space [25]. The principle components whose variances are very small can be removed from the input data set, since they do not contain much information on the variation of the data set. The transformation of the input data set into a smaller dimension by using PCA involves orthogonalizing the component of the input vector so that they become uncorrelated with each other. Then, the principle components are arranged such that principle component with the largest variation come first, while those components with small variations are eliminated since they contribute the least to the variation in the data set. The procedure of PCA mainly consists of four steps and are described as follows. Step 1: Normalize the original data set to prevent any parameter from dominating the output value. xij *
xij x j
(17)
j
where xij * is the normalized value of x ij , x j and
j
are the mean and variance of a data set, respectively.
The data matrix X, consists of m variables and N data set where the mean and variance of each data set are given by 1 N
xj
j
N
xij
(18)
i 1
1 N xij x j N 1 i 1
2
(19)
Step 2: Calculate the correlation matrix R and determine the eigenvalues of R and their corresponding eigenvectors. Matrix R is given by R
1 (X * )T X * N 1
(20)
where X* is the normalized data matrix. The eigenvalues of R are arranged as follows 1 2 p m and their corresponding eigenvectors are u1 u2 u p um . Step 3: Calculate the accumulated contribution of variance by using
p
k
(21)
k 1
where p is the number of principle components retained for further analysis and k is the variance of each principle component and is given by
k
k m
l
100
(22)
l 1
Step 4: Compute the principle component by using Z N p X * N mU m p
(23)
where Um×p is the first p columns of the eigenvector matrix. The number of principle components depends on the accumulated contribution of variance. The principle components with accumulated variance greater than 85% are retained as most information of the original variables is included [24]. In this work, the accumulated variances of 85% and 90% are chosen and their performances are compared so as to select the number of optimum principle components. PCA is performed on the original input data set by using the MATLAB toolbox.
5 Implementation of GRNN for risk-based security assessment of a power system The GRNN is applied for prediction of risk index associated with low voltage, line overload and voltage collapse. Sufficiently large numbers of training samples have been generated prior to the implementation of the GRNN to ensure good generalization ability. The input and its corresponding output data is generated by varying the loading pattern within reasonable limits. For every load pattern, the severity associated with low voltage, line overload and voltage collapse of each critical transmission line outage is computed. To determine the severity function value, voltage magnitudes at all buses and power flows for all lines subjected to transmission line outages need to be examined. For the purpose of performing line outage simulations, the Power System Analysis Toolbox (PSAT) is used [26]. In this work, a database consisting of bus voltages and power flows at various loading conditions is developed. To calculate the probability of critical transmission line outage, the weather condition experienced by each transmission line is randomly assigned. Then, for each load pattern, various combinations of weather are generated. Once the input data has been generated, feature extraction based on PCA is applied so as to reduce the number of input features. In this work, the accumulated variances of 85% and 90% are chosen and their performances are compared so as to select the number of
J. Cent. South Univ. (2013) 20: 466–479
474
optimum principle components. A quarter of the data sets are randomly selected for testing purposes, and the remaining data are selected for training the GRNN. 5.1 Selection of input and output features The selection of input features is an important factor to be considered in the implementation of GRNN. A large number of input features increases the complexity of the GRNN model, thus slows down the training process. Hence, it is essential to select input features which are able to clearly define the input and output mappings. For the developed GRNN, the load assigned to each load bus and the weather condition experienced by transmission line are selected as input features and the risk index value for low voltage, line overload and voltage collapse is the output variable. Transmission lines with more than one tie line will experience the same weather type since they are positioned at the same geographical location; and therefore, only single weather type is considered. The input and output variables for the implementation of RBSA using GRNN are summarized as in Table 5. Table 5 Input and output variables for implementation of RBSA using GRNN Variables
Input variables
Output variables
Description
Number of features
Load assigned to each load bus
Number of load buses
T is the sum of number of Weather type single line, number of double experienced by each lines and number of transmission line quadruple lines Risk index
1
5.2 Normalization of data To have a more accurate prediction result, the input and target data need to be represented in a normalized form ranging between zero and one. This prevents any parameter from dominating the output value and also provides better convergence and accuracy of the learning process. The normalization procedure is performed using dk
d k d k ,min d k ,max d k ,min
(24)
where dk, d'k, dk,min and dk,max represent the normalized value, raw input or target value, minimum and maximum values of the respective features, respectively. 5.3 Performance measure To evaluate the effectiveness of the GRNN, the mean average error (EMA), mean square error (EMS) and root mean square error (ERMS) are considered and given
as T
yq f q ( x ) q 1
EMA
(25)
T T
yq f q ( x ) EMS
2
q 1
(26)
T T
yq f q ( x ) ERMS
2
q 1
T
(27)
6 Results and discussion In this section, the results obtained from the RBSA of a power system using GRNN with and without incorporation of feature extraction technique are presented. 6.1 Test system description The practical 87-bus power transmission network which is the Malaysian transmission network at a voltage level of 275 kV is used to demonstrate the effectiveness of the proposed method. The network comprises of 54 load buses and lines of types 57 single, 54 double and 3 quadruple lines. The total real and reactive load power at base case condition is 10 920 MW + j 2 420 MVar. All lines in the test system are represented by three failure rates which correspond to clear, cloudy and rainy weather condition, respectively. 6.2 Results of critical transmission line outage screening To validate the effectiveness of the proposed line outage screening method, a comparison is made between the proposed screening method and the screening based on the severity of transmission line outage. The proposed screening method considers the risk factor threshold value of 1 in which a transmission line outage is considered critical if its risk factor value is greater than 1. From the severity based screening method, a transmission line outage is classified as critical if its PI is greater than the PI base case. The PI is calculated based on the continuous severity function associated with security violation. To reduce the computational burden in RBSA, the critical transmission line outage list is developed for low voltage, line overload and voltage collapse, respectively. For this test system, there exist a total of 114 (57+54+3) “N–1” line outages, however, only 107
J. Cent. South Univ. (2013) 20: 466–479
475
transmission line outages are considered, since the remaining seven transmission line outages result in the divergence of the power flow solution. At a particular time and load condition, a power system consisting of N transmission lines with possible weather condition of fine, cloudy or rainy, there exist 3N possible weather combinations. For example, if N is equal to 2, the number of possible weather combination is 9. To develop the probability factor of transmission lines for the practical 87-bus power system, 100 random weather combinations experienced by the transmission lines are generated and the result revealed that the probability factor of each transmission line outage for the 100 weather combinations is always consistent regardless of the weather combination. Line outage screening associated with low voltage using the PI method for the practical 87-bus power system is based on the base case PI value of 6.39 in which a transmission line outage is critical if the PI value is greater than the base case PI value. Based on the PI method, a total of 91 transmission line outage events are classified as critical lines towards low voltage. Using the proposed line outage screening method, the result of critical transmission line outages that caused low voltage shows a reduction in the number of identified critical lines, in which out of the 107 transmission line outages considered, only 46 line outages give risk factor value greater than 1, as a consequence these line outages are deemed to be critical from the low voltage perspective. The proposed screening method based on the risk factor identifies the critical line outage by considering the probability and severity of a transmission line outage. On the other hand, transmission line outage screening performed based on the PI value results in unnecessary computational burden since the transmission line outage that is supposed to be critical from the severity point of view may have a low probability factor, hence the risk resulted from this line outage is rather small. Due to space limitation, only some of the critical line outages
event obtained using PI and proposed method is shown in Table 6 where “NC” represents non-critical line outage and “C” signifies the critical line outage. For example, the risk associated with line outage of line connecting bus 2118 to bus 2119 is only 0.000 3 (Table 6), and it is identified as critical line outage based on the PI method but non critical according to the risk factor value. By considering only line outage that has significant risk contribution in RBSA, the proposed screening method is able to reduce the computation of power flow for all line outages without underestimating the risk of low voltage. For transmission line outage screening associated with line overload, only line outage that is considerably severe with PI > 0, is identified as critical line outage using the PI technique without considering the probability of occurrence. Transmission line outage screening based on risk factor does not only capture the severity of a line outage but it also consider uncertainty in the occurrence of line outage in which line outage that is likely to occur (probability factor > 1) and reasonably severe (severity factor > 1) is classified as critical line outage. Risk is a product of probability and severity, and therefore for transmission line outage screening in RBSA study, besides severity of line outage, the probability of occurrence should also be taken into consideration. The proposed screening method does not only screen line outage with medium and high severity value but it also screens line outage with medium and high probability of occurrence to be considered in RBSA. Table 7 gives some of the critical line outage associated with line overload obtained using the PI and the proposed contingency screening methods. Table 8 shows some of the critical line outage associated with voltage collapse obtained using the PI and the proposed contingency screening methods. Risk based voltage collapse assessment requires an exhaustive power flow analysis, and to reduce the computational effort, transmission line outage screening is performed in order to shortlist only the critical line outages. The PI based screening method
Table 6 Critical line outage associated with low voltage Line outage From bus 2 118 62 72 2 526 2 414 2 636 2 740 2 436 2 467
To bus 2 119 2 276 2 340 2 552 2 602 2 880 2 956 2 740 2 662
PI
Fr
Risk/10–5
6.52 6.8 6.88 6.39 6.39 6.4 7.82 6.46 6.47
1 2 1 2 2 1 1 1 1
0.003 2.983 0.099 2.733 2.018 0.077 0.061 0.051 0.034
Method PI method C C C NC NC C C C C
Proposed method NC C NC C C NC NC NC NC
J. Cent. South Univ. (2013) 20: 466–479
476
only considers the severity of a line outage with respect to voltage collapse in which only line outage with PI value greater than 0.05 is identified as critical. But some of the line outages that have greater impact on the power system may have very low probability occurrence. For example, based on the result presented in Table 8, line outages for lines connecting bus 73 to bus 2 340 and bus 2 740 to bus 2 956, having PI values greater than 0.05, are classified as critical using the PI method but non critical based on the proposed method, but the probability of occurrence are low and as a consequence, the risk of voltage collapse associated with these line outages are moderately small. 6.3 Performance evaluation of GRNN for 87-bus power system In the development of the GRNN, real load and weather condition data are used and selected as input variables and the risk of low voltage, risk of line overload and risk of voltage collapse are the output variables. Numerical values of 1, 2 and 3 are assigned to represent fine, cloudy and rainy weather conditions,
respectively. Table 9 summarizes the selected input features in which the total number of input features is 161. For prediction of risk of low voltage and line overload, sufficiently large numbers of training and testing data sets have been generated prior to the training of the GRNN to ensure good generalization ability. To calculate the severity of security violation, the data sets consist of bus voltages and line flows at various load conditions. The selection of the training data sets is made randomly. For training and testing purposes, the input and output data are normalized between zero and one. Table 10 gives the number of training and testing samples used in predicting the risk of low voltage, line overload and voltage collapse using the GRNN. Initially, the number of input features selected for predicting the risk of low voltage, line overload and voltage collapse is 161, but after feature extraction using PCA, the number of input features corresponds to risk of low voltage, line overload and voltage collapse are reduced as given in Table 11. The number of principle components is selected based on the total variance
Table 7 Critical line outage associated with line overload Line outage
PI
Fr
Risk/10–5
From bus
To bus
62
2 276
0
2
62
2 602
0
62
2 704
72
Method PI method
Proposed method
0
NC
C
1
0
NC
NC
0
1
0
NC
NC
2 338
4.92
2
0.367
C
C
72
2 340
4.88
2
0.07
C
C
72
2 554
0
1
0
NC
NC
73
2 338
4.92
2
0.111
C
C
73
2 340
4.88
2
0.284
C
C
73
2 554
0
1
0
NC
NC
Table 8 Critical line outage associated with voltage collapse Line outage
PI
Fr
Risk/10–5
From bus
To bus
73
2 340
0.06
1
73
2 554
0.05
2 016
2 636
2 016
Method From bus
To bus
0.033
C
NC
1
0.067
NC
NC
0.07
2
0.225
C
C
2 652
0.06
3
0.225
C
C
2 072
2 706
0.05
2
0.219
NC
C
2 118
2 119
0.06
1
0
NC
NC
2 740
2 956
0.06
1
0.05
C
NC
2 118
2 722
0.05
3
0.325
NC
C
2 119
2 130
0.07
1
0.148
C
NC
J. Cent. South Univ. (2013) 20: 466–479
477
percentage of approximately 85% and 90%. To attain good generalization accuracy in the implementation of GRNN, the Vspread is adjusted heuristically. To select the optimum parameters for GRNN, training process are carried out using different parameters values and their accuracies are evaluated in terms of EMA, EMS and ERMS. Table 9 Selected input features for GRNN Feature description
Number of features
MVA load at 54 load buses
54
Weather condition at 107 transmission lines
107
Table10 Number of training and testing samples generated Risk prediction
Number of features Training
Testing
Low voltage
504
126
Line overload
504
126
Voltage collapse
733
367
The MATLAB toolbox is used to implement the GRNN. The performance evaluations of the GRNN used in predicting the risk of low voltage, line overload and voltage collapse with and without PCA are tabulated as shown in Tables 12, 13 and 14, respectively. The evaluation of prediction performance of GRNN in risk assessment of low voltage given in Table 12 indicates that the best accuracy is obtained when Vspread is adjusted to 0.10. In terms of the performance measure, the GRNN incorporating feature extraction based on PCA which retained 23 principle components with a total variance of 85% provides the lowest EMA (0.009 7), EMA (0.000 35) and ERMS (0.018 66). Out of the 126 samples used in validating the developed GRNN model with feature extraction that retained a total variance of 85%,
31 yields zero absolute error. The performance of the developed GRNN in predicting the risk of line overload with original input features given in Table 13 proved that the best accuracy is obtained when Vspread is tuned to 0.1. Comparing the result of the GRNN without PCA and with PCA given in Table 13, it is noted that the overall accuracy of the employed PCA that considers 85% of total variance is better than the performance of the developed GRNN without PCA. The lowest performance measures in terms of EMA (0.008 54), EMS (0.000 31) and ERMS (0.017 66) of the developed GRNN is attained when the feature extraction based on PCA takes into account 28 principles components with a total variance of 90%. Based on the result of the developed GRNN with or without PCA shown in Table 13, it is appropriate to employ GRNN with PCA in predicting the risk of line overload because it gives more accurate result. The testing result of risk prediction for line overload obtained using PCA based GRNN with reduced input features from 161 to 28 features shows that out of 126 testing samples, 28 samples yields zero absolute error. In order to attain good generalization ability for the GRNN in predicting the risk of voltage collapse, the Vspread is adjusted to 0.1. The GRNN results with and without PCA given in Table 14 prove that better accuracy is obtained when using PCA in which the values of EMA, EMS and ERMS are 0.011 93, 0.000 67 and 0.025 88, respectively. However, increasing the total percent of variance in the risk voltage collapse prediction does not show improvement in accuracy. Thus, GRNN with PCA that retained 48 principle components which account for a total of 85% variance considered the best model in predicting the risk of voltage collapse. Out of 367 data used to validate the developed GRNN with 48 principle components, only 138 data result in nonzero prediction error.
Table 11 Reduced input features for GRNN using PCA in low voltage, line overload and voltage collapse risk prediction Number of input features Feature extraction Total variance/% Risk of low voltage Risk of line overload Risk of voltage collapse Without PCA — 161 161 161 85 23 23 48 With PCA 90 28 28 59 Table 12 Performance evaluation of GRNN used in predicting risk of low voltage Feature User defined parameter, Total variance/% extraction Vspread EMA 0.1 0.014 94 Without PCA — 0.2 0.017 81 1 0.029 43 85 0.1 0.009 7 With PCA 90 0.1 0.010 64
Performance measure EMS 0.000 79 0.000 82 0.00 16 0.000 35 0.000 36
ERMS 0.028 15 0.028 7 0.039 9 0.018 66 0.019 06
J. Cent. South Univ. (2013) 20: 466–479
478 Table 13 Performance evaluation of GRNN used in predicting risk of line overload Feature extraction
Without PCA
With PCA
Total variance/%
Performance measure
User defined parameter, Vspread
EMA
EMS
ERMS
0.1
0.010 96
0.000 85
0.029 1
0.2
0.013 31
0.000 98
0.031 2
1
0.031 87
0.004 2
0.065
85
0.1
0.009 64
0.000 33
0.018 11
90
0.1
0.008 54
0.000 31
0.017 66
—
Table 14 Performance evaluation of GRNN used in predicting risk of voltage collapse Feature extraction
Without PCA
With PCA
Total variance/%
—
User defined parameter, Vspread
Performance measure EMA
EMS
ERMS
0.1
0.015 00
0.000 95
0.030 74
0.2
0.021 60
0.001 8
0.042 43
0.3
0.029 10
0.003 3
0.057 45
85
0.1
0.011 93
0.000 67
0.025 88
90
0.1
0.015 09
0.000 74
0.027 27
[5]
KIRSCHEN D S, JAYAWEERA D. Comparison of risk-based and
[6]
DI SANTO M, VACCARO A, VILLACCI D, ZIMEO E. A
7 Conclusions 1) A comprehensive RBSA incorporating low voltage, line overload and voltage collapse analyses considering uncertainty in transmission line outage and the development of GRNN for prediction of risk index in power system is presented. The GRNN applied for predicting the risk of low voltage, line overload and voltage collapse in given load and weather conditions provide fast and accurate RBSA prediction. 2) The proposed techniques can handle all the critical line outages and hence reduce the computational burden required in predicting the risk index. The incorporation of PCA as feature extraction technique helps in reducing further the GRNN training time while improving the accuracy. The PCA manages to reduce more than 80% of the original input features to the GRNN.
References
deterministic security assessments [J]. IET GTD, 2007, 1: 527–533. distributed architecture for online power systems security analysis [J]. IEEE Trans Ind Electron, 2004, 51: 1238–1248. [7]
HUA W, McCALLEY J D, VITTAL V, Risk based voltage security
[8]
McCALLEY J D, VITTAL V, ABI-SAMRA N. An overview of risk
assessment [J]. IEEE T Power Syst, 2000, 15: 1247–1254. based security assessment [J]. IEEE Power Engineering Society Summer Meeting, 1999, 171: 173–178. [9]
DAI Y, McCALLEY, J D, ABI-SAMRA N, VITTAL V. Annual risk assessment for overload security [J]. IEEE T Power Syst, 2001, 16: 616–623.
[10]
NING C N, HSIEH C A, HSIAO T Y, LU C N. Two application examples of probabilistic risk assessment in power system operations [C]// International Conference on Probabilistic Methods Applied to Power Systems, Stockholm: IEEE, 2006, 1–5.
[11]
MOHAMMADI M, GHAREHPETIAN G B. Power system on-line static security assessment by using multi-class support vector machines [J]. Journal of Applied Sciences 2008, 8(12): 2226–2233.
[12]
ARYA L D, CHOUBE S C, KOTHARI D P. Line outage ranking for voltage limit violations with corrective rescheduling avoiding masking [J]. Int J Electr Power Energ Syst, 2001, 23: 837–846.
[1]
MING N, MCCALLEY J D, VITTAL V, TAYYIB T. Online
[13]
risk-based security assessment [J]. IEEE T Power Syst, 2003, 18:
POZZI M. Online fuzzy voltage collapse risk quantification [J]. Elec
258–265. [2]
FEI X, McCALLEY J D. Power system risk assessment and control
BERIZZI A, BOVO C, CIRIO D, DELFANTI M, MERLO M, Power Syst Res, 2009, 79: 740–749.
[14]
in a multiobjective framework [J]. IEEE T Power Syst, 2009, 24:
CHEN W H, JIANG Q Y, CAO Y J. Low voltage risk assessment in power system using neural network ensemble [J]. Adv Neural
78–85.
Network, 2006, 3972: 1416–1421.
[3]
HALILCEVIC S S, GUBINA F, GUBINA A F. Prediction of power system security levels [J]. IEEE T Power Syst, 2009, 24: 368–377.
Contingency probability estimation using weather and geographical
[4]
KIRSCHEN D S, JAYAWEERA D, NEDIC D P, ALLAN R N. A
data for on-line security assessment [C]// International Conference
probabilistic indicator of system stress [J]. IEEE T Power Syst, 2004,
on Probabilistic Methods Applied to Power Systems, Stockholm,
19: 1650–1657.
2006, 1–7.
[15]
XIAO F, MC CALLEY J D, OU Y, ADAMS J, MYERS S.
J. Cent. South Univ. (2013) 20: 466–479 [16]
YATES R D, GOODMAN D J. Probability and Stochastic processes [M]. New Jersey: John Wiley & Sons, 2005.
[17]
Fundamentals, computing, design, and application [J]. J Microbiol Meth, 2000, 43: 3–31. [23]
VAPNIK V N. An overview of statistical learning theory [J]. IEEE
[24]
BAOYING L, RENGANG Y. A novel method based on PCA and
Trans Neural Network, 1999, 10: 988–999.
AMJADY N, ESMAILI M. Application of a new sensitivity analysis 2005, 20: 973–983.
LS-SVM for power load forecasting [C]// Third International
de MOURA R D, PRADA R B. Contingency screening and ranking
Conference on Electric Utility Deregulation and Restructuring and
method for voltage stability assessment [J]. IEEE Proceedings-
Power Technologies, Nanjing, 2008: 759–763.
Generation, Transmission and Distribution. 2005, 152(6): 891–898. [20]
[25]
FLUECK A J, GONELLA R, DONDETI J R. A new power voltage collapse [J]. IEEE T Power Syst, 2002, 17: 265–270. HAZRA J, SINHA A K. A risk based contingency analysis method incorporating load and generation characteristics [J]. Int J Electr
SAWHNEY H, JEYASURYA B. A feed-forward artificial neural network with enhanced feature selection for power system transient
sensitivity method of ranking branch outage contingencies for [21]
BASHEER I A, HAJMEER M. Artificial neural networks:
for online prediction of voltage collapse [J]. IEEE Proceedings-
framework for voltage contingency ranking [J]. IEEE T Power Syst, [19]
Power Energ Syst, 2010, 32: 433–442. [22]
BALAMOUROUGAN V, SIDHU T S, SACHDEV M S. Technique Generation, Transmission and Distribution, 2004, 151(8): 453–460.
[18]
479
stability assessment [J]. Elec Power Syst Res, 2006, 76: 1047–1054. [26]
MILANO F. An open source power system analysis toolbox [J]. IEEE T Power Syst, 2005, 20: 1199–1206. (Edited by HE Yun-bin)