Injury Control and Safety Promotion 2003, Vol. 10, No. 1–2, pp. 89–94
1566-0974/03/1001–2-089$16.00 © Swets & Zeitlinger
ORIGINAL PAPER
Road traffic accidents and policy interventions in Korea Bong-Min Yang1 and Jinhyun Kim2 School of Public Health, Seoul National University, Seoul, Korea and 2Department of Health Administration, Inje University, Kyungnam, Korea 1
Abstract The high rate of road traffic crashes, in conjunction with the absence of order on the road, has long been considered a critical social problem in Korea. The Korean public seems to agree that high priority ought to be placed on policies for improving road safety. Using data from government sources, this study describes what has happened in the area of road traffic crashes since 1970, the causes of traffic crashes, and the relative importance of traffic injuries as a cause of death in Korea. Road traffic crashes in Korea increased nearly eightfold, from 37,000 in 1970 to 290,481 in 2000. The fatalities increased three-fold and injuries ten-fold over the same period. Road traffic injuries were the leading cause of death for people under 29. However, through multiple policy interventions, partly in response to the 2002 FIFA World Cup, about two thousand road traffic deaths and nine thousand traffic-related disabilities were averted in 2001 alone. The policy interventions included enforcement of penalties for seven risky driving behaviours, including drunk driving and speeding, installation of traffic-monitoring cameras, financial rewards for citizens who reported traffic violations, introduction of a road safety evaluation system, correction of accident black spots in existing roads, and road safety education programs. Through multiple policy interventions, road traffic crashes in Korea were reduced in a relatively short time period, along with their associated injuries and fatalities. However, road traffic crashes still pose a major public health problem, threatening the quality of life of the Korean people. Keywords: road traffic accident; injury; fatality; quality of life; Korea.
Introduction The number of motor vehicles in Korea has increased sharply, by more than 94 times, during the last three decades1.
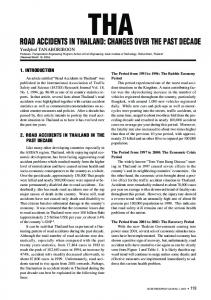
Over the same period, traffic crashes have increased by as much as 7.8 times. Currently most crashes involve cars and trucks. The major cause of traffic crashes is reckless driving including drunk driving, speeding, and non-use of seat belts. Violation of traffic signals, intrusion of median strip (dividing line), and improper driving at intersections are other important causes of traffic crashes in Korea (Fig. 1). The high rate of road traffic crashes in conjunction with the absence of order on the road has long been considered a critical social problem in Korea. There has been substantial publicity and discussion regarding how to correct the problem. Only recently, in 1999, a special national commission was formed under the Prime Minister’s Office for the purpose of studying and discussing possible approaches to reduce the level of road traffic crashes and related social costs. Such singular attention has been paid to the issue of road traffic crashes for three main reasons. First, as data in this paper reveal, Korea’s crash rate is much higher than those of industrialized countries. The government of Korea considered the very high road traffic crash rate to be a barrier to the country becoming a genuine member of the community of industrialized nations. Second, as a country hosting the 2002 FIFA World Cup, Korea needed to improve its image, particularly in the area of road traffic safety. Third, recognizing the enormous social costs involved with traffic-related injuries and fatalities, several nongovernmental organizations (NGOs) aggressively took part in the policy formulation process. The NGOs pushed both parliament and the government to implement new legislations and to enforce pre-existing regulations. Owing to their efforts, combined with a mass media campaign focusing on traffic-related social costs, the various efforts to reduce road traffic crashes have been accepted as a national movement by the public.
Accepted 8 October, 2002. Correspondence: Professor Bong-Min Yang, School of Public Health, Seoul National University, Yunkun-dong, Jongro-ku, Seoul, 110-799, Korea. Tel.: 82-2-740-8884, Fax: 82-2-745-9104, E-mail:
[email protected]
90
Bong-min Yang and Jinhyun Kim Violation of pedestrian protection, 3% Improper driving at intersection,7%
Others, 5%
Driving too close to vehicle ahead, 6%
Violation of traffic signal, 8%
Reckless driving (including drunk driving) 64%
Intrusion of median strip, 7%
Source: Road Traffic Safety Authority, Road Traffic Accidents in Korea, 2001
Figure 1.
Traffic crashes by cause, South Korea, 2000.
Korea subsequently witnessed a substantial decrease in the number of road traffic crashes, injuries and fatalities, especially in 2001 and 2002. A recent government report by the National Policy Agency1 explains how such a sharp decline could happen in such a short time period. However, this is not yet a finished agenda. Further reduction in crash rates and changes in driving habits are required for better quality of life in Korea. The Korean public seems to agree that high priority ought to be placed on reducing road traffic crash rates even further2.
traffic injuries as a cause of death by age group, mortality data from the Government Statistical Office for 2000 were used. For estimates of auto insurance costs of road traffic crashes and injuries, the Facts and Analyses of Auto Insurance by the Insurance Development Institute for the period 1995–1999 were used3. The National Police Agency in conjunction with the Traffic Safety Commission under the Prime Minister’s Office provided the data on policy interventions based on an interim report in early 20021. Examples of intervention policies and their effects cited in this research were primarily based on that report.
Methods This research is a descriptive analysis of trends in crashes and injuries using time series data. Road traffic crashes and their causes were analyzed using a long-term perspective, so that policy implications for interventions could be derived from the analyses. Regression analyses could have been done if socioeconomic variables had been done with the traffic-related data sources. However, such an attempt was not made in this research. This research, therefore, (i) describes the trend in road traffic crashes, injuries and fatalities over time, (ii) offers a brief comparison with other countries and (iii) determines the relative importance of traffic injuries as a cause of death in Korea. Furthermore, through analysis of trends, description and comparison, policy implications for interventions are discussed. The main sources of data used in this research were the reports and statistics released by the Korean government. The data were, therefore, assumed to be representative of national trends in road traffic crashes, injuries and fatalities. For crashes, injuries and fatalities, the Statistics of Road Traffic Accidents by the Road Traffic Safety Authority2 were used. They recorded five-year data starting in 1970 and annual data for 1995–2000. For vehicle kilometers, the Statistical Yearbook by the Ministry of Construction and Road Traffic was used. Vehicle kilometer data were available only for the period 1995–2000. To examine the relative importance of
Results Presentation of the results in the paper is divided into two main sections: analysis of the burden of road traffic injuries and crashes and their trends from 1970–2000; and a description of the results achieved through multiple policy interventions instituted in 2000.
Crashes, fatalities and injuries, 1970–2000 Concurrent with the increase in the number of registered vehicles, the number of traffic crashes increased from 37,000 crashes in 1970 to 290,481 in 2000, as shown in Table 1. The total number of traffic crashes has increased steadily since 1970. However, the crash rate per vehicle has sharply decreased, from 28.9% in 1970 to 2.4% in 2000, mainly due to a relatively more rapid increase in the number of motor vehicles than an increase in crashes. Currently most crashes involve passenger cars (72.7%) and trucks (19.0%). Motorcycles and others vehicles make up 3.2% and 5.1% of crashes, respectively4. During the same time period, the number of fatalities increased by 3.3 times, from 3,069 deaths in 1970 to 10,236 deaths in 2000. The number of fatalities showed a consistent
Road traffic accidents and policy interventions in Korea Table 1.
91
Trend of road traffic crashes, fatalities and injuries, 1970–20002.
Year
1970
1975
Registered motor vehicles (in thousands) Crashes (in thousands)
128 (100) 37 (100) 28.9 3,069 (100) 9.5
194 (152) 58 (157) 29.9 3,800 (124) 10.8
528 (413) 120 (323) 22.7 5,608 (183) 14.7
42,830 (100) 132.8
61,092 (143) 173.2
111,641 (261) 292.8
Crash rate (%) Fatalities Fatality per 100,000 population Injuries Injuries per 100,000 population
1980
1985
1990
1995
2000
1,113 (870) 147 (397) 13.2 7,522 (245) 18.3
3,395 (2,652) 255 (689) 7.5 12,325 (402) 28.8
8,469 (6,616) 249 (673) 2.9 10,323 (336) 23.0
12,059 (9,421) 290 (784) 2.4 10,236 (334) 21.7
184,420 (431) 451.9
324,229 (757) 757.7
331,747 (775) 739.7
426,984 (997) 903.2
Note: Figures in parentheses indicate relative indexing, assuming 1970 = 100.
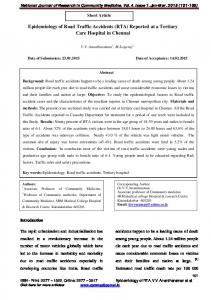
increase up to the early 1990s, began to fall, and then stabilized at around 10,000 deaths per year. However, traffic fatalities per 100,000 population remain high at around 22, meaning that 22 people out of 100,000 die from traffic injuries annually. Fatalities per crash by type of vehicles were 2.5% for passenger cars, 4.2% for trucks, and 8.3% for motorcycles in 2000. Similarly, traffic-related injuries are increasing. These injuries increased by almost 10 times during the same period, from 42,830 in 1970 to 426,984 in 2000. Unlike the case of fatalities, the number of injuries per 100,000 population is growing. This continued increase in absolute number of injuries and injuries per unit population implies that the social burden of road traffic injuries is becoming greater over time, exacting a heavier toll on the Korean people. A slightly different picture is drawn when the traffic crashes, fatalities and injuries are divided by the actual vehicle-miles driven for 1995–2000 (the years when these data are available). Table 2 indicates that, compared to 1995 levels, all three indices—crashes per million km, fatalities per million km, and injuries per million km—declined substantially. The crashes declined from 105 in 1995, stabilizing at around 75 crashes per million km traveled. A similar trend is found for fatalities and injuries. Fatalities and injuries declined from 4.4 and 140 per million km traveled to 2.7 and around 100, respectively. Though crashes, fatalities and injuries per million km have leveled off, they remain relatively high, thus exacting a serious toll on the health of the population. Figure 2 shows crashes, fatalities and injuries by index based on 1970 data. It indicates that the number of injuries is rising at a faster rate than the number of crashes or fatalities. The gap between injury index and crash index is widening over time, implying that while fewer are dying, they are injured instead. This is because the share of passenger cars has increased more than those of relatively unsafe trucks and
Table 2. Road traffic crashes, fatalities and injuries per million vehicle-kilometers2,4. Year
Crashes
Fatalities
Injuries
1995 1996 1997 1998 1999 2000
105.3 83.1 67.0 75.3 77.0 76.5
4.4 4.0 3.2 2.8 2.6 2.7
140.4 111.6 93.4 107.0 112.4 112.4
motorcycles. The rising trend in injuries also places a burden on national resources. Fatalities per 10,000 vehicles in Korea are 7.4, compared with 1.2 in Japan, 1.3 in the UK, 2.0 in the USA and 3.1 in France in 19982. Auto insurance costs In 1999, average payment by auto insurance, as shown in Table 3, was US$53,600 per death and USA$2,330 per injury (Table 3). Auto insurance covers indemnity for death, medical expenses for injuries and costs for rehabilitation5. Injuries are classified into five categories according to the severity of injury. The big difference between costs of injuries and fatalities is due in part to the fact that medical costs for injuries are strongly regulated by the government in Korea. Considering additional direct and indirect costs incurred by the individuals involved, these estimated costs represent the lower limits of the true costs of traffic crashes. It is interesting to note that both payments (per death and per injury) show a declining trend, with a sharp drop of injury costs to insurance in 1999. Whether this trend will be stable or
92
Bong-min Yang and Jinhyun Kim 1,200 Injuries
Relative percent
1,000 Crashes
800
600 Fatalities
400
200
0 1970
1975
1980
1985
1990
1995
2000
Source: Road Traffic Safety Authority, Road Traffic Accidents in Korea, 2001
Figure 2.
Road traffic crashes, fatalities and injuries in South Korea by index relative to 1970 rates set at 100%.
Table 3.
Auto insurance expenditures in Korea 1995–19993. 1995
1996
1997
1998
1999
Auto insurance expenditure per person in crash Death (1,000 won) 66,043 77,111 (U.S.$1,000) (50.8) (59.3) Injury (1,000 won) 4,997 5,165 (U.S.$1,000) (3.84) (3.97)
77,130 (59.3) 4,779 (3.68)
71,424 (54.9) 4,779 (3.68)
69,699 (53.6) 3,029 (2.33)
Composition of auto insurance reimbursement (%) Fatality 24.7 24.7 Injury medical cost 31.5 32.1 Other injury-related payments 10.3 11.1 Disability compensation 32.1 30.8 Litigation costs 1.4 1.3
21.1 36.1 10.9 30.4 1.5
18.4 41.9 12.2 26.2 1.3
18.0 47.4 13.6 20.0 1.0
Note: exchange rate, U.S.$1 = 1,300 won.
not is yet to be examined. However, medical costs to the insurance industry are increasing, reaching almost half of all costs in 1999. Medical care accounted for less than one-third of all costs in 1994. Payments for fatality and disability compensation have both fallen significantly. The explanation for this is not clear. It is not known whether this represents a decline over time in the severity of injuries sustained.
Owing to their efforts, together with contributions by the mass media in a campaign highlighting the rise of trafficrelated social costs, the public has embraced efforts to reduce road traffic injuries as a national movement2. The movement was highly successful, at least in the short term, in averting approximately two thousand road traffic deaths and nine thousand traffic-related disabilities in 2001 alone. The movement continues in 2002. The approaches undertaken could be grouped into the following categories:
Recent policy interventions and their impact In the period prior to the 2002 FIFA World Cup, multiple intervention policies were introduced by police to reduce the rate of crashes in Korea. The Traffic Safety Commission under the Prime Minister’s Office provided direction to the police authorities in their fight against road traffic crashes.
Enforcement of fine for unbuckled seat belts In the second half of 2000, the government estimated that the rate of drivers who buckled seat belts when driving was only 23%. This was a much lower rate than those in other industrialized countries, such as 95% in Sweden, 94% in Australia,
Road traffic accidents and policy interventions in Korea 86% in Japan and 67% in the United States. The government then set a target rate of 80% by 2006. In January 2001, the police launched a national campaign to increase the use of seat belts. As of August of 2001, after eight months of a campaign asking the public to use seat belts coupled with law enforcement through increasing the fine by more than 100%, the seat belt use rate rose from 23% to 98%2. This is regarded as the most successful government campaign so far in Korea in any field. It is an amazing record for two reasons. First, a 98% buckling rate is one of the highest in the world, and, second, the rate increase of net 75% is remarkable to have achieved in such a short period of time. The high buckling rate was sustained in 20027. Stimulated by this unparalleled success, police authorities estimated the impact of the enhanced buckling rate on injuries and fatalities. A recent police report claims that 139 road traffic deaths due to non-use of seat belts were prevented in the eight-month period, equivalent to a 5.9% decrease in traffic-related fatality1. Strengthened control of seven risky driving behaviors In addition to the seat belt regulation, in January 2001, the police began a special control including stiff fines, license suspension and more frequent monitoring for traffic violations in relation to seven risky driving behaviors. The major risk behaviors include drunken driving, driving without license, speeding, violation of traffic signals, intrusion on median strip, wild driving by motorcyclists, etc. As a result, there was a significant drop in the number of fatalities in four categories of risky behavior: drunk driving, driving without license, speeding, and violation of traffic signals1. The police claim that for the eight-month period of January 2001–August 2001 more than 1,100 deaths were prevented as a result of strengthened control of risky driving behaviors alone. Significant decreases in the number of deaths were observed in the area of other causes of fatality, compared to the corresponding traffic deaths of the previous year. Once again, it can be said that a remarkable improvement in driving safety has been attained within an eight-month period. Expansion of monitoring camera system In 1997, there was publicity around the installation of trafficmonitoring cameras, which police authorities used to check for speeding in areas where the crash risk was high. Police then placed more cameras in other areas in 1998 and 19992. To measure the effect of expanded use of monitoring cameras, the number of crashes and fatalities at these highrisk spots were compared before and after the installation of monitoring cameras over a period of 12 months. The number of crashes that occurred within a diameter of 1 km from the spots where monitoring cameras were installed in 1997 fell by 28%, and the number of fatalities fell by 60%. Similar
93
effects were observed in the case of cameras installed in 1998 and 19991. It is possible that the effects of monitoring cameras will disappear once drivers fully adjust to avoiding violation charges, and the initial effect of reducing crashes and fatalities will lessen with time. Such information is not available at the moment. However, an investigation to measure the lasting effect of the monitoring camera system has been planned. Financial reward system for traffic violation evidence In April 2001, the government of Korea introduced a reward system for citizens reporting traffic violations. Under the system, anyone who holds evidence of a traffic violation can report it and receive a financial reward. The evidence is normally in the form of photographs or videotapes taken at the site of a violation. This system inspired many people to take shots of traffic violations for financial reward in cash payment. During the month of April 2001, the first month of implementation, 25,000 cases of traffic violation per day were submitted to the authorities, with 99% of those initially submitted deemed true and rewarded. The number of submitted cases has declined from 25,000/day in April to 7,000/day in August 2001—figures that can be partially explained by the suggestion that more drivers began to abide by traffic rules. Related statistics showed that at 100 spots where many traffic violation pictures were taken, the number of traffic crashes was reduced to 653 for the five-month period April–August 2001, compared to 1,016 crashes for the same period the previous year. In other words, the net effect of this reward system was a reduction by 363 in the number of traffic crashes (35.7%) for the five-month period1. Introduction of road safety inspection system The road safety inspection system has been applied to all roads constructed since 2001 with the goal of improving road design. This regulation dictates that all the new roads go though safety inspection from their planning stage to their completion. For the existing roads and spots that record frequent crashes, safety inspection was also carried out by a joint team involving the police and the Road Maintenance Bureau. After inspection, if necessary, the roads in high-risk areas were redesigned with a safer linear structure. A report by the National Police Agency1 shows the effects of road structure change for roads that were considered badly designed in terms of traffic safety. For the first half of 2001, the structure of 232 roads was reshaped for improved safety. The police claimed that after changing the road structure, the number of crashes, fatalities and injuries near those spots fell by 38%, 65% and 36%, respectively, compared to the numbers for the first half of 2000. Thus many lives were saved and injuries prevented as a result of this audit system.
94
Bong-min Yang and Jinhyun Kim
Saved and prevented too were the high social costs that could have resulted from these road traffic deaths and injuries. Introduction of life-long education program for safe traffic Police agencies initiated several education-related programs for improved road traffic safety (RTS). First, education programs for children were prepared and provided at preschools and elementary schools. Second, a program that required each elementary school to appoint a teacher in charge of planning children’s RTS programs was enforced and is now under practice. Third, RTS education programs at junior high and high schools were strengthened as part of the school curriculum. Fourth, similar RTS education programs were provided for the elderly in nursing homes and similar institutions to reduce their involvement in road traffic crashes. Fifth, from the second half of 2002, a new education program will be enforced for people who apply for a driver’s license test, making it mandatory for every applicant to take seven hours of RTS education before taking the test. At the moment, however, no results on effectiveness are available
Discussion The evidence presented in this paper shows that through multiple appropriate policy interventions and the participation of multiple stakeholders (Korean police, policymakers, the media and the public), Korea was able to reduce road traffic crashes, injuries and fatalities by large margins in a relatively short time period. Despite this achievement, road traffic injuries still pose a major threat to the well-being of Korean society. There is still a high rate of crashes, injuries and fatalities per 100,000 population, and per vehicle kilometer traveled. This signals the necessity for further efforts to reduce the rates. This is not only because the lower rate itself is important, but also because a lower rate implies improved quality of life for the vulnerable populations affected most by road traffic injuries, with extended benefits to Korean society at large. The human development benefits accruing from Korea’s economic growth have been largely offset by the burden of road traffic injuries. In 2000, road traffic injuries were the fourth leading cause of death in Korea, after cancer, stroke and heart disease6. Analyzed by age, road traffic injuries were shown to be the number one cause of death for children and young adults (ages 1–29). They were also the second leading cause of death for people in their 30s and the third leading cause for people in their 40s. Thus, many people under 50 die from road traffic injuries, while a majority of older populations die from diseases such as cancer, stroke and heart problems. The high involvement of young people underscores the importance of road traffic injuries as a cause of social burden and suggests the direction intervention policies should take in order to reduce road traffic crashes and their associated social burden.
The policy interventions implemented were targeted at reckless driving such as speeding, drunk driving, and violation of traffic laws. The lessons from Korea’s experiences demonstrate the value of carefully targeted policies and interventions in protecting the most vulnerable groups. It is not certain whether the remarkable accomplishments recorded over the last two years can be sustained in the years to come. If the statistics hold true, then a significant improvement in road safety has been achieved in Korea in a very short time period. The stakeholders involved seem proud of this unusual achievement. This local ownership of the program and results gives an excellent basis for sustainability. In conclusion, the lessons from Korea show that it is possible to control the epidemic of road traffic injuries, as has also been demonstrated in other industrialized countries, through multiple policy interventions. How sustainable our experiences and results will be remains to be evaluated.
Acknowledgments The authors wish to thank Mr. Myung-Gyu Yi and Mr. Giwhan Bae of the Traffic Safety Department, National Police Agency, Government of Korea, for their data, support and detailed comments about traffic crashes in Korea. The authors believe that their dedication to their work is certainly a contributing factor to the recent reduction of road traffic crashes in Korea. This study would not have been feasible without their support.
References 1 National Police Agency. Reasons for declining road traffic accidents and future plans. Interim report. Seoul, Korea: National Police Agency; 2002. 2 Road Traffic Safety Authority. Statistics of road traffic accidents in Korea. Seoul, Korea: Road Traffic Safety Authority; 2001. 3 Insurance Development Institute of Korea. Facts and analyses of auto insurance. Seoul, Korea: Insurance Development Institute of Korea; 2000. 4 Bureau of Roads. Statistical yearbook Seoul, Korea: Ministry of Construction and Road Traffic; 2001. 5 Ilsoo J. Automobile insurance: a means to reduce accidents and to compensate victims. Seoul, Korea: Korea Transport Institute; 2000. 6 Government Statistical Office. Annual statistics of causes of death. Seoul, Korea: Government Statistical Office; 2000. 7 Korean National Police Agency. Traffic statistics. [online]. Available from: URL: http://www.police.go.kr/data/statistics/defense_list.html.