To find the speed of your robot, measure the distance it travels in a certain ...
robot‟s speed by the time it took to travel around the shape. Robotics Theory:.
Robot Olympics USING LEGO MINDSTORMS NXT
Copyright © 2009 by Technically Learning
Questions? Comments?
[email protected] 1 of 26
TABLE OF CONTENTS ACTIVITIES 1. Measure the Race Course ........................................................................................................ 3 2. Wheel Circumference .............................................................................................................. 6 3. Slowest Car Race ..................................................................................................................... 8 4. Soccer Bot ............................................................................................................................. 11 5. Cracking the Code ................................................................................................................. 13 6. Race to the Top ..................................................................................................................... 17 7. Mountain Climbing ................................................................................................................ 19 8. Fastest Car Race .................................................................................................................... 22 9. OLYMPICS! ............................................................................................................................ 24
Questions? Comments?
[email protected] 2 of 26
1. Measure the Race Course Goal: To measure the perimeter of a complex shaped off-road race course using the calculated speed of a line-following robot. Main
Themes: Perimeter of complex shaped objects Building a line following robot with the light sensor Programming with loops Calculating speed by evaluating mathematical expressions Accuracy of measurements
Math Theory: Perimeter is the distance around the outside of a shape. Speed = Distance / Time. To find the speed of your robot, measure the distance it travels in a certain amount of time and divide these values. Distance = Speed x Time. To calculate the perimeter of the race course, multiply your robot‟s speed by the time it took to travel around the shape. Robotics Theory: The robot is built with the light sensor pointed down at the ground. The line following program starts with the light sensor on one side of the tape. The robot turns on one wheel and drives towards the tape until the sensor has crossed onto the tape (the light sensor picks up a darker value when it‟s above the tape). When it detects that it has driven across the edge of the tape, the robot changes the wheel rotations and turns away from the tape until its light sensor cross back onto the floor (lighter value). The robot repeats this behavior, driving in a zigzag pattern and advancing along the tape. Activity Instructions: Pre-Activity Setup: o The students will need to use a stop-watch or clock with a second hand in this activity. o Use tape that is either significantly darker or lighter than the surface it‟s on. Black electrical tape on a light colored floor or large table work well. o Place a 2 meter long strip of tape on the floor. o Also create a large “race course” shape out of the tape, for example a star, halfcircle, or twisting curvy shape. The shape needs to be closed (so the ends meet). After building the line following robot, use a stop watch to measure how long it takes for the robot to drive along the straight 2m section of tape. Calculate the robot‟s speed based on the time it travels in these 2m. Use units of meters per second (m/s). Run the robot around the perimeter of the “race course” shape. Use the stopwatch to measure the amount of time it takes to go around once. Now that you know the robot‟s speed and the time it took to drive around the perimeter, you can calculate the distance traveled (the perimeter) in meters per second. Measure/estimate the perimeter of the “race course” shape with a ruler to compare with the calculated robot measurement. For increased accuracy use a piece of string or twine to measure the perimeter. Questions? Comments?
[email protected] 3 of 26
Construction Tips: At a minimum, build a standard wheeled robot Point the light sensor down in front of the robot, placing it close to the robot (i.e. not on an extended bar far out in front)
Sample Code: Assumption for this code sample: the robot starts with the light sensor over the table or floor, with the darker tape to the left of it. Other configurations will work, but the students will need to know what it is before programming.
Example of a simple line-following robot
This program tells the robot to: Turn on motor B in the forward direction for an unlimited duration. o This turns the robot to the left, causing the light sensor to swing towards the dark tape o Don‟t go too fast – use the power slider to slow the rover down a little. This will make for more consistent edge following. Wait until the light sensor detects less light reflecting back (i.e. when it is over the dark tape). Change the sensor to wait until a darker light value („‟ symbol). Stop motor C Loop back to the beginning of the program Discussion Questions: Was your ruler measurement different from the calculated robot measurement? How big was the difference? What are some of the reasons that could explain the difference? Did all the groups calculate the same perimeter? o If they have different answers, why might one group be more accurate than another? What was the range of robot speeds? o Why was one robot faster than another? Questions? Comments?
[email protected] 4 of 26
What types of shapes have the longest perimeter? Or the shortest? o Circles have the largest internal area with the shortest perimeter. This is related to why bubbles take spherical forms; the soap‟s surface tension pulls the bubble into the most efficient shape.
Activity Variations (optional): Run the robot around the shape multiple times (5-10), and calculate the perimeter using the average of all the runs. Does this seem to produce a more accurate perimeter calculation? Try changing the speed of your robot (using the power slider setting on the motors), and recalculate the perimeter. Try slowing down the motors and then try speeding up the motors. Do either of these changes seem to improve the measurement accuracy? Map out different sized shapes on the floor, as well as a mix of irregular ones: some with smooth curves, some with jagged edges. Which of the shapes (large or small or curvy or jagged) do you think the robot will be most accurate with?
Questions? Comments?
[email protected] 5 of 26
2. Wheel Circumference Goal: Compare two different methods for calculating the circumference of the robot‟s wheels. First, measure the diameter of the wheel and calculate the circumference. Then, calculate the circumference by measuring the distance the robot travels and the number of wheel rotations. Main
Themes: Circumference The number Pi (𝜋) Evaluating expressions with values Accuracy of measurements
Math Theory: The perimeter of a circle or wheel is called circumference. It can be calculated by measuring the diameter of the circle then multiplying by 𝜋 (pi). Circumference = diameter * 𝜋 Another way to calculate the circumference of a wheel is to roll it along the floor in a straight line for a set number of rotations. Then divide the total distance traveled by the number of rotations to get the distance once around the wheel. Circumference = distance traveled / number of wheel rotations Pi (𝜋) is a very special number; it‟s known as an “irrational number” because it cannot be expressed as a fraction, and it never ends or repeats. That means that 3.14159265 is just an approximation of its actual value, which goes on forever. Activity Instructions: Diameter Method o Select a wheel for your robot. o Use a ruler to measure the diameter across the wheel. Be as accurate as possible and record the diameter. o Multiply the measured diameter by 𝜋 (3.14159265) and record the Diameter Method Circumference. Wheel Rotation Method o Build a robot using the same wheels as in the diameter method, attaching the wheels directly to the motors. o Program the robot to move forward for 25 rotations. o Mark a starting point on the floor with tape. o Position the robot on the starting tape line. o Run the program to move the robot forward 25 rotations. o Measure the distance the robot traveled. o Divide the total distance traveled by the number of rotations (25) and write down the Wheel Rotation Method Circumference. Construction Tips: A simple car robot is fine for this activity. However, it‟s important that the wheels don‟t slip on the floor and that the robot drives in a straight line, not veering to either side, to ensure accurate results. Questions? Comments?
[email protected] 6 of 26
Sample Code: This activity only needs a simple program where the motors turn on for 25 rotations Discussion Questions: Which method seems to provide a more accurate wheel circumference and why? o The circumference can be more accurately calculated with the Wheel Rotation Method, since measurement error is distributed over many rotations of the wheel. How would changing the number of rotations affect the accuracy of circumference calculations? How can you calculate the diameter of the wheel, now that you know the circumference? o Diameter = Circumference / 𝜋 How would different approximations of pi change our calculations? Try using 3 or 3.14 instead. This is the first 50 digits of pi, try using as many as your calculator will allow: 3.14159 26535 89793 23846 26433 83279 50288 41971 69399 37510 Activity Variations (optional): Use the Wheel Rotation Method with different numbers of rotations (1, 5, 10, 25, 50) and compare the results. Switch to different sized wheels. Use the Diameter Method to calculate the circumference of the wheel, and then predict how far the robot will go in 25 rotations. Resources: Pi on Wikipedia: http://en.wikipedia.org/wiki/Pi
Questions? Comments?
[email protected] 7 of 26
3. Slowest Car Race Goal: To……………………….build……………………the………………slowest………………….car………………… Main Themes: Using gears to decrease speed Calculating speed by evaluating mathematical expressions Math Theory: Gear Ratios o Gear ratio is determined by counting the number of teeth on gears that are in contact. o The biggest LEGO gear has 40 teeth, and the smallest has 8. When these gears are in contact, or meshing, they have a ratio of 40:8, or when simplified, 5:1. o This means the little gear will make 5 full rotations in the same time that the big gear makes 1 full rotation. The little gear will spin 5 times as fast as the big gear.
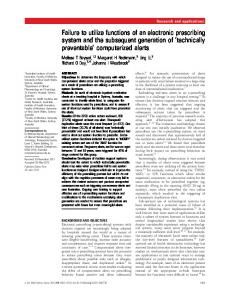
Example of a LEGO gear train with a 5:1 gear ratio
Robot Theory: Gears are typically needed to slow down the rotation speeds of electric motors. Motors spin very quickly, often thousands of Rotations per Minute (RPM). The Lego motor actually contains a set of gears inside the plastic housing along with an electric motor. A worm gear is a special type of gear that one has one tooth, which is a single spiral groove around a central core. If you connect this worm gear to the 40-tooth LEGO gear, you have a gear ratio of 40:1. This means the worm gear spins 40 times faster than the big gear!
Example of a LEGO worm gear train, with a 40:1 gear ratio
Questions? Comments?
[email protected] 8 of 26
Demo:
Build a gear train by putting a large gear next to a small gear. Connect a big wheel to each gear to make it easier to turn and see the effects:
Turn the large gear (by turning the wheel connected to the large gear). Notice how the small gear (along with its axle and wheel) spins very quickly. Next try rotating the small gear and notice that the big gear and axle spin very slowly. Play with this simple gear train for a while, feeling how the gears increase/decrease speed.
Activity Instructions: Day 1 o Start with the Gear Demo and discuss how gears work with the whole class. o Design and build a slow car for a race with these rules: Any moving robot is ok – doesn‟t have to be a traditional “car” with wheels In the program, the motors must use 100% power, run continuously, and drive forward in a straight line Robot must make visible forward progress (front of robot must move past the start line) o Calculate the speed of your car. Day 2 o First round of the slow car race. This can be done with all the cars racing at the same time (recommended if time is short), or in head-to-head races for a bracket style tournament. Race until you can clearly see which is the slower car. You can wait until one car surpasses the other or use a predefined time limit (i.e. whichever robot is behind after 1 minute). o As a group, examine and discuss why the slowest cars won. What do they have in common? Questions? Comments?
[email protected] 9 of 26
Day 3 o Iterate to make a better/slower car (learn from the first round of the competition) o Recalculate the speed of your improved car. Compare the speed to your car‟s speed from the first round. o Repeat the competition for a final round
Construction Tips: Connect the motor to the smaller gear and the wheels to the larger gear to slow down the movement of the wheels. You can build larger gear trains, using more than 2 gears connected in a row, to slow it down even more. Though using worm gears makes building difficult at times, they greatly affect gear ratio. If used with the biggest gear in the kit (40 teeth), the worm gear would result in a ratio of 1:40! Connect the worm gear‟s axle to the motor, and the big 40 tooth gear to the wheels Be creative! What methods could you use to slow down the robot other than gears? Think about the size of the wheels, or not even using traditional wheels at all! Sample Code:
Program the motors to turn on for an unlimited time o Set the motors to 100% Power o Use the “coast” setting instead of “brake” to achieve a more fluid movement. Put the motor block in a loop so that the motors actually stay on for an unlimited time (otherwise the robot will get to the end of its program and stop running)
Discussion Questions: Does the size of the wheel have any effect on the speed of your car? o Yes. All other factors being equal, the smaller the wheel, the slower the car. How would you build a really fast car (like a drag racer)? o Have the motor power the big gear and connect the wheels to the smaller gear Does running the car forward or backward have an effect on speed? Does your car have wheels? Are there other ways you could make it move that might be slower than wheels? Bicycles have gears that work very similarly. When your bicycle is in a low gear, what do you notice about how hard or easy it is to pedal? What about when it‟s in a high gear? Activity Variations (optional):
Write journal entries and/or draw diagrams of your initial design, what you changed and why, and your final design. Calculate the gear ratio of your robot.
Resources: Gear ratios on Wikipedia - http://en.wikipedia.org/wiki/Gear_ratio How Gears Work on How Stuff Works - http://www.howstuffworks.com/gear.htm Worm gear picture and how they work: http://science.howstuffworks.com/gear5.htm Questions? Comments?
[email protected] 10 of 26
4. Soccer Bot Goal: To build a robot capable of “kicking” one of the colored plastic balls into a goal. Then calculate the probability of it making the goal at different distances. Main Themes: Probability and percentage Robotic aim and accuracy Math Theory: Probability is the chance that an event will occur in the future, based on past behaviors. The probability of your soccer bot making the next shot is the number of goals your robot has already made out of the total shots it has taken. Probability = number of goals / total shots Percentage = (# of goals / total shots) x 100 Percents are shown with a percentage symbol at the end, for example 100% or 78%. Activity Instructions: Pre-activity setup: o Construct a soccer goal that is about a foot wide. It can be made out of cardboard, stacked books, or other construction material. o Put a line of tape 3 feet away and another line 10 feet away from the goal. Day 1 o Build a soccer robot to kick the ball towards a goal. Robots can also throw the ball, hit it like a billiards cue, or use any other method to get the ball into the goal while keeping the robot behind the line. o Test to make sure it can make the goal at both 3 feet and 10 feet away at least some of the time. Day 2 o If needed, iterate on your soccer bot design to ensure that the ball can go far enough to reach the goal from 10 feet away at least some of the time. o Soccer Competition: Each robot takes a turn at the 3 foot line, taking 10 shots at the goal. Record the number of shots your robot made successfully. Calculate the probability of making a future shot from that distance. Represent this as a fraction, and then as a percentage. The robot with the highest probability wins this round. For the second round, each robot takes 10 shots at the same goal, but from 10 feet away. Record the number of shots successfully made, and calculate the probability of making a future shot from that distance. Represent this as a fraction, and then as a percentage. The robot with the highest probability wins this round. Construction Tips: Build a solid, sturdy robot! Repeated kicks of the ball will rattle it apart if it‟s not strong. There are many styles of ball hitting to mimic, here are just a few: o Kicking with a vertical “leg”, similar to a human kicking or a pendulum swinging o Hitting the ball sideways, like pinball flippers or a tennis racket Questions? Comments?
[email protected] 11 of 26
o Hitting the ball straight on, like a billiard/pool cue o Throw the ball, as a human (or catapult) would Either a motor powered kicker or a spring loaded system can be used. You can use more than one motor to give the “kick” more power.
Example of a simple sideways kicking soccer bot
Sample Code:
Turn on the motor(s) for 180 degrees Use 100% power on the motor to make the ball go farther.
Discussion Questions: Did your robot have a higher probability of making the goal at 3 feet or 10 feet? Why? How different are the probabilities? How far away do you think the goal would have to be to have a less than 1% probability of making each shot? What types of robots had the highest probabilities of making each shot? Activity Variations (optional): Iterate the design to make a better robot that has a higher probability of making the goal o This could be easily run as multi-round competition over 3 or more sessions where the students iterate and improve their robot (and document design changes!). Write journal entries and/or draw diagrams of your initial design, what you changed and why, and your final design. Resources: RoboCup: international annual robotic soccer competition: http://www.robocup.org/ Questions? Comments?
[email protected] 12 of 26
5. Cracking the Code Goal: To decode and figure out another team‟s secret signals and communications. Main
Themes: Graphing histograms Probability & random numbers Calculating averages
Math Theory: Random means that there is no identifiable pattern or way of predicting the result. Choosing a random number from a range of numbers means that every number in that range has an equal probability of being chosen. For example, when you roll dice, each number 1-6 has an equal probability to come up. Histograms are charts that show how many times each event occurs in the form of a bar graph. It can also be used to show the distribution of data. The average, or mean, of a set of numbers gives the calculated “middle” value of all the values in the set. Average = sum of all the values in the set / the number of items in the set Activity Instructions: An example histogram Day 1: Optional intro demo: o Demonstrate random numbers by rolling dice and explaining that this generates random numbers from 1-6. Part 1 – graphing random numbers: o Program the NXT to display a random number on the screen. o Limit the random number generator to between 0 and 10. o Run the program many times, and create a histogram out of the results. You can use pennies or other small objects in different piles or lines for each number. You can also draw a histogram on paper or in a digital spreadsheet. Each time a number comes up, add one more penny to that bin (or section to the bar graph). o After many runs, you should see that each number is equally likely to appear. Part 2 – Finding the Secret Number: Pattern Method o Pick a secret number between 0 and 5. o Program the NXT to multiply the random number by your secret number and display the resulting number on screen. o Keep the random number set to the range of 0 - 10. o Run your program repeatedly and record what numbers appear on the screen. Can you see a pattern in the resulting values, based on your secret number? (Hint: the resulting values will all be multiples of your secret number) o Trade robots with another group (and don‟t tell them your secret number!) o Run the other group‟s program, and record the resulting numbers on screen. Do this repeatedly until you have enough data to guess the secret number. Remember to look for patterns in the resulting numbers! Questions? Comments?
[email protected] 13 of 26
Day 2: Part 3 – Finding the Secret Number: Averages Method o Using the same program from part 2, keep the random number range 0-10, but pick a new secret number from 0-5. o Trade robots with another group. o Run the program 10 times, record each resulting value, and calculate the average value across all 10 runs. The calculated average will be the secret number multiplied by the average of the random numbers. Because the random numbers range from 0-10, their average is 5. To get the secret number, divide the calculated average by the random number average. For example: if the secret number is 4, the numbers on the screen will eventually average 20 (4 times 5). If you calculate the average of 20, divide by 5 to get the secret number 4. In practice, it will be unlikely that you end up with a whole number; you can round up or down to guess the secret number. o Run the program another 10 times and calculate the average using all 20 values. How did the average change from the first time you calculated it? o Run the program another 10 times and calculate the average using all 30 values. How many values do you think you need to be able to make a confident guess at the secret number? Part 4 – Increasing the range o Use the same program, but change the values: Set the random number range from 0-20. Pick a new secret number from the range of 0-20. o Trade robots with another group and try to figure out their new secret number using both the Pattern Method and the Averages Method. Which is easier? Construction Tips: At a minimum, this activity only needs the NXT. You can also add a touch sensor and program it to wait for the touch sensor before generating another number. This provides a convenient way of going to the next iteration. Sample Code: This program tells the NXT to display the number on screen:
Questions? Comments?
[email protected] 14 of 26
This program: Takes a random number o Go to the complete palette:
o
and choose the “Random” block from the “Data” group (it looks like a die):
o Use the “Minimum” and “Maximum” settings on the Random block to set the range Multiplies the random number by your secret number o In the complete palette, choose the “Math” block from the “Data” group o Change the operation to “Multiplication” o Wire the random number output into “A” o In the setting for “B”, enter your secret number Converts the resulting number to text so the screen can display it o In the complete palette, choose “Number to Text” from the “Advanced” group:
o Draw o o o
Wire the output from the math block to the number input this block the value on screen Choose the “Display” block from the common palette Change the “action” setting to “text” Expand the inputs of the Display block by clicking at the bottom tab:
Clicking here: Expands the block to: o Wire the text output from the previous block to the text input of the Display block Waits for at least 2 seconds so that you have time to read the value on screen before the program ends and clears the screen o On the common palette, use the “Wait for” group and select the “Time” block Questions? Comments?
[email protected] 15 of 26
Discussion Questions: Were you able to guess the secret number? How many runs did you have to do before you guessed the correct number? Why can‟t you guess it after only one or a couple runs? o The random number will produce a different number every time. It takes many times before the average can overcome the fluctuations caused by randomness. For example, you cannot guess what number a die will show, but if you rolled it many times, the average would be 3.5. Which method was easier to use? Which method was better at guessing the secret number at the smaller ranges? Which method was better at the larger number ranges? What is the most obvious secret number to guess? o Zero. Every random number multiplied by zero will show zero on screen. What is the maximum value that could be returned on screen? o The number on screen will never be more than the secret number * the top of the random number range. What is the probability that the secret number will come up on screen? Activity Variations (optional): Increase the ranges even more if time permits. Make a line graph or histogram out of the values returned on screen. Discuss how this helps you visually estimate the “middle” or average number of the range of values returned on screen. After each new value on screen, calculate the new average from all the previous values plus this new number. Make a line graph of the resulting average. Discuss how over time the graph narrows in on a single number. (Remember – this number is the secret number multiplied by the average of the random numbers)
Questions? Comments?
[email protected] 16 of 26
6. Race to the Top Goal: Build a robot that can climb a rope by reeling itself up a piece of string. The winner of this event will be the one who builds the robot that can climb the rope the fastest. Main Themes: Using gears and gear ratios to increase the climbing speed Adjusting weight to increase speed Activity Instructions: Pre-activity setup: o This activity needs a length of strong string, rope or twine o Attach a length of this rope securely to an object in the room, allowing the rope to hang out in space (so the robot can climb it). The rope should be at least 4 feet off the ground, but not so high that you can‟t reach the robot when it reaches the top. If no appropriate object is available, the teacher or a tall student can hold the rope up high while the robot climbs the rope. Day 1: Build a rope-climbing robot o Build a robot that can climb to the top of the rope. o Test it out on the rope as you build to ensure it can successfully climb and carry its own weight to the top. Day 2: Fastest Climb Competition o Finish building and testing your rope climbing robot – improve the speed of your robot as much as you can or time allows. o Hold the Rope Climbing Competition: Give each robot a turn at climbing the rope. Record the time the robot took to reach the top. The fastest robot that reached the top wins the first round. Construction Tips: The design needs to balance the factors of weight and sturdy construction o Be sure to make a robot that is strong enough to carry its own weight and doesn‟t break or fall apart. o But the lighter the robot, the faster it can climb. o The more you strengthen the construction of the robot, the more of its own weight has to be carried up the rope. Make sure the pieces that you attach for reinforcement actually add strength, and not just weight. Remember to design a place to attach the rope on your robot. To climb the rope faster, try: o Increasing the diameter of the “spool” where the rope winds around. The bigger the spool, the faster it will reel in the rope. o To turn the spool even faster, and thus reel in the rope and climb faster, you could connect a gear train to the motor and spool. Connect the motor to the bigger gear and attach the rope-reeling part of your robot to the smaller gear.
Questions? Comments?
[email protected] 17 of 26
Example of a simple rope-climbing robot, which reels in the rope Sample Code:
Program the motors to turn on for an unlimited time o Run the motors at 100% on the “Power” slider. Don‟t use anything less than this or the motors won‟t be as strong. o Use the “coast” setting instead of “brake” to achieve a more fluid movement. Put the motor block in a loop so that the motors actually stay on for an unlimited time (otherwise the robot will get to the end of its program and stop running)
Discussion Questions: How do gears help your robot climb up the rope? How is this use of gears different from the Slowest Car Competition? What were different designs of attaching the rope to the robot and “climbing” the rope? What did the fastest robots have in common? Activity Variations (optional): Write journal entries and/or draw diagrams of your initial design, what you changed and why, and your final design. Resources: This example of a real-world rope-climbing robot inspects wind turbines: http://www.treehugger.com/files/2009/01/rope-climbing-robot-inspects-windturbines.php Questions? Comments?
[email protected] 18 of 26
7. Mountain Climbing Goal: To build a robot that climbs the steepest mountain. Main
Themes: Center of gravity Friction Angles
Math Theory: Angles are measured in degrees. When talking about ramps (or mountains, hilly roads, or a building‟s roof) the angle is typically measured from a horizontal line. A flat road would be at a 0 degree angle, and a vertical wall would be a 90 angle. A human walking up even a 30 or 40 degree hill would find it quite hard. Center of gravity refers to the point in the middle of an object‟s mass, or average location of mass. An object with a lot of weight in the front would mean that the center of gravity is shifted towards the front. A sphere‟s center of gravity would be at its exact center point. A donut‟s center of gravity is located at a point in space at the center of the hole. An object whose center of mass is outside of its base will fall over. Robotics Theory: Friction is the term for how much grip the wheels have on the ground. The more friction the wheels have, the steeper the ramp you can climb. Traction is another term for friction between the wheels and the ground. An example of a surface with high friction is sand paper, and one with low friction is ice. The closer a robot‟s center of gravity is to the ground the harder it is to tip that robot over. Race cars, for example, are extremely low to the ground for this reason. As the hill gets steeper, some robots with high centers of gravity will likely tip over. Activity Instructions: Pre-activity preparation: o Use a board as the mountain and increase the angle of the ramp until only one robot can climb to the top. You can support the board with a stack of textbooks, and then a chair, and then desk if needed. The downhill end of the board (near the starting line of the hill climb) can be propped against a chair to keep it from sliding. Day 1 o Have the students try walking up a steep incline (keep safety first!). Or just ask them to think about it. They will all lean forward when climbing a steep hill. Why? Discuss center of gravity and how it applies to the robots they‟re building. Would they want to have on just socks, or good shoes? Why? Discuss friction and how it applies to the robots. o Build a robot for climbing a steep ramp. o Run a first round of the competition to see which robots can climb the steepest ramp. Start with the most gentle slope and give each robot a turn. Questions? Comments?
[email protected] 19 of 26
Increase the angle and robots only advance to the next round if they get to the top of the ramp. Keep increasing the angle until only one robot can reach the top. As a group, look at the robots that could climb the steepest ramps. Discuss what they have in common.
o
Day 2 o Iterate on the design of the vehicles based on lessons learned from day 1 o Run the ramp climbing competition again, with even steeper angles.
Construction Tips: If you want to increase traction going up the hill, add more motor-driven wheels, similar to four-wheel-drive cars. You can also put more than one wheel on a single axle from a motor, like 18-wheel trucks. The more wheel surface touching the ground, the more friction you have. Try to keep your robot‟s center of gravity as low as possible so it doesn‟t tip over. o Experiment with moving the weight, and therefore center of gravity, to different areas of the robot. For example, you could try putting the motors at the front of the robot and then the back of the robot. You can also add a gear train to slow down the wheels, which will help climb steeper hills. Sample Code:
Program the motors to turn on for an unlimited time o Run the motors at 100% on the “Power” slider. Don‟t use anything less than this or the motors won‟t be as strong. o Use the “coast” setting instead of “brake” to achieve a more fluid movement. Put the motor block in a loop so that the motors actually stay on for an unlimited time (otherwise the robot will get to the end of its program and stop running)
Discussion Questions: Do all the vehicles resemble cars? What other types of vehicles would make good hill climbers? Tanks? Bicycles? Buses? Why? How could you make your robot climb steeper hills? Did your robot tip over? Why or why not? How does changing the robot‟s center of gravity help or hurt climbing the hill? Is having more weight up front, in the back, or in the center most useful? How else did a robot‟s center of gravity affect its ability to climb steeply? What‟s the limiting factor in your robot making it up the hill? o In other words, if friction is the limiting factor, the wheels would slip, keeping the robot from reaching the top. o If center of gravity is the limiting factor, the robot would tip over before reaching the top. Questions? Comments?
[email protected] 20 of 26
Activity Variations (optional): Run a third competition after another design iteration. Encourage the students to experiment with different ways to get up steeper ramps: run the robot backwards, add more weight to a different part of the robot, warm up the tires for more friction, etc. Change the surface of the ramp, to increase or decrease friction. Sand paper works well for a higher friction surface, and construction paper is a good low friction surface. Write journal entries and/or draw diagrams of your initial design, what you changed and why, and your final design. Calculate the speed of your robot on different angles of the ramp. Are they the same, or does the speed of your robot change? Why?
Questions? Comments?
[email protected] 21 of 26
8. Fastest Car Race Goal: To build a robot for maximum speed. Main Themes: Using gears to increase speed Impacts of wheel size on speed Math Theory: Speed = distance/time. The units of speed are determined by the units of distance and time. Converting these units from cm per second to miles per hour shows the speed in the familiar units of a car‟s speed. Robotics Theory: The fastest cars will typically have the highest gear ratios and the biggest wheels. They will take longer to accelerate, however. Activity Instructions: Day 1: o Build your fast car o Hold practice races against other teams Day 2: o Iterate on your design to make a faster car. o Hold the final races. Construction Tips: Gearing is an important way to speed up the car. o Remember to connect the smaller gear to the wheels and the larger gear to the motors, which is the opposite of the slow car design. o Encourage the students to try out different combinations of gear sizes. Sample Code:
Program the motors to turn on for an unlimited time o Run the motors at 100% on the “Power” slider. Don‟t use anything less than this or the motors won‟t be as fast. o Use the “coast” setting instead of “brake” to achieve a more fluid movement. Put the motor block in a loop so that the motors actually stay on for an unlimited time (otherwise the robot will get to the end of its program and stop running)
Questions? Comments?
[email protected] 22 of 26
Discussion Questions: What did the fastest cars have in common? What about their designs increased speed? Why do cars with bigger wheels travel faster? o Bigger wheels have a larger circumference, so in one rotation, more ground is covered. o If this is the case, why don‟t cars have bigger wheels? There are many reasons, for example bigger wheels cost more and make it harder to design the steering. Why are cars with higher gear ratios faster? o A higher gear ratio means the wheel has more rotations for every one rotation of the motor. o If this is the case, why don‟t cars have higher gear ratios? Most cars do not need to go faster than highway speeds, as most cars are not race cars. Race cars do have very high gear ratios to increase their speed. Activity Variations (optional): Use non-Lego pieces (such as cds) for the wheels to help increase the speed. Creating a different surface for the cars will affect the race, and require some redesign. Slippery surfaces will require different wheels. Bumpy surfaces would require bigger wheels and more ground clearance in the design. Write journal entries and/or draw diagrams of your initial design, what you changed and why, and your final design. Calculate the speed of your robot.
Questions? Comments?
[email protected] 23 of 26
9. OLYMPICS! Final Olympic Competition Instructions: Divide the class into at least 3 or 4 groups o Assign or let the groups pick an Olympics event. o Give the groups time to design, build, and test several iterations of their robot before the final competition: The Archery event is by far the easiest and probably does not need more than a day or two to prepare. The rest of the events need at least 3 or 4 classes to build multiple iterations and practice for the final competition. You can choose to have all the students compete in Archery in addition to another event. Run each event in multiple rounds. You can choose either: o Narrow the teams that advance to the next round. The event winner is the winner of the last round. o OR Give points at the end of each round to the top 3 places. The event winner is the one with the most points across all the rounds. Award “medals” for individual events, as well as overall medals for the groups or classes that accumulate the most points across all events. Olympics Events: 1. Tug of War Use engineering experience gained in the previous activities (e.g. Steep Ramp, Slowest Car, Rope Climb) to build a slow, sturdy tug of war robot Robot Theory o An early design decision will have to be made in this activity: Is it better to have a car-like robot that drives and pulls, or is it better to have a stationary machine that reels in the rope? Or both? Construction Tips o You can create a car that moves really slowly and with a lot of traction o OR you can create a really big stationary machine that uses the motor and gears to pull the rope in. (Note: this is harder than the car design) o Use lots of gears to slow the robot down and pull harder o Increase traction with more motor-powered wheels o Solidity counts! Strengthen and reinforce that robot! o Make sure to build a connection point for the tugging string to be tied onto o Use a length of rope, string, or twine to connect the two competing robots 2. Archery Note: this activity is easier and requires less time to build and iterate on the design and construction than the other events. You can use this as an additional challenge on top of the other events for all groups to compete in.
Build and program a robot to drive towards and stop in the center of a bull‟s eye. o Encourage students to test out their robot (and practice their calculations) on many different length courses as they won‟t know the final course length until the day of the competition. Questions? Comments?
[email protected] 24 of 26
Activity Instructions o Using black electrical tape, make a bulls eye on the ground. 1. The inner ring should be 1 foot in diameter, the next ring should be 2 feet in diameter, and the outer ring should be 3 feet in diameter. 2. The bulls eye is worth 5 points, the next ring is worth 2, and outer is 1 point. 3. 10 feet away from the bulls eye, use the electrical tape to make a “starting line”. This is where the robots will start and drive towards the bulls eye. o Prior to the start of the competition, the students calculate the speed of their robot. 1. Time the robot‟s run on a set distance. Then calculate its speed using: Speed = Distance / Time. o The event begins with the teacher telling the students how far the starting line is from the center of the bulls eye (or have them each measure!) o Students have a set amount of time to modify their program for this course: 1. Calculate how long the robot needs to drive in order to hit the bull‟s eye center, and program their robot to drive forward for that amount of time. 2. Time = Distance / Speed o Each robot gets released one-at-a-time from the starting line and attempts to hit the bulls eye. Record their points based on where the robot stopped. o After everyone has their turn at the 10ft distance, move the starting line. Announce the new distance (longer and shorter distances are both okay) and have the students recalculate and reprogram o Run as many rounds of different length shots as time allows. o Tally up points across all the rounds for the winner, OR only allow the top robots from the last round to advance until you narrow to one winner.
3. BasketBot Goal: Build a robot that can shoot a plastic ball into a waste basket a few feet away Ball: This activity needs a much lighter ball than the red/blue ones in the kit. Use a ping-pong ball instead. Basket: o Use a round trash can as the basket, or make one with a piece of cardboard. o The size and shape of the basket needs to be determined ahead of time, so the students can build for and practice with the same exact object they will compete with. (changing the basket at the final competition makes this too hard of an activity). Basketball Court: o Using tape, make a circle or line around the basket 3 feet away from the center of the basket. o This will represent the “3 point line” and all shots taken from farther away than the line are worth 3 points. All shots taken inside the line are worth 1 point. o Students can choose to shoot from anywhere inside or outside the line. o You could optionally draw a second line farther away for more points (just decide ahead of time so the students can choose to design for it). Build a robot that can launch/shoot/throw/hit the ball into the air and into the basket from a certain distance away. o Students can build their robot to be able to shoot from anywhere inside or outside the line. Questions? Comments?
[email protected] 25 of 26
1. Part of the design challenge is deciding whether to shoot from within the line or outside the line. 2. The closer the robot is, the more likely it will get more baskets, but each basket is worth fewer points within the line. 3. Or the robot could shoot from outside the line, getting more points with each basket, but it‟s harder to complete as many shots from farther. o Encourage students to keep improving their robot to increase the probability it will make more baskets. o Students should record the distance between the robot and the basket that their robot‟s design and program uses. Adjust this distance as needed with design iterations. Students will need to know their robot‟s distance to be able to place their robot correctly in the final competition. Final competition: o Before their turn, students measure and place their robot in their starting position. o You can run the competition in one of two ways (or try both!): 1. Take as many shots as you can in 60 seconds (or other time limit) 2. OR robots have a set number of shots (perhaps 20) o Tally up points based on the total number of shots completed and the robot‟s position inside or outside of the 3-point line.
4. Off-Road Race Goal: Build a robot that can complete a difficult-terrain course the fastest. Race Course: o The course can be designed by the class, or use this suggested course: 1. Flat ground for the first 5 feet 2. A ramp that is 3 feet long and goes up 1 foot. 3. A downhill section that is 2 feet long, and drops 1 foot to the floor. 4. A 10 foot final section that has a variety of small obstacles in the way: a. metal nuts from the hardware store b. marbles o Students need to know the type of course ahead of time and have similar types of terrains to practice on Final competition: Students have 3 chances to run the course and record their best time. The robot that completes the course and reaches the finish line fastest wins. Options for multiple-round competition: o Run on the same course each round, but narrow the robots competing each time o Each class designs and builds a course for the final competition. Set standard terrain options ahead of time that they can choose from (so everyone can practice for the same types of terrains). Each round of the competition is a different class‟ course, and all the robots compete in all the rounds. The winner is the one with the lowest total time across all the courses. o With each round, increase the length of the course and add a (pre-determined) reaction to a sensor. For example: 1. The second round of the race adds a distance sensor challenge. At the original course‟s finish line, put a vertical wall out of a big cardboard box or stack of books. Require that the robots turn left at the wall and travel to a new finish line, perhaps 10 feet away. Feel free to litter the new section of race course with more obstacles (hills, marbles, etc…) 2. For the third round add another wall where they have to turn a different direction and complete another longer section of the course Questions? Comments?
[email protected] 26 of 26