PALADYN Journal of Behavioral Robotics
Research Article · DOI: 10.2478/pjbr-2013-0003 · JBR · 2013 · 4(1) · 49-61
Robot Skill Learning: From Reinforcement Learning to Evolution Strategies
Freek Stulp1,2∗ , Olivier Sigaud3†
1
Robotics and Computer Vision ENSTA-ParisTech Paris, France 2 FLOWERS Team INRIA Bordeaux Sud-Ouest Talence, France
3 Institut des Systèmes Intelligents et de Robotique, Université Pierre Marie Curie CNRS UMR 7222, Paris
Received 17-05-2013
Abstract Policy improvement methods seek to optimize the parameters of a policy with respect to a utility function. Owing to current trends involving searching in parameter space (rather than action space) and using reward-weighted averaging (rather than gradient estimation), reinforcement learning algorithms for policy improvement, e.g. PoWER and PI2 , are now able to learn sophisticated high-dimensional robot skills. A side-effect of these trends has been that, over the last 15 years, reinforcement learning (RL) algorithms have become more and more similar to evolution strategies such as (µW , λ)-ES and CMA-ES. Evolution strategies treat policy improvement as a black-box optimization problem, and thus do not leverage the problem structure, whereas RL algorithms do. In this paper, we demonstrate how two straightforward simplifications to the state-of-the-art RL algorithm PI2 suffice to convert it into the black-box optimization algorithm (µW , λ)-ES. Furthermore, we show that (µW , λ)-ES empirically outperforms PI2 on the tasks in [36]. It is striking that PI2 and (µW , λ)-ES share a common core, and that the simpler algorithm converges faster and leads to similar or lower final costs. We argue that this difference is due to a third trend in robot skill learning: the predominant use of dynamic movement primitives (DMPs). We show how DMPs dramatically simplify the learning problem, and discuss the implications of this for past and future work on policy improvement for robot skill learning.
Accepted 18-07-2013 Keywords reinforcement learning · black-box optimization · evolution strategies · dynamic movement primitives
1. Introduction To improve the flexibility and adaptiveness of robots – important requirements for robots operating in human environments – an increasing emphasis is being placed on robots that acquire skills autonomously through interactions with the environment [29]. State-of-the-art reinforcement learning (RL) algorithms such as PoWER and PI2 are now able to learn very complex and high-dimensional robot skills [16, 33]. Over the last 15 years, several trends have facilitated the application of policy improvement to robotic skill learning: more effective and safer exploration (by searching in the parameter space rather than the action space), and more robust and safer parameter updates (by using reward-weighted averaging rather than gradient estimation). In this article, we give an overview of several policy improvement algorithms, and demonstrate that a side-effect of these trends has been that they have brought these algorithms closer and closer to evolution strategies such as CMA-ES (Section 2). Evolution strategies also use parameter space exploration and reward-weighted averaging, but treat policy improvement as a black-box optimization (BBO) problem, and thus do not leverage the problem structure, whereas RL algorithms do. Although previously “[t]here has been limited communication between these research fields” [37], this article contributes to a growing body of work that investigates, formalizes and empirically compares RL
∗ †
E-mail:
[email protected] E-mail:
[email protected]
and BBO approaches to policy improvement [5, 8, 9, 12, 25, 28, 31, 37]. In Section 3, we draw a strong bridge between RL and BBO, by showing that only two straightforward simplifications suffice to convert the state-of-the-art PI2 RL algorithm into the evolutionary strategy (µW , λ)-ES, a BBO algorithm which is the backbone of CMA-ES [6]. In our empirical comparison in Section 4, we make a rather surprising observation: (µW , λ)-ES – one of the most basic evolution strategies – is able to outperform state-of-the-art policy improvement algorithms such as PI2 and PoWER with policy representations typically considered in the robotics community. This observation raises a pertinent question: Why are much simpler algorithms that use less information able to outperform algorithms specifically designed for policy improvement? We argue that part of the answer to this question lies in a further trend in robotic skill learning with policy improvement: the predominant use of dynamic movement primitives (DMPs) [11] as the underlying policy. We highlight that, from the perspective of a learning algorithm, DMPs reduce the dimensionality of the action space by optimizing each dimension independently, and reduce the input state space for any task to 1 dimension. The aforementioned reductions simplify the learning problem so dramatically, that it immediately raises the key question of this paper: Is the recent success of applying RL algorithms to policy improvement for robot skill learning mainly due to improvements in the algorithms, or to the simplification of the problem by using DMPs as the policy representation? We believe this question to be of fundamental importance to robot skill learning. It sheds a new light on the robot skill learning results over the last years, and opens up several important future research directions, which we discuss in Section 6.
49
Brought to you by | Université Pierre & Marie Curie Authenticated Download Date | 5/28/15 12:49 PM
PALADYN Journal of Behavioral Robotics
Perturbation (of K roll-outs)
In summary, the main contributions of this article, which also determine its structure, are the following: Section 2: provide an overview of policy improvement methods, and argue how several algorithmic trends have moved these methods closer and closer to BBO. Section 3: demonstrate that two simplifications suffice to convert the state-of-the-art RL algorithm PI2 into the black-box evolution strategy (µW , λ)-ES. Section 4: show that (µW , λ)-ES empirically outperforms PI2 on the tasks in [36]. Section 5: uncover the role that DMPs have in the rather surprising empirical result above. Section 6: discuss the implications of these results.
Trajectory
Parameter update
N(0, (0,Σ) Σ) NN(0, Σ) .
.
.
ε .
θ
πθ .
ut. ..
E .
{τ k }k=1:K
. δθ θ new = θ +
θ new
xt
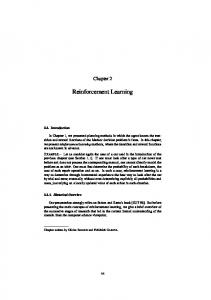
Figure 1. Generic policy improvement loop. In each iteration, the policy is executed K times. One execution of a policy is called a ‘Monte Carlo roll-out’, or simply ‘roll-out’. Because the policy is perturbed (different perturbation methods are described in Section 2.1.3), each execution leads to slightly different trajectories in state/action space, and potentially different rewards. The exploration phase thus leads to a set of different trajectories τ k=1...K . Based on these trajectories, policy improvement methods then update the parameter vector θ → θ new such that the policy is expected to incur lower costs/higher rewards. The process then continues with the new θ new as the basis for exploration.
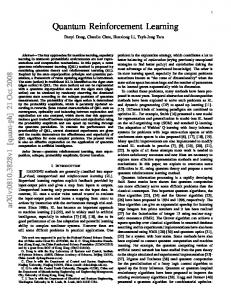
2. Background In RL, a policy π maps states to actions. An optimal policy π ∗ chooses the action that optimizes the cumulative discounted reward over time. When the state and actions sets of the system are discrete, finding an optimal policy π ∗ can be cast in the framework of discrete Markov Decision Processes (MDPs) and solved with, for instance, Dynamic Programming (DP) [34]. For problems where the state is continuous, many state approximation techniques exist in the field of Approximate Dynamic Programming (ADP) methods [22]. But when the action space also becomes continuous, the extension of DP or ADP methods results in optimization problems that have proven hard to solve in practice [26]. In such contexts, a policy cannot be represented by enumerating all actions, so parametric policy representations πθ are required, where θ is a vector of parameters. Thus, finding the optimal policy π ∗ corresponds to finding optimal policy parameters θ ∗ . As finding the globally optimal policy parameters θ ∗ is generally too expensive in the highdimensional spaces typical for robot skill learning, policy improvement methods are local methods, i.e. they will converge to the next local minimum. Choosing an initial parameter vector θ init that lies in the vicinity of θ ∗ may improve convergence towards θ ∗ ; in robotics θ init is usually acquired by bootstrapping through imitation learning [10, 33]. In episodic RL, on which this article focusses, the learner executes a task until a terminal state is reached. Executing a policy from an initial state until the terminal state, called a “Monte Carlo roll-out”, leads to a trajectory τ , which may contain information about the states visited, actions executed, and rewards received. Many policy improvement methods use an iterative process of exploration (where the policy is executed K times leading to a set of trajectories τ k=1...K ) and parameter updating (where the policy parameters θ are updated based on τ k=1...K ). This process is explained in more detail in the generic policy improvement loop in Figure 1. In this section, we give an overview of algorithms that implement this generic loop. We distinguish between three main classes of algorithms. The first class is based on putting lower bounds on the expected return (Section 2.1). The second are path integral solutions to stochastic optimal control (Section 2.2). The third class treats policy improvement as a black-box optimization (BBO) problem (Section 2.3). We highlight in particular whether these algorithms: 1) Perform action or parameter perturbation to foster exploration. 2) Use the scalar episode return or the rewards at each time step to perform an update. 3) Are actor-critic methods – which approximate a value function – or direct policy search methods – which do not. 4) Perform a parameter update by estimating the (natural) gradient or through reward-weighted averaging. The formulae referenced throughout this section are found in Figure 2.
2.1. Policy Improvement through Lower Bounds on the Expected Return We now briefly describe three algorithms that build on one another to achieve ever more powerful policy improvement methods, being REINFORCE [41], eNAC [20], and PoWER [16]. All these algorithms may be derived from a common framework based on the lower bound on the expected return, as demonstrated by Kober and Peters [16]. Since these algorithms have already been covered in extensive surveys [16, 19, 20], we do not present them in full detail here, and focus only on those properties that are relevant to the aims of this article. An underlying assumption of the algorithms presented in Section 2.1 and 2.2 is that the policies are represented as ut = ψ(x, t)| θ , where ψ is a set of basis functions, for instance Gaussian kernels, θ are the policy parameters, x is the state, and t is time since the roll-out started.
2.1.1. REINFORCE The REINFORCE algorithm [41] (“reward increment = nonnegative factor × offset reinforcement × characteristic eligibility”) uses a stochastic policy to foster exploration: ut = πθ (x) + ε t . Here, πθ (x) returns the nominal motor command1 , and ε t is a perturbation of this command at time t . In REINFORCE, this policy is executed K times with the same θ , and the states/actions/rewards that result from a roll-out are stored in a trajectory. Given K such trajectories, the parameters θ are then updated by first ˆ θ J(θ) (1) of the expected return J(θ) = estimating the ]gradient ∇ [
E
∑N
i=1 ri |πθ
. Here, the trajectories are assumed to be of equal
length, i.e. having N discrete time steps ti=1...N . The notation in Equaˆ θ J(θ) tion (1) (to the upper right in Figure 2) estimates the gradient ∇ d for each parameter entry d in the vector θ separately. Riedmiller et al. [23] provide a concise and lucid explanation how to derive (1). The
1
With this notation, the policy πθ (x) is actually deterministic. A truly stochastic policy is denoted as ut ∼ πθ (u|x) = µ(x) + ε t [23], where µ(x) is a deterministic policy that returns the nominal command. We use our notation for consistency with parameter perturbation, introduced in Section 2.1.3. For now, it is best to consider the sum πθ (x) + ε t to be the stochastic policy, rather than just πθ (x).
50
Brought to you by | Université Pierre & Marie Curie Authenticated Download Date | 5/28/15 12:49 PM
PALADYN Journal of Behavioral Robotics
baseline (2) is chosen so that it minimizes the variation in the gradient estimate [21]. Finally, the parameters are updated through steepest gradient ascent (3), where the open parameter α is a learning rate.
2.1.2.
eNAC
One issue with REINFORCE is that the ‘naive’, or ‘vanilla’2 , gradient ∇θ J(θ) it uses is sensitive to different scales in parameters. To find the true direction of steepest descent towards the optimum, independent of the parameter scaling, eNAC (“Episodic Natural Actor Critic”) uses the Fischer information matrix F to determine the ‘natural gradient’: θ new = θ + αF −1 (θ)∇θ J(θ). In practice, the Fischer information matrix need not be computed explicitly [20].
rather than πθ (x) + ε t . This distinction has been illustrated in Figure 2 (upper left charts). REINFORCE and eNAC estimate gradients, which is not robust when noisy, discontinuous utility functions are involved. Furthermore, they require the manual tuning of the learning rate α , which is not straightforward, but critical to the performance of the algorithms [16, 36]. The PoWER algorithm proposed by Kober and Peters [16] addresses these issues by using reward-weighted averaging, which rather takes a weighted average of a set of K exploration vectors ε k=1...K as in (8) in Figure 2. Here, K refers to the number of roll-outs, and ψti is a vector of the basis function activations at time ti . The computation of δθ (8) may be interpreted as taking the average of the perturbation vectors ε k , ∑K but weighting each with Stk / l=1 Stl , which is a normalized version of the reward-to-go Stk . Hence the name reward-weighted averaging. An important property of reward-weighted averaging is that it follows the natural gradient [1], without having to actually compute the gradient or the Fischer information matrix.
Another difference with REINFORCE is that eNAC uses a value function Vπθ as a compact representation of long-term reward. In continuous state-action spaces, Vπθ cannot be represented exactly, but must be estimated from data. Actor-critic methods therefore update the parameters in two steps: 1) approximate the value function from the point-wise estimates of the cumulative rewards in the roll-out trajectories τ k=1...K ; 2) update the parameters using the value function. In contrast, direct policy search methods such as REINFORCE update the parameters directly using the point-wise estimates3 . The main advantage of having a value function is that it generalizes; whereas K roll-outs provide only K point-wise estimates of the cumulative reward, a value function approximated from these K point-wise estimates is also able to provide estimates not observed in the roll-outs.
The final main difference between REINFORCE/eNAC and PoWER is the information contained in the trajectories τ k=1:K resulting from the roll-outs. For REINFORCE/eNAC, trajectories must contain information about the state and actions to compute ∇θ logπθ (ut |xt ) in the update. In PoWER the policy parameter perturbations ε t are stored rather than the output of the perturbed policy ut . And the activations of the basis functions ψt are stored rather than the states xt 5 . Finally, the rewards at each time step rt are required to compute the cost-to-go (6).
Summary from REINFORCE to eNAC. Going from REINFORCE
Summary from eNAC to PoWER. Going from eNAC to PoWER
to eNAC represents a transition from vanilla to natural gradients, and from direct policy search to actor-critic.
2.1.3.
represents a transition from action perturbation to policy parameter perturbation, from estimating the gradient to reward-weighted averaging, and from actor-critic back to direct policy search (as in REINFORCE).
PoWER
REINFORCE and eNAC are both ‘action perturbing’ methods which perturb the nominal command at each time step ut = unominal + εt . t Action-perturbing algorithms have several disadvantages: 1) Samples are drawn independently from one another at each time step, which leads to a very noisy trajectory in action space [25]. 2) Consecutive perturbations may cancel each other and are thus washed out [16]. The system also often acts as a low-pass filter, which further reduces the effects of perturbations that change with a high frequency. 3) On robots, high-frequency changes in actions, for instance when actions represent motor torques, may lead to dangerous behavior, or damage to the robot [25]. 4) It causes a large variance in parameter updates, an effect which grows with the number of time steps [16]. The “Policy Learning by Weighting Exploration with the Returns” (PoWER) algorithm therefore implements a different policy perturbation scheme first proposed by Rückstiess et al. [24], where the parameters θ of the policy, rather than its output4 , are perturbed, i.e. π[θ + ε t ] (x)
2.2. Policy Improvement with Path Integrals The Policy Improvement with Path Integrals (PI2 ) algorithm has its roots in path integral solutions of stochastic optimal control problems6 . In particular, PI2 is the application of Generalized Path Integral Control (GPIC) to parameterized policies [36]. In this article, we provide a posthoc interpretation of PI2 ’s update rule in Figure 2; for the complete PI2 derivation we refer to Theodorou et al. [36]. Given the roll-outs, let us now explain how PI2 updates the parameters (right block in Figure 2 labeled “PI2 ”). First, the cost-to-go Si,k is computed for each of the K roll-outs and each time step i = 1 . . . N . The terminal cost ϕN and immediate costs ri are task-dependent and provided by the user7 . Mj,k is a projection matrix onto the range space of ψj under the metric R−1 , cf. [36]. The probability of a roll-out Pi,k is computed as the normalized exponentiation of the cost-to-go. This assigns high probabilities to low-cost roll-outs and vice versa. The intuition behind this step is that trajectories of lower cost should have
2
‘Vanilla’ refers to the canonical version of an entity. The origin of this expression lies in ice cream flavors; i.e. ‘plain vanilla’ vs. ‘non-plain’ flavors, such as strawberry, chocolate, etc. 3 The point-wise estimates are sometimes considered to be a special type of critic; in this article we use the term ‘critic’ only when it is a function approximator. 4 In the PoWER derivation, the policy π(u|x, t) is defined as u = θ | ψ(x, t) + ε(ψ(x, t)). By choosing the state-dependent exploration as | ε(ψ(x, t)) = ε t ψ(x, t), and plugging it into the policy definition, we | acquire u = θ | ψ(x, t) + ε t ψ(x, t). See also equations on page 8 and 9 of [16]. When rewriting this as u = (θ + ε t )| ψ(x, t), we see that the policy parameters θ are perturbed directly. This form of the perturbed policy is most clearly described in Appendix A.3 of [16].
5
In the original formulation (Algorithm 4 of [16]), x and t are also stored, and then used to compute ψ(x, t) in the update. Since the parameters θ do not depend on the state, and the sum in (8) is only over t (i.e. not over x), we may store only ψt instead. The only difference is whether ψ(x, t) is computed during the roll-out (in which case we need x in the trajectory), or afterwards (in which case we do not). The same holds for r(xt , ut , xt+1 , t), which may also be stored as rt . 6 Note that in the previous section, algorithms aimed at maximizing rewards. In optimal control, the convention is rather to define costs, which should be minimized. 7 In PI2 , r is split into immediate costs q and command costs 1 θ T Rθ , i t i 2 i with command cost matrix R.
51
Brought to you by | Université Pierre & Marie Curie Authenticated Download Date | 5/28/15 12:49 PM
PALADYN Journal of Behavioral Robotics
Parameter update
. εt ut
{
+
⟨ rt τk =
ut + ε
.
πθ
k=1
, 1 xt1 , ut1 ,
rt2 , ..., rtN xt2 , ..., xtN ut2 , ..., utN
⟩}
(1)
.
( )2 ∇θ log π(utj ,k |xtj ,k ) rti ,k d )2 ∑K ∑i ( k=1 j=1 ∇θ d log π(utj ,k |xtj ,k )
∑K
bdti =
∑i
j=1
ˆ θ J(θ) θ new = θ + α ∇
(2) (3)
θ new
k=1:K
E .
xt
.
δθ = αF −1 (θ)∇θ J(θ)
(4)
θ new = θ + δθ
Stki =
∑
N k j=i rj
( [ δθ =
θ new
(6) ])−1 ( [
N ∑
Mti Sti
E
K ∑ N ∑
≈
)−1 ( Mti Stki
])
N ∑
E
.
i=1
(
(5)
eNAC
.
Mti ε ti Sti ) Mti ε kti Stki
k=1 i=1 |
k=1 i=1 |
(7)
i=1
K ∑ N ∑
with Mti = ψti ψti (ψti Σψti )−1
(8)
PoWER
θ
K N i 1 ∑ ∑∑ ∇θ log π(utj ,k |xtj ,k )(rti ,k − bd ti ) d K k=1 i=1 j=1
N (0, Σ) .
Gradient-based
Action perturbation
ˆ θ J(θ) = ∇ d
.
REINFORCE
Trajectory
Perturbation
θ new
(9)
θ new = θ + δθ
(10)
N (0, Σ) .
.
εt +
θ + εt
.
πθ +ε t
E
.
.
Parameter update for each time step
xt
Stki = ϕtkN +
N−1 ∑
rtkj
(11)
e Ptki = ∑ K
k=1 [e
i
− 1λ Stk
i
K [ ∑
]
Mti ε kti Ptki
δθ ti =
]
(12)
.
(13)
PI2
Parameter perturbation
j=i − 1λ Stk
θ new
k=1
with Mtj = R−1 ψtj ψtTj (ψtTj R−1 ψtj )−1 Temporal averaging over time steps ∑N−1 i=0 (N − i) [wti ]b [δθ ti ]b [δθ]b = ∑N−1 i=0 (N − i) [wti ]b
(14)
Reward-weighted averaging
θ
{ ⟨ rt , rt , ..., rt ⟩} 1 2 N τ k = ψt1 , ψt2 , ..., ψtN ε t1 , ε t2 , ..., ε tN k=1:K
ut
(15)
Actual parameter update θ new = θ + δθ
(16)
black-box cost function
N (0, Σ)
θ
{
.
ε + .
θ+ε
πθ +ε
⟨ τk =
ut
∑ R = N i=1 rti
⟩}
ε
k=1:K
E
.
.
xt
(g)
(g)
(g)
(g)
(g)
(g)
ε 1;λ , ε 2;λ , . . . ε µ;λ ε µ+1;λ , ε µ+2;λ , . . . ε λ;λ , | {z } | . {z } Recombine Discard ∑µ k=1 wk xk;λ new ∑ θ =θ+ µ l=1 wl
(17)
(18)
(µW , λ)-ES
.
θ new
Figure 2. Illustrations of different policy improvement algorithms. The right (green) blocks depict the exploration method (action or parameter perturbing). The center column depicts the information stored in the trajectories. This information is required to perform the parameter update. The right column shows how the different algorithms update the parameters.
higher probabilities. The interpretation of Pi,k as a probability follows from applying the Feynman-Kac theorem to the SOC problem, cf. [36]. The key algorithmic step is in (13), where the parameter update δθ is computed for each time step i through weighted averaging over the exploration ε of all K trials. Trajectories with higher probability Pi,k (due to a lower cost Si,k ) therefore contribute more to the parameter update. A different parameter update δθ i is computed for each time step. To acquire one parameter vector θ , the time-dependent updates must be averaged over time, one might simply use the mean parameter vector ∑N over all time steps: δθ = N1 i=1 δθ i . Although such temporal averaging is necessary, the particular weighting scheme used in temporal averaging does not follow from the derivation. Rather than a simple
mean, Theodorou et al. [36] suggest the weighting scheme in Eq. (15). It emphasizes updates earlier in the trajectory, and also makes use of the activation of the j th basis function at time step i, i.e. wj,i (32). As demonstrated in [36], PI2 is able to outperform the previous RL algorithms for parameterized policy learning described in Section 2.1 by at least one order of magnitude in learning speed (number of roll-outs to converge) and also lower final cost performance. As an additional benefit, PI2 has no open algorithmic parameters, except for the magnitude of the exploration noise Σ, and the number of trials per update K . Although having been derived from very different principles, PI2 and PoWER use identical policy perturbation methods, and have very similar update rules, i.e. compare the piecewise similarity of equations
52
Brought to you by | Université Pierre & Marie Curie Authenticated Download Date | 5/28/15 12:49 PM
PALADYN Journal of Behavioral Robotics
(6)/(11), (8)/(13), and (9)/(14) in Figure 2. The shared core step ∑K of reward-weighted averaging is apparent in k=1 Mti ε ti Sti (8) and
∑K
k=1
x(g+1) = x(g) +
1 ∑ µ (g) k=1 ε k;λ µ
(21)
Mti ε kti Ptki (13). The main difference is that PoWER requires the
cost function to behave as improper probability, i.e. be strictly positive and integrate to a constant number. This constraint can make the design of suitable cost functions more complicated [36]. For cost functions with the same optimum in PoWER’s pseudo-probability formulation and PI2 cost function, “both algorithms perform essentially identical” [36]. Another difference is that matrix inversion in PoWER’s parameter update (8) is not necessary in PI2 . Summary comparison of PoWER and PI2 . PI2 and PoWER use identical policy perturbation methods and very similar update rules. The main difference is that PI2 allows for more flexible cost function design.
2.3.
A variation on this algorithm is (µW , λ)-ES [6], where the recombination is a weighted average, with weight vector wi...µ , cf. (24). Thus, (µ, λ)-ES is a special case of (µW , λ)-ES where the weights are all µ1 . To make this relation explicit, (µ, λ)-ES is sometimes written as (µI , λ)-ES. Another variation is to sample from a multi-variate Gaussian distribution with covariance matrix σ N (0, Σ) [6], rather than sampling using a scalar matrix σ N (0, 1) ≡ N (0, σ 2 I) as in (19). These two variations lead to what we refer to as (µW , λ)-ES in the rest of this article; it is visualized in the bottom row of Figure 2, and repeated in (22)-(24). (g)
Policy Improvement as Black-Box Optimization
∀k = 1 . . . λ : ε k = σ N (0, Σ) (g) (g) ε 1;λ , . . . ε µ;λ
As is pointed out by Rückstiess et al. [25], “the return of a whole
|
RL episode can be interpreted as a single fitness evaluation. In this case, parameter-based exploration in RL is equivalent to black-box optimization.”. This constitutes a qualitatively different approach to policy improvement, because it considers only the scalar return of an episode, and does not take into account the state/action pairs visited, or the rewards received at each time step. Considering policy improvement as a black-box optimization (BBO) problem allows generic BBO algorithms, such as evolution strategies, to be applied to policy improvement. We now present the basic formalization underlying BBO and evolution strategies, and then describe evolution strategies that have been applied to policy improvement.
2.3.1.
Evolution Strategies
Optimization aims at finding the best solution x ∗ that optimizes an objective function J , i.e. x ∗ = argmax J(x). In continuous optimization, X is a continuous solution space in Rd . In black-box optimization, J is unknown – a black-box – and the optimum can thus not be determined analytically. Evolution strategies (ES) are algorithms for solving continuous BBO problems. They belong to the class of evolutionary algorithms, which use mutation, recombination, and selection to iteratively acquire increasingly good (populations of) candidate solutions [3]. One of the most basic ES algorithms is the standard (µ, λ)-ES, with global intermediate recombination8 in object parameter space X [3, 27], listed in (19)-(21). This algorithm first generates λ mutated offspring9 from the parent parameter vector x(g) , by sampling λ perturba(g) tion vectors ε k from a Gaussian distribution (19). It then updates the parent through recombination, by taking the mean of the µ offspring with the best utilities J(xk ). In (21), xk;λ denotes the k -th best offspring individual. The updated parameter x then serves as the parent for the next generation.
(g)
∀k = 1 . . . λ : ε k = σ N (0, I) (g) (g) ε 1;λ , . . . ε µ;λ
|
{z
}
Low cost: Recombine
,
(g) (g) ε µ+1;λ , . . . ε λ;λ
|
{z
}
Mutate
(19)
Select
(20)
{z
}
,
Low cost: Recombine
x(g+1)
(g) (g) ε µ+1;λ , . . . ε λ;λ
|
{z
}
Mutate
(22)
Select
(23)
Recombine
(24)
High cost: Discard
∑µ k=1 wk xk;λ = x(g) + ∑ µ l=1 wl
These rather simple algorithms form the core of state-of-the-art optimization algorithms such as the Cross-Entropy Method (CEM) with Gaussian distributions 10 and Covariance Matrix Adaptation - Evolutionary Strategy (CMA-ES, the full name is (µW , λ)-CMA-ES)11 .
2.3.2. Policy Improvement with Evolution Strategies Because ES algorithms treat the objective function as a black-box function, they can readily be applied to policy improvement, by 1) interpreting the inputs x to the objective function as policy parameter vectors, which we denote θ , and 2) having the objective function return a scalar that is the return of an episode, i.e. the sum of the rewards ∑ R= N i=1 ri . With this translation, “generate perturbation” in Figure 1 thus corresponds to “mutation” in (19), and the “parameter update” to “recombination” in (21). From the point of view of the optimization algorithm, the roll-out of the policy is completely encapsulated within the blackbox objective function; the algorithm is agnostic about whether it is optimizing a set of policy parameters for a robotic task, or the function J(θ) = θ 2 . Examples of BBO algorithms that have been applied to policy improvement include CEM [4, 17], CMA-ES [8, 25], PGPE [28] and Natural Evolution Strategies (NES) [40].
2.4. Summary REINFORCE is a direct policy search method that uses action perturbation and gradient-based parameter updates. A main advantage of eNAC over REINFORCE is that it uses the natural gradient, rather than the vanilla gradient. PoWER, although sharing much of its derivation with REINFORCE and eNAC, introduces three main adaptations to eNAC: 1) it perturbs the policy parameters rather than the actions,
High cost: Discard 10
8
Recombine
The complete notation would be (µ/ρ, λ)-ES, but as in [6], we set ρ = µ and drop ρ. 9 In the RL algorithms of previous sections, the capital letter K is used instead of the symbol λ.
Without covariance matrix adaptation, i.e. by dropping (34) [1] from CEM, it is equivalent to (µI , λ)-ES. 11 With the algorithmic parameters C(0) = I and c = 0 in (15) and c = µ σ 0 in (34) in [7], step-size adaptation and covariance matrix adaptation are switched off, and in this case CMA-ES reduces to (µW , λ)-ES.
53
Brought to you by | Université Pierre & Marie Curie Authenticated Download Date | 5/28/15 12:49 PM
PALADYN Journal of Behavioral Robotics
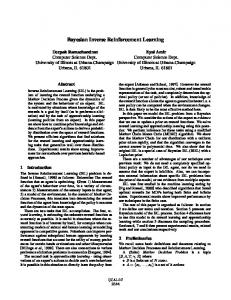
which leads to safer, more informative exploration. 2) it is based on reward-weighted averaging rather than gradient estimation, which leads to more robust parameter updates. 3) it is completely modelfree, and does not require policy derivatives. Figure 3 visualizes the chronology of this derivation, and classifies the algorithms according to several algorithmic properties. Although PI2 is derived from very different principles and based on Generalized Path Integral Control (GPIC), it is very similar to PoWER. They were introduced nearly simultaneously, and share the three advantages above. Additionally, PI2 places less constraints on cost functions, facilitating their design in practice. If the return of an episode is interpreted as a single fitness evaluation, policy improvement may be considered a BBO problem [25]. This allows policy improvement to be solved by BBO algorithms, for example evolution strategies such as (µW , λ)-ES, CEM, or CMA-ES. Figure 3 highlights one of the main sources of inspiration for this work: policy improvement algorithms based on reinforcement learning have become more and more similar to evolution strategies such as CEM and CMA-ES. This raises several questions: 1) What exactly is the characteristic difference between BBO and RL, and which modifications are necessary to convert an RL algorithm for policy improvement, such as PI2 , into a BBO algorithm, such as (µW , λ)-ES? 2) How do BBO variants of RL algorithms compare in terms of performance? We address these questions in Section 3 and 4 respectively.
Trajectory?
states/actions/rewards
Actor-Critic?
Update?
vanilla. gradient
natural. gradient reward. weighted averaging
.
(per time step)
action
Perturbation?
.
.
parameter
(per time step)
.
(constant)
direct policy search
act.-critic .
.
. REINFORCE
PGPE
.
.
FD
. eNAC
.
.
.
GPIC
.
. NES
PoWER
CMA-ES . CEM ?
.
PI2
In this section, we present three previously proposed alternative exploration methods [31, 35, 36] for PI2 . In the canonical version of PI2 , the policy parameters are perturbed with a different perturbation at each time step, i.e. ε t ∼ N (0, Σ). We refer to this version of PI2 as PI2 . , where the small (blue) symbol serves as a mnemonic to indicate that exploration varies at a high frequency. In practice, this time-varying exploration has several disadvantages, which have been pointed out in Section 2.1.3. In practical applications of PI2 , the noise is therefore not varied at every time step. For instance, Theodorou et al. [36] and Tamosiumaite et al. [35] generate exploration noise only for the basis function with the highest activation. We refer to this second method as PI2 with exploration per basis function, or PI2 . , where the small (green) symbol serves as a mnemonic of the shape of the exploration for one basis function. Alternatively, ε ti ,k can be set to have a constant value during a rollout [33]. Or, as Sehnke et al. [28] explain “parameters are sampled
from [the] distribution at the start of each sequence, and thereafter the controller is deterministic.” Thus, for each of the K rollouts, we generate ε k exploration vectors before executing the policy, and keep it constant during the execution, i.e. ε ti ,k = ε k . We call this ‘PI2 with constant exploration’, and denote it as PI2 . , where the horizontal line indicates a constant value over time. Note that ε k will still have a temporally extended effect, because it is multiplied with a basis function that is active throughout an extended part of the movement.
3.2. Simplifying the Parameter Update
(return) .
.
(per time step)
..
rewards only .
.
(per time step)
3.1. Simplifying the Exploration Method
Figure 3. Classification of policy improvement algorithms, given a selection of their properties as discussed throughout Section 2.
3. From PI2 to (µW , λ)-ES Figure 3 suggests that two modifications are required to convert PI2 into a BBO algorithm. First of all, the policy perturbation method must be adapted. PI2 and BBO both use policy parameter perturbation, but in PI2 it varies over time (i.e. θ + ε t ), whereas it must remain constant over time in BBO (i.e. θ + ε ). In Section 3.1, we therefore simplify the perturbation method in PI2 to be constant over time, which yields the algorithm variation PI2 . . Second, we must adapt PI2 such that it is able to update the parameters based only on the scalar episode return ∑ R= N i=1 rti , rather than having access to the reward rt at each time step t . This is done in Section 3.2.
The PI2 parameter update leads to a new parameter vector θ ← θ + δθ . However, a different parameter update is computed for each time step δθ ti =1...N . Therefore, there is a need to condense the N parameters updates δθ ti =1...N into one update δθ . This step is called temporal averaging, and was proposed by Theodorou et al. [36] as:
∑N [δθ]d =
i=1 (N − i + 1) wd,ti [δθ ti ]d . ∑N i=1 wd,ti (N − i + 1)
(25)
This temporal averaging scheme emphasizes updates earlier in the trajectory, and also makes use of the basis function weights wd,ti . However, since this does not directly follow from the derivation “[u]sers
may develop other weighting schemes as more suitable to their needs.” [36]. As an alternative, we now choose a weight of 1 at the first time step, and 0 for all others. This means that all updates δθ ti are discarded, except the first one δθ t1 , which is based on the cost-to-go at the first time step Stk1 . By definition, the cost-to-go at t1 represents
the cost of the entire trajectory. This implies that we must only compute the cost-to-go Stki and probability Ptki for i = 1. Simplifying temporal averaging in this way depends strongly on using constant exploration noise during a roll-out. If the noise varies at each time step or per basis function, the variation at the first time step ε t1 ,k is not at all representative for the variations throughout the rest of the trajectory. Finally, as demonstrated in [32], the projection matrix M may be dropped from the the parameter update in (13), which is our second simplification to the update rule. This simplified PI2 variant, with constant exploration noise and without temporal averaging, is listed at the center of Figure 4. The lines that are dropped from PI2 are highlighted with (dark) red banner; the reason for it being dropped is indicated by a label X. (constant exploration over
54
Brought to you by | Université Pierre & Marie Curie Authenticated Download Date | 5/28/15 12:49 PM
PALADYN Journal of Behavioral Robotics
Figure 4. Line by line comparison of PI2 (left), (µW , λ)-ES (right) and (λW PI 2 , λ)-ES (center). Red areas (dark) indicate that a line is dropped from PI2 or (µW , λ)-ES, (light) gray areas indicate a modification. The blue area represents the black-box cost-function used in (λW PI 2 , λ)-ES. This graph illustrates that (λ PI 2 , λ)-ES is a special case of both PI2 and (µW , λ)-ES. W
time), T. (no temporal averaging) and M. (drop the projection matrix M). Note that we have dropped the subscript i in this center algorithm, because it is the same i=1 for all.
3.3.
Simplified PI2 is a special case of (µW , λ)-ES
We now demonstrate that the simplified PI2 is a special case of the generic (µW , λ)-ES algorithm. First, we choose µ = λ. This means that all of the samples are used for the parameter update (recombination), and none of the worst are discarded12 . Then, the weights W in (µW , λ)-ES are chosen to be the weights of PI2 , i.e. the weights wk = Pk . Finally, the step-size σ is set to 1, such that exploration is entirely determined by the covariance matrix Σ. In Figure 4, these parameter choices have been denoted µ. , P. , and σ. respectively. We 2
denote this specific case of (µW , λ)-ES as (λW PI 2 , λ)-ES, where W PI indicates that the weights W are set to the trajectory probabilities as determined by PI2 .
12
In the footnote on page 919 of [35], Tamosiumaite et al. provide an anecdotal account of testing (µW , λ)-ES variants of PI2 , where µ ̸= λ: “For example, we did some experiments with PI2 , by introducing a discount factor, as well as using only the best trials of the epoch for weight update [. . . ] Most of these modification did not significantly change learning success.”
Summary from PI2 and (µW , λ)-ES to (λW PI 2 , λ)-ES. By choosing constant exploration noise and switching off temporal averaging, PI2 can be reduced to a special case of (µW , λ)-ES, with µ = λ, σ = 1, and wk = Pk . (λW PI 2 , λ)-ES is thus a special case of both PI2 and (µW , λ)-ES. We find it very striking that an algorithm that has been derived from stochastic optimal control with solution methods from quantum mechanics [13, 36] shares a common core with an older algorithm from the quite distinct field of evolution strategies.
4. Empirical Comparison The aim of this section is to empirically compare the different exploration variants of PI2 (PI2 . , PI2 . , PI2 . ) as well as PI2 ’s BBO variant (λW PI 2 , λ)-ES. The comparison is done in terms of convergence speed and final cost of the optimized policy. The experiments are based on the same tasks as presented by Theodorou et al. [36], and described in Appendix A. The main advantage of using these same tasks is that it enables a direct comparison with the results reported by Theodorou et al. [36]. Furthermore, it alleviates us of the need to demonstrate that PI2 outperforms REINFORCE, eNAC and PoWER on these tasks, because this was already done by Theodorou et al. [36]. For each learning session, we are interested in comparing the convergence speed and final cost, i.e. the value to which the learning curve converges. Convergence speed is measured as the parameter update after which the cost drops below 5% of the initial cost before learning. The final cost is the mean cost over the last 100 updates. For all
55
Brought to you by | Université Pierre & Marie Curie Authenticated Download Date | 5/28/15 12:49 PM
PALADYN Journal of Behavioral Robotics
tasks and algorithm settings, we execute 10 learning sessions (which together we call an ‘experiment’), and report the µ ± σ over these 10 learning sessions. For all experiments, the DMP and PI2 parameters are the same as in [36], and listed in Appendix A.
becomes 2.09, 1, 0.75, 0.40 (see bold numbers in Figure 5 and Figure 6). The same normalization is done for the final costs. This normalization makes it easier to compare differences between algorithms, independent of the arbitrary scales in costs between the different tasks.
Figure 5 summarizes the results13 of comparing the four variants of PI2 : the three different exploration methods with temporal averaging (PI2 . , PI2 . , PI2 . ), and PI2 without temporal averaging, which is equivalent to (λW PI 2 , λ)-ES. The learning curves are the µ ± σ over 10 learning sessions for Task 4. To evaluate the convergence speed, we determine when each of the learning curves drops below 5% of the cost before learning, as highlighted in the left graph. The means of these values for the three exploration methods are visualized as vertical lines in the left graph of Figure 5. At the top of these lines, a horizontal bar represents the standard deviation. For convergence we see that (λW PI 2 , λ)-ES