Jun 28, 2010 - Aerospace Engineering. Hanspeter ...... Optical Sensors,â American Astronautical Society, AAS Paper 07-312, August 2007. [162] Singla, P.
Robust Adaptive Estimation for Autonomous Rendezvous in Elliptical Orbit
Christopher D. Karlgaard
Dissertation submitted to the Faculty of the Virginia Polytechnic Institute and State University in partial fulfillment of the requirements for the degree of
Doctor of Philosophy in Aerospace Engineering
Hanspeter Schaub, Chair Christopher D. Hall, Co-Chair Hans Seywald Cornel Sultan Craig A. Woolsey
June 28, 2010 Blacksburg, Virginia
Keywords: Robust Estimation; Adaptive Estimation; Rendezvous Copyright 2010, Christopher D. Karlgaard
Robust Adaptive Estimation for Autonomous Rendezvous in Elliptical Orbit
Christopher D. Karlgaard
(ABSTRACT)
The development of navigation filters that make use of robust estimation techniques is important due to the sensitivity of the typical minimum `2 norm techniques, such as the Kalman filter, to deviations in the assumed underlying probability distribution. In particular, those distributions with thicker tails than the Gaussian distribution can give rise to erratic filter performance and inconsistency of results. This dissertation discusses the development of an adaptive discrete-time robust nonlinear filtering technique based on a recursive form of Huber’s mixed minimum `1 /`2 norm approach to estimation, which is robust with respect to deviations from the assumed Gaussian error probability distributions inherent to the Kalman filter. This mixed norm approach is applied to a type of Sigma-Point Kalman filter, known as the Divided Difference Filter, which can capture second–order effects of nonlinearities in the system and measurement dynamics. Additionally, if these assumed parameters of the distribution differ greatly from the true parameters, then the filter can exhibit large errors and possibly divergence in nonlinear problems. This behavior is possible even if the true error distributions are Gaussian. To remedy these problems, adaptive filtering techniques have been introduced in order to automatically tune the Kalman filter by estimating the measurement and process noise covariances, however these techniques can also be highly sensitive to the nature of the underlying error distributions. The Huber–based formulations of the filtering problem also make some assumptions regarding the distribution, namely the approach considers a class of contaminated densities in the neighborhood of the Gaussian density. Essentially the method assumes that the statistics of the main Gaussian density are known, as well as the ratio or percentage of the contamination. The technique can be improved upon by the introduction of a method to adaptively estimate the noise statistics along with the state and state error covariance matrix. One technique in common use for adaptively estimating the noise statistics in real–time filtering applications is known as covariance matching. The covariance matching technique is an intuitively appealing approach in which the measurement noise and process noise covariances are determined in such a way that the true residual covariance matches the theoret-
ically predicted covariance. The true residual covariance is approximated in real time using the sample covariance, over some finite buffer of stored residuals. The drawback to this approach is that the presence of outliers and non-Gaussianity can create problems of robustness with the use of the covariance matching technique. Therefore some additional steps must be taken to identify the outliers before forming the covariance estimates. In this dissertation, an adaptive scheme is proposed whereby the filter can estimate the process noise and measurement noise covariance matrices along with the state estimate and state estimate error covariance matrix. The adaptation technique adopts a robust approach to estimating these covariances that can resist the effects of outliers. The particular outlier identification method employed in this paper is based on quantities known as projection statistics, which utilize the sample median and median absolute deviation, and as a result are highly effective technique for multivariate outlier identification. These projection statistics are then employed as weights in the covariance matching procedure in order to reduce the influence of the outliers. The hybrid robust/adaptive nonlinear filtering methods introduced in this dissertation are applied to the problem of 6-DOF rendezvous navigation in elliptical orbit. The full nonlinear equations of relative motion are formulated in spherical coordinates centered on the target orbit. A relatively simple control law based on feedback linearization is used to track a desired rendezvous trajectory. The attitude dynamics are parameterized using Modified Rodrigues Parameters, which are advantageous for both control law development and estimation since they constitute a minimal 3-parameter attitude description. A switching technique which exploits the stereographic projection properties of the MRP coordinate is utilized to avoid singularities which inevitably arise in minimal attitude descriptions. This dissertation also introduces the proper covariance transformations associated with the singularity avoidance switching technique. An attitude control law based on backstepping is employed to track the target vehicle. A sensor suite consisting of a generic lidar or optical sensor, an Inertial Measurement Unit, consisting of accelerometers and gyroscopes, a star tracker, and a horizon sensor are utilized to provide measurement data to the navigation filters so that the chaser vehicle can estimate its relative state during the rendezvous maneuver. Several filters are implemented for comparison, including the Extended Kalman Filter, First and Second–Order Divided Difference Filters and Huber–based generalizations of these filters that include adaptive techniques for estimating the noise covariances. Monte-Carlo simulations are presented which include both Gaussian and nonGaussian errors, including mismatches in the assumed noise covariances in the navigation filters in order to illustrate the benefits of the robust/adaptive nonlinear filters. Additionally, computational burdens of the various filters is compared.
iii
Acknowledgments I am extremely grateful to Dr. Hanspeter Schaub for volunteering his time to serve as my advisor, especially for staying with me after leaving Virginia Tech to take a position at the University of Colorado. I hope that we can continue to collaborate on other research topics in the years to come. I am also grateful to Dr. Chris Hall for serving as my committee co-chair and to Dr. Craig Woolsey and Dr. Cornel Sultan for serving as committee members. I owe a considerable debt of gratitude to Dr. Hans Seywald for taking time from his busy schedule as President of AMA to serve on my committee, including traveling to Blacksburg to participate in my examinations. I am also thankful for the help I have received from Rachel Hall Smith on procedural matters in the department and the university. Over the course of this research I have had the opportunity to publish several papers in journals. The comments and suggestions by editors and reviewers has been extremely helpful. In particular, I am thankful to Dr. John Crassidis, Dr. Todd Humphreys, Dr. Kathleen Howell, and several anonymous reviewers. Last but not least I could not have accomplished this research without the support of my friends and family. I am especially thankful to my wonderful wife, Lissa for all her support over the last six years while I have been working full-time at AMA and part-time towards this dissertation.
iv
Contents List of Figures
ix
List of Tables
x
1 Introduction 1.1 Autonomous Rendezvous of Spacecraft . . . . 1.2 State Estimation . . . . . . . . . . . . . . . . 1.2.1 Some History of Robust Estimation . 1.2.2 Adaptive State Estimation . . . . . . 1.2.3 Recent Advances in State Estimation 1.3 Attitude Estimation . . . . . . . . . . . . . . 1.4 Contributions . . . . . . . . . . . . . . . . . . 1.5 Overview . . . . . . . . . . . . . . . . . . . .
. . . . . . . .
. . . . . . . .
2 Some Concepts in Regression Theory 2.1 Introduction . . . . . . . . . . . . . . . . . . . . . 2.2 Maximum Likelihood Estimation . . . . . . . . . 2.2.1 Overview of the Method . . . . . . . . . . 2.2.2 Correlated Residuals . . . . . . . . . . . . 2.2.3 Consistency, Efficiency, and Bias . . . . . 2.2.3.1 Consistency . . . . . . . . . . . . 2.2.3.2 Efficiency . . . . . . . . . . . . . 2.2.3.3 Bias . . . . . . . . . . . . . . . . 2.2.4 Example: Maximum Likelihood Estimator 2.2.5 Example: Maximum Likelihood Estimator 2.3 Generalized Maximum Likelihood Estimation . . 2.3.1 Overview of the Method . . . . . . . . . . 2.3.2 Robustness Concepts and Measures . . . 2.3.2.1 Qualitative Robustness . . . . . 2.3.2.2 Global Robustness . . . . . . . . 2.3.2.3 Local Robustness . . . . . . . . 2.3.3 Example of a Gaussian Mixture . . . . . . 2.3.4 Example of a Gaussian–Cauchy Mixture . 2.3.5 Choice of Tuning Parameter . . . . . . . .
v
. . . . . . . .
. . . . . . . .
. . . . . . . . . . . . . . . . for for . . . . . . . . . . . . . . . . . .
. . . . . . . .
. . . . . . . .
. . . . . . . .
1 1 4 5 8 10 13 14 14
. . . . . . . . . . . . . . . . . . . . . . . . . . . . . . . . . . . . . . . . . . . . . . . . . . . . . . . . . . . . . . . . . . . . . . . . . . . . . . . . . . . . . . . . . . . . . . . . . . . . . . . . . . . . . . . . . . . . . . . . . . . . . . . . the Gaussian Distribution . the Laplacian Distribution . . . . . . . . . . . . . . . . . . . . . . . . . . . . . . . . . . . . . . . . . . . . . . . . . . . . . . . . . . . . . . . . . . . . . . . . . . . . . . . . . . . . . . . . . . . . . . . . . . . . . . . . . . . . . . . . . . . . . . . . . . . . . . . . . . . . . . . . . . . . . . . .
. . . . . . . . . . . . . . . . . . .
. . . . . . . . . . . . . . . . . . .
16 16 16 16 17 18 18 18 18 18 19 20 20 21 21 22 23 23 26 26
. . . . . . . .
. . . . . . . .
. . . . . . . .
. . . . . . . .
. . . . . . . .
. . . . . . . .
. . . . . . . .
. . . . . . . .
. . . . . . . .
. . . . . . . .
. . . . . . . .
. . . . . . . .
. . . . . . . .
. . . . . . . .
. . . . . . . .
2.4
2.5
2.6 2.7
2.3.6 The Huber Estimator as a Maximum Likelihood Estimator Leverage Points . . . . . . . . . . . . . . . . . . . . . . . . . . . . . 2.4.1 The Mahalanobis Distances . . . . . . . . . . . . . . . . . . 2.4.2 Projection Statistics . . . . . . . . . . . . . . . . . . . . . . 2.4.3 Simple Example of Leverage Point Identification . . . . . . Modified Generalized Maximum Likelihood Estimation . . . . . . . 2.5.1 Mallows Form . . . . . . . . . . . . . . . . . . . . . . . . . . 2.5.2 Schweppe Form . . . . . . . . . . . . . . . . . . . . . . . . . 2.5.3 Weighting Function . . . . . . . . . . . . . . . . . . . . . . Numerical Solution of the Implicit Likelihood Equation . . . . . . Examples in Linear Regression . . . . . . . . . . . . . . . . . . . . 2.7.1 A Simple Example Without Leverage Points . . . . . . . . 2.7.2 Example With a Single Bad Leverage Point . . . . . . . . . 2.7.3 Examples With Multiple Leverage Points . . . . . . . . . . 2.7.3.1 Example with Good and Bad Leverage Points . . 2.7.3.2 Example with Two Bad Leverage Points . . . . .
3 Dynamic State Estimation 3.1 Introduction . . . . . . . . . . . . . . . . . . . . . . . . . . . . 3.2 Robust Extended Kalman Filter . . . . . . . . . . . . . . . . 3.3 Robust Divided Difference Filtering . . . . . . . . . . . . . . 3.3.1 Overview of the DD1 Filter . . . . . . . . . . . . . . . 3.3.2 Overview of the DD2 Filter . . . . . . . . . . . . . . . 3.3.3 Modification of Measurement Update Equations Using 3.4 Adaptive Filtering For Unknown Noise Statistics . . . . . . . 3.4.1 Myers–Tapley Method . . . . . . . . . . . . . . . . . . 3.4.2 Modified Myers–Tapley Method . . . . . . . . . . . . . 3.4.2.1 Robust Covariance Estimation . . . . . . . . 3.4.2.2 Estimation of the Contamination Parameter 3.4.2.3 Fading Memory Filter . . . . . . . . . . . . .
. . . . . . . . . . . . . . . .
. . . . . . . . . . . . . . . .
. . . . . . . . . . . . . . . .
. . . . . . . . . . . . . . . .
. . . . . . . . . . . . . . . .
. . . . . . . . . . . . . . . .
. . . . . . . . . . . . . . . .
. . . . . . . . . . . . . . . .
. . . . . . . . . . . . . . . .
. . . . . . . . . . . . . . . .
28 29 29 30 31 33 33 34 34 35 35 35 36 37 38 39
. . . . . . . . . . . . . . . . . . . . . . . . . . . . . . . . . . . . . . . . . . . . . . . . . . . . . . . Huber’s Technique . . . . . . . . . . . . . . . . . . . . . . . . . . . . . . . . . . . . . . . . . . . . . . . . . . . . . . . . . . . . . . . . . .
. . . . . . . . . . . .
. . . . . . . . . . . .
41 41 41 45 46 47 48 49 50 51 51 52 53
4 Spacecraft Rendezvous Guidance, Navigation, and Control 4.1 Introduction and Overview . . . . . . . . . . . . . . . . . . . . . . . . . . . . . . . . 4.2 Coordinate Systems . . . . . . . . . . . . . . . . . . . . . . . . . . . . . . . . . . . . 4.3 Rotational Dynamics . . . . . . . . . . . . . . . . . . . . . . . . . . . . . . . . . . . . 4.3.1 Attitude Representations and Kinematics . . . . . . . . . . . . . . . . . . . . 4.3.1.1 Quaternions . . . . . . . . . . . . . . . . . . . . . . . . . . . . . . . 4.3.1.2 Modified Rodrigues Parameters . . . . . . . . . . . . . . . . . . . . 4.3.1.3 Nonsingular Attitude Filtering Using Modified Rodrigues Parameters 4.3.2 Attitude Dynamics . . . . . . . . . . . . . . . . . . . . . . . . . . . . . . . . . 4.4 Translational Dynamics . . . . . . . . . . . . . . . . . . . . . . . . . . . . . . . . . . 4.5 Navigation Sensor Models . . . . . . . . . . . . . . . . . . . . . . . . . . . . . . . . . 4.5.1 Inertial Measurement Unit . . . . . . . . . . . . . . . . . . . . . . . . . . . . 4.5.1.1 Gyroscope Model . . . . . . . . . . . . . . . . . . . . . . . . . . . .
vi
54 54 54 55 55 55 57 59 61 61 63 63 63
4.6
4.5.1.2 Accelerometer Model . . . 4.5.2 Star Tracker Sensors . . . . . . . . . 4.5.3 Laser/Radar Navigation Sensors . . 4.5.4 Orbit Sensor . . . . . . . . . . . . . Rendezvous Guidance and Control . . . . . 4.6.1 Translational Guidance and Control 4.6.2 Attitude Guidance and Control . . .
. . . . . . .
. . . . . . .
. . . . . . .
. . . . . . .
. . . . . . .
. . . . . . .
. . . . . . .
. . . . . . .
. . . . . . .
. . . . . . .
. . . . . . .
. . . . . . .
. . . . . . .
. . . . . . .
. . . . . . .
5 Simulation Results 5.1 Radar Tracking Problem . . . . . . . . . . . . . . . . . . . . . . . . . . 5.1.1 Dynamic Model and Measurement Equations . . . . . . . . . . 5.1.2 Results of Example Problem: Perfect Noise Case . . . . . . . . 5.1.2.1 Comparison of Leverage Point Identification Methods 5.1.2.2 Comparison of Filters . . . . . . . . . . . . . . . . . . 5.2 Adaptive Multiplicative Quaternion Filtering . . . . . . . . . . . . . . 5.2.1 Gaussian Simulation . . . . . . . . . . . . . . . . . . . . . . . . 5.2.2 Non–Gaussian Simulation . . . . . . . . . . . . . . . . . . . . . 5.2.3 Sensitivity to the Adaptive Filter Buffer Size . . . . . . . . . . 5.2.4 Computational Costs . . . . . . . . . . . . . . . . . . . . . . . . 5.3 Attitude Filtering Using Modified Rodrigues Parameters . . . . . . . . 5.4 Rendezvous Navigation in Elliptical Orbit . . . . . . . . . . . . . . . . 5.4.1 Overview and Simulation Setup . . . . . . . . . . . . . . . . . . 5.4.2 Gaussian Simulation . . . . . . . . . . . . . . . . . . . . . . . . 5.4.3 Non-Gaussian Simulation . . . . . . . . . . . . . . . . . . . . . 5.4.4 Computational Comparisons . . . . . . . . . . . . . . . . . . . 5.4.5 Summary . . . . . . . . . . . . . . . . . . . . . . . . . . . . . .
. . . . . . .
. . . . . . . . . . . . . . . . .
. . . . . . .
. . . . . . . . . . . . . . . . .
. . . . . . .
. . . . . . . . . . . . . . . . .
. . . . . . .
. . . . . . . . . . . . . . . . .
. . . . . . .
. . . . . . . . . . . . . . . . .
. . . . . . .
. . . . . . . . . . . . . . . . .
. . . . . . .
. . . . . . . . . . . . . . . . .
. . . . . . .
64 64 65 65 65 66 67
. . . . . . . . . . . . . . . . .
70 70 70 72 72 73 77 78 81 84 87 88 92 92 93 110 120 120
6 Conclusions
121
Bibliography
123
vii
List of Figures 1.1 1.2 1.3 1.4 1.5 1.6
Artist Rendering of the DART Spacecraft∗ . . . . . . . . . . . . . . . . . . . . . DART Spacecraft Configuration† . . . . . . . . . . . . . . . . . . . . . . . . . . DART Proximity Operations‡ . . . . . . . . . . . . . . . . . . . . . . . . . . . . Illustration of the Sensitivity of Least Squares for Point Estimation . . . . . . . Illustration of the Sensitivity of Least Squares for a Linear Regression Problem Illustration of Divided Difference Filter Transformation . . . . . . . . . . . . .
. . . . . .
. . . . . .
2.1 2.2 2.3 2.4 2.5 2.6 2.7 2.8 2.9 2.10
Unit Variance Gaussian and Laplacian Distributions . . . . . . . . . . . . . . . . . Comparison of ρ, φ, and ψ Functions . . . . . . . . . . . . . . . . . . . . . . . . . . Comparison of Asymptotic Relative Efficiencies for Gaussian Mixture . . . . . . . Comparison of Asymptotic Relative Efficiencies for Gaussian Mixture . . . . . . . Comparison of Asymptotic Relative Efficiencies for Gaussian–Cauchy Mixture . . . Huber Gaussian Asymptotic Relative Efficiency and Optimal Tuning Parameter . . Unit Variance Gaussian, Laplacian, and Least Favorable Distributions . . . . . . . Elements of H Matrix . . . . . . . . . . . . . . . . . . . . . . . . . . . . . . . . . . Data Points and Regression Results for Example Problem . . . . . . . . . . . . . . Data Points and Regression Results for Example Problem With Single Bad Leverage Point . . . . . . . . . . . . . . . . . . . . . . . . . . . . . . . . . . . . . . . . . . . . 2.11 Data Points and Regression Results for Example Problem With Good and Bad Leverage Points . . . . . . . . . . . . . . . . . . . . . . . . . . . . . . . . . . . . . . 2.12 Data Points and Regression Results for Example Problem With Two Bad Leverage Points . . . . . . . . . . . . . . . . . . . . . . . . . . . . . . . . . . . . . . . . . . .
. 2 . 3 . 3 . 4 . 5 . 12 . . . . . . . . .
19 22 24 25 27 27 28 32 36
. 37 . 38 . 39
4.1 4.2 4.3
Illustration of I and L Coordinate Frames . . . . . . . . . . . . . . . . . . . . . . . . 55 MRP Illustration as the Result of a Stereographic Projection . . . . . . . . . . . . . 58 Illustration of the weakly nonlinear behavior of the MRPs restricted to kσk ≤ 1. . . 59
5.1 5.2 5.3
Geometry of Example Problem . . . . . . . . . . . . . . . . . . . . . . . . . . . . . True Trajectory of Target . . . . . . . . . . . . . . . . . . . . . . . . . . . . . . . . Estimated Trajectory Errors for ² = 0.0: Comparison of Leverage Point Identification Methods . . . . . . . . . . . . . . . . . . . . . . . . . . . . . . . . . . . . . . . . . . Estimated Trajectory Errors for ² = 0.5: Comparison of Leverage Point Identification Methods . . . . . . . . . . . . . . . . . . . . . . . . . . . . . . . . . . . . . . . . . . Estimated Trajectory Errors for ² = 0 . . . . . . . . . . . . . . . . . . . . . . . . . Estimated Trajectory Errors for ² = 0.5 . . . . . . . . . . . . . . . . . . . . . . . .
5.4 5.5 5.6
viii
. 71 . 73 . 74 . 75 . 76 . 77
5.7 5.8 5.9 5.10 5.11 5.12 5.13 5.14 5.15 5.16 5.17 5.18 5.19 5.20 5.21 5.22 5.23 5.24 5.25 5.26 5.27 5.28 5.29 5.30 5.31 5.32 5.33 5.34 5.35 5.36 5.37 5.38
Comparison of Probability Density and Distribution Functions for ² = 0 and ² = 0.1 Gaussian Simulation RMS Errors . . . . . . . . . . . . . . . . . . . . . . . . . . . . . Contaminated Gaussian Simulation RMS Errors . . . . . . . . . . . . . . . . . . . . Example of Clustered Outliers in Adaptive Filter . . . . . . . . . . . . . . . . . . . . Attitude Angle RMS Errors for Varying Buffer Size . . . . . . . . . . . . . . . . . . . R11 RMS Errors for Varying Buffer Size . . . . . . . . . . . . . . . . . . . . . . . . . Contamination Parameter RMS Errors for Varying Buffer Size . . . . . . . . . . . . True Principal Rotation Angle and MRPs . . . . . . . . . . . . . . . . . . . . . . . . Comparison of MRP-based filters and Quaternion–based filter . . . . . . . . . . . . . Comparison of MRP-based filter with varying σr . . . . . . . . . . . . . . . . . . . . Comparison of MRP-based filter with and without the covariance transformation . . Translational Guidance Commands . . . . . . . . . . . . . . . . . . . . . . . . . . . . Attitude Guidance Commands . . . . . . . . . . . . . . . . . . . . . . . . . . . . . . Pure Inertial Navigation Results: Position and Velocity . . . . . . . . . . . . . . . . Pure Inertial Navigation Results: Attitude and Rate Bias . . . . . . . . . . . . . . . Pure Inertial Navigation Results: Orbit . . . . . . . . . . . . . . . . . . . . . . . . . Gaussian Simulation Results: Position . . . . . . . . . . . . . . . . . . . . . . . . . . Gaussian Simulation Results: Velocity . . . . . . . . . . . . . . . . . . . . . . . . . . Gaussian Simulation Results: Attitude . . . . . . . . . . . . . . . . . . . . . . . . . . Gaussian Simulation Results: Rate Bias . . . . . . . . . . . . . . . . . . . . . . . . . Gaussian Simulation Results: Orbit Position . . . . . . . . . . . . . . . . . . . . . . . Gaussian Simulation Results: Orbit Velocity . . . . . . . . . . . . . . . . . . . . . . . Gaussian Simulation Results: Covariance and Contamination . . . . . . . . . . . . . Gaussian Simulation Results: Closed–Loop System Performance . . . . . . . . . . . Non-Gaussian Simulation Results: Position . . . . . . . . . . . . . . . . . . . . . . . Non-Gaussian Simulation Results: Velocity . . . . . . . . . . . . . . . . . . . . . . . Non-Gaussian Simulation Results: Attitude . . . . . . . . . . . . . . . . . . . . . . . Non-Gaussian Simulation Results: Rate Bias . . . . . . . . . . . . . . . . . . . . . . Non-Gaussian Simulation Results: Orbit Position . . . . . . . . . . . . . . . . . . . . Non-Gaussian Simulation Results: Orbit Velocity . . . . . . . . . . . . . . . . . . . . Non-Gaussian Simulation Results: Covariance and Contamination . . . . . . . . . . Non-Gaussian Simulation Results: Closed–Loop System Performance . . . . . . . . .
ix
79 80 82 84 85 86 87 89 90 91 91 97 98 99 100 101 102 103 104 105 106 107 108 109 112 113 114 115 116 117 118 119
List of Tables 2.1 2.2 2.3 2.4 2.5
Comparison of Mi and Pi . . . . . . . . . . . . . . . . . . . . . . . Linear Regression Solution . . . . . . . . . . . . . . . . . . . . . . . Linear Regression Solution With Single Bad Leverage Point . . . . Linear Regression Solution With One Good and One Bad Leverage Linear Regression Solution With Two Bad Leverage Points . . . .
. . . . . . . . . . . . Point . . . .
. . . . .
. . . . .
. . . . .
. . . . .
. . . . .
. . . . .
32 36 37 38 39
5.1 5.2 5.3 5.4 5.5 5.6 5.7 5.8 5.9 5.10
Simulation Parameters . . . . . . . . . . . . . . . . . . . . . . . Initial Conditions . . . . . . . . . . . . . . . . . . . . . . . . . . EKF-Relative Computation Ratios . . . . . . . . . . . . . . . . Comparison of Identification Techniques for Clustered Outliers Relative Computation Ratios . . . . . . . . . . . . . . . . . . . Simulation Parameters . . . . . . . . . . . . . . . . . . . . . . . Computational Cost . . . . . . . . . . . . . . . . . . . . . . . . Initial Conditions . . . . . . . . . . . . . . . . . . . . . . . . . . Sensor Specifications . . . . . . . . . . . . . . . . . . . . . . . . Computational Time Comparisons . . . . . . . . . . . . . . . .
. . . . . . . . . .
. . . . . . . . . .
. . . . . . . . . .
. . . . . . . . . .
. . . . . . . . . .
. . . . . . . . . .
. . . . . . . . . .
72 72 76 83 88 89 92 94 94 120
x
. . . . . . . . . .
. . . . . . . . . .
. . . . . . . . . .
. . . . . . . . . .
. . . . . . . . . .
Chapter 1
Introduction 1.1
Autonomous Rendezvous of Spacecraft
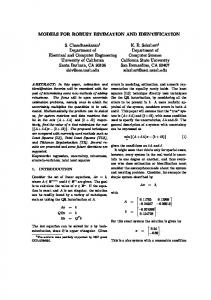
Rendezvous and docking of spacecraft in orbit has been at the forefront of research and technology development since the beginning of space flight, continuing to the present day. Spacecraft rendezvous and docking has in the past played an important role in the exploration of space, including both crewed and un-crewed missions. For example, the lunar orbit rendezvous mission mode was critical to the success of the Apollo program.1 The autonomous rendezvous and docking of spacecraft in orbit will remain a critical technology for future space exploration missions.2 Indeed, autonomous rendezvous and docking was named one of several top technologies required for the future exploration of space in the Exploration Systems Architecture Study.3 Potential future applications of this technology include robotic sample return missions to the moon and Mars,4 in–space assembly of modular systems,5, 6 peer-to-peer refueling within constellations,7 and could potentially serve as an important backup system in the case of an abort scenario involving crewed lunar missions.8 Autonomous rendezvous and docking is currently far from being mastered. A recent example in support of this claim can be found in the failure of the Demonstration of Autonomous Rendezvous Technology (DART) mission.9 This technology demonstration mission called for the DART spacecraft to rendezvous and conduct various proximity operations, with complete autonomy, with the Multiple Paths, Beyond-Line-of-Sight Communications (MUBLCOM) satellite. In addition, the mission goals also included the demonstration of the use of an Advanced Video Guidance Sensor (AVGS) for relative navigation during proximity operations. The DART spacecraft is shown in Fig. 1.1 and and Fig. 1.2. The planned proximity operations are shown in Fig. 1.3. The DART spacecraft was launched on a Pegasus booster on April 15th 2005, and successfully completed some mid-course maneuvering in preparation for the terminal rendezvous and docking with the MUBLCOM target satellite. After about 11 hours into the mission, the DART spacecraft propellant supply was prematurely depleted, ending the mission with only 11 out of 27 rendezvous and proximity objectives completed.10 The Mishap Investigation Board (MIB) found that the propellent depletion, and therefore the mission failure, was due primarily to the following factors:10 • Poor relative position initialization in the navigation software ∗
http://www.msfc.nasa.gov/news/dart/index.html, March 7th, 2007
1
1.1. AUTONOMOUS RENDEZVOUS OF SPACECRAFT
2
Figure 1.1: Artist Rendering of the DART Spacecraft∗
• The introduction of a biased velocity measurement • Navigation software design that was overly sensitive to erroneous data • The use incorrect weighting of measurement data in the navigation software These inadequacies in the DART navigation software led to a buildup of navigation error, which in turn led to a higher than anticipated rate of thruster firing, thus depleting the propellant supply and causing the premature termination of the mission. Some additional factors that contributed to the failure are the guidance system for allowing continual thrusting, as well as faulty calculations of the remaining propellant supply (DART in fact had about 30% fuel remaining when it had computed that the fuel was below the limit, thus terminating the mission10 ). The DART mishap was not the first instance where navigation sensors and data processing techniques played a role in rendezvous failures or anomalies. The STS–32 mission in January 1990 experienced higher than expected noise in the rendezvous radar measurements, leading to an increase in fuel consumption, although the rendezvous mission was ultimately completed successfully.14 Investigation into this anomaly found that the radar measurement was biased and was not properly accounted for in the onboard navigation filter software. In another example, the STS–91 mission in June 1998 experienced a series of errors due to faulty processing of Global Positioning System (GPS) measurement data.14 † ‡
http://www.msfc.nasa.gov/news/dart/index.html, March 7th, 2007 http://www.msfc.nasa.gov/news/dart/index.html, March 7th, 2007
1.1. AUTONOMOUS RENDEZVOUS OF SPACECRAFT
3
Figure 1.2: DART Spacecraft Configuration†
Figure 1.3: DART Proximity Operations‡
Based on these rendezvous and docking mission failures and anomalies, there is a need for both improved sensor modeling and the development of navigation filters that are insensitive to data that does not follow the expected distribution of measurement errors. It is also desirable to develop filters that can adapt to changes in these error distributions over time. It is therefore the purpose of this dissertation to develop robust filtering and navigation sensor processing techniques for use in spacecraft autonomous rendezvous scenarios.
1.2. STATE ESTIMATION
4
1
1
Data Mean Median
0.8 0.6
Data Mean Median
0.8 0.6
0.4
0.4
0.2
0.2
0
0
−0.2
−0.2
−0.4
−0.4
−0.6
−0.6
−0.8
−0.8
−1 −2
−1.5
−1
−0.5
0 x
0.5
(a) Data Points
1
1.5
2
−1 −20
0
20
40
60
80
100
120
x
(b) Data Points with Outlier
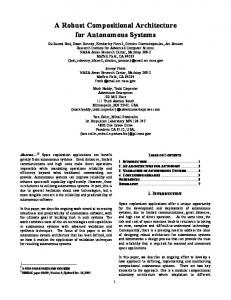
Figure 1.4: Illustration of the Sensitivity of Least Squares for Point Estimation
1.2
State Estimation
The processing of the various sensor measurements to determine the spacecraft position and velocity relative to the target spacecraft can be accomplished by one of several means. Perhaps the most basic technique in this area of application is the Kalman filter.15 The Kalman filter is essentially a recursive dynamic weighted least–squares or minimum `2 norm estimation procedure, and is a maximum likelihood technique assuming that the error statistics follow Gaussian probability distributions.17, 18 The least–squares method is not a robust estimation technique because the procedure can fail to perform adequately when the true error statistics follow non-Gaussian probability distributions, particularly those with much thicker tails than the Gaussian distribution.19, 20 Thickly–tailed probability distributions are those with high probability of large errors compared with the Gaussian distribution. The term robustness in a statistical sense was coined by Box21 to describe procedures that are insensitive to deviations in the assumed underlying probability distribution from which the data are sampled. Formal definitions of robust estimation can be found in Refs. 22–25 and will be summarized in Sec. 2.3.2. Intuitively, robustness means that the estimation error remains bounded for arbitrarily large observation errors. The sensitivity of least squares can be illustrated with a simple example of a one-dimensional point estimation problem. Suppose 20 samples are taken with uniform random errors in the interval [−1, 1], as shown in Fig. 1.4(a). Here, the mean (least squares estimator) and median (least absolute value estimator) both appear to take on reasonable values, for instance the mean is 0.0962 and the median is 0.1605. Next, the rightmost data point is shifted to the point x = 100, as shown in Fig. 1.4(b). In this case, the median value is unchanged whereas the mean is now 5.0539, clearly not representative of the center of the bulk of the data. In this sense, the sample mean is extremely sensitive to erroneous data, whereas the median is said to be robust. The sensitivity of the least squares technique is also present in higher dimensions. For example, the results of a linear regression problem are shown in Fig. 1.5. In this problem, the data points have an outlier at x = 25, y = 0. The least squares solution is clearly not a good fit for the bulk
1.2. STATE ESTIMATION
5
30 25
Data Points Least Squares Solution Robust Solution
20
y
15 10 5 0 −5 0
5
10
15 x
20
25
30
Figure 1.5: Illustration of the Sensitivity of Least Squares for a Linear Regression Problem
of the data, while the robust solution is able to tolerate the presence of the outlier. This example will be discussed in more detail in Sec. 2.7.
1.2.1
Some History of Robust Estimation
The sensitivity of the least squares technique to the true underlying distribution of the data has been known for quite some time. In fact, in the first publication on least squares, Legendre suggests rejecting data that appear erroneous before using least squares on the remaining observations.29§ Legendre’s quote from 1805 is29 If among these errors are some which appear too large to be admissible, then those observations which produced these error will be rejected, as coming from too faulty experiments, and the unknowns will be determined by means of the other observations, which will then give much smaller errors.
In other words, Legendre suggests rejecting data that are thicker in the tails than the expected (Gaussian) distribution. Regarding his independent development of the method of least squares published in 1809, Gauss stated in 1821 that30
§
See Plackett26 and Stigler27 for a description of the discovery of the least squares method, and subsequent debate between Legendre and Gauss over priority. It is also interesting to note that the least squares technique was independently discovered by Adrain in 1808,28 before Gauss’s publication on the method.
1.2. STATE ESTIMATION
6
The author of the present treatise, who in the year 1797 first investigated this problem according to the principles of the theory of probability, soon realized that it was impossible to determine the most probable value of the unknown quantity, unless the function representing the probability of the errors is known. But since it is not, there is no other recourse than to assume such a function in a hypothetical fashion. It seemed most natural to him to take the opposite approach and to look for that function which must be taken as a base in order that for the simplest of all cases a rule is obtained which is generally accepted as a good one, namely that the arithmetic mean of several observations of equal accuracy for one and the same quantity should be considered the most accurate value. This implied that the probability of an error x must be assumed proportional to an exponential expression of the form e−hhxx , and that then just the same method which he found by other considerations already a few years earlier, would become necessary in general. This method, which afterwards, in particular since 1801, he had almost daily opportunity to use in diverse astronomical computations, and which in the meantime also Legendre had happened upon, now is in general use under the name method of least squares.
It is actually quite shocking that in 1809 Gauss went as far as to claim that the use of the arithmetic mean (minimum `2 norm) should be regarded as an axiom31
It has been customary certainly to regard as an axiom the hypothesis that if any quantity has been determined by several direct observations, made under the same circumstances and with equal care, the arithmetical mean of the observed values affords the most probable value, if not rigorously, yet very nearly at least, so that it is always most safe to adhere to it.
Gauss’s claims are questionable, for, even by 1809, it was well known that other estimators were superior to the mean in certain circumstances. In particular, Laplace had shown in 1774 that the median was the minimum–variance estimator for the double exponential (now known as the Laplacian) distribution.32 It is certainly interesting to note that minimum `1 norm methods based on weighted medians were in use well before the invention of minimum `2 norm methods.33, 34 By his own admission, Gauss proposed the normal (Gaussian) distribution out of pure mathematical convenience rather than a statistical or experimental analysis some of random process. Therefore, it should not be expected in reality that any process occurring in nature should be Gaussian. In fact, an empirical investigation conducted by Bessel in 1818 showed that astronomical observation data (as one example) was clearly non–Gaussian in nature.35 In spite of this, a great deal of early estimation theory was rooted in minimum `2 norm techniques, justified mainly by several elegant mathematical properties of the Gaussian distribution (namely, the Gauss–Markov theorem
1.2. STATE ESTIMATION
7
and the Central Limit Theorem)30 ¶ . Robust approaches to estimation at the time amounted to cleaning the data with some outlier rejection rule, and applying least squares to the remainder.29, 36 Newcomb37 seems to have been the first to directly address thickly tailed observational data in 1886 by advocating the use of a mixture of Gaussian densities of differing variance for modeling the underlying distribution.29, 30, 36 A rigorous approach to robust data processing was developed by means of Huber’s generalized maximum likelihood estimation theory, first introduced in Ref. 38 in 1964. Huber proposed a combined minimum `1 and `2 norm estimation technique, which exhibits robustness with respect to deviations from the commonly assumed Gaussian probability density functions. In particular, Huber considered a class of symmetric contaminated distributions in the neighborhood of the Gaussian, which in some sense can be considered as a generalization of Newcomb’s Gaussian mixture models. k The Huber–based estimates are robust in the sense that they minimize the maximum asymptotic estimation variance when applied to contaminated Gaussian densities. The Huber technique was originally developed as a generalization of maximum likelihood estimation, applied first to estimating the center of a probability distribution in Ref. 38 and further generalized to multiple linear regression in Refs. 30, 40 and 41. The Kalman filter is a recursive minimum `2 norm technique and therefore exhibits sensitivity to deviations in the true underlying error probability distributions.20 For this reason, the Huber technique has been further extended to dynamic estimation problems. Boncelet and Dickinson42 first proposed to solve the robust filtering problem by means of the Huber technique at each measurement point, by expressing the discrete–time filtering problem as a sequence of linear regression problems. The authors do not consider the form of the state error covariance matrix update, nor do they provide any simulation results to demonstrate the benefits of the proposed technique. Kovacevic, et al43 follow the work of Ref. 42 and develop a robust filter using the Huber technique applied to a linear regression problem at each measurement update. Refs. 44–48 express the dynamic filtering problem as a sequential linear regression to be solved by the Huber technique, and apply the filter to underwater vehicle tracking, power system state estimation, speech processing, and spacecraft rendezvous navigation, respectively. The increase in computation due to the use of the Huber technique was found in Ref. 48 to be small, specifically on the order of 10%. Ghandi and Mili49 develop a robust Huber-based Kalman filter using a pre-whitening filter for outlier identification. It should be noted that Refs. 42–49 apply the Huber methodology to linearized filters. Some other approaches to robust filtering include several ad-hoc techniques for dealing with observation data that do not follow the assumed Gaussian distribution. In particular, that of censoring the data such that any observation that differs from the predicted value by some set threshold is discarded entirely. This approach to robust filtering has numerous disadvantages that have been known for quite some time,50 notably that the non-continuous weighting function can lead to non-robust covariance estimates.20, 22 Another disadvantage of the censoring method is the increase in estimation variance due to the fact that information contained within the residual is discarded entirely and not processed according to a statistical procedure. Another ad-hoc technique ¶
The blind adherence to Gaussianity was recently described by Hampel in Ref. 35 as being due to the mathematicians because they believed it to be an empirical fact, and the users of statistics because the belived it to be a mathematical theorem. k It is interesting to note that, in fact, Newcomb39 in 1912 proposed an estimator quite similar in form to that proposed by Huber, but without rigorous justification (See Ref. 29).
1.2. STATE ESTIMATION
8
is to simply inflate the measurement error covariance matrix to account for the perturbing density that leads to the non-Gaussianity. This method also suffers from several drawbacks, namely that all measurements processed according to this rule receive decreased weights, not only those that are to be considered as outliers. This reduction in overall weighting in turn leads to an increase in the estimation variance.20 Other techniques for robust filtering have been proposed. Sorenson and Alspach51, 52 advocate a Bayesian approach in which the prior and posterior distributions are adaptively approximated using Gaussian sums. The Gaussian sum methodology yields a robust estimation technique, but at an extreme cost in computation. Specifically, the number of terms kept in the Gaussian sum grows exponentially with time. The computation time can be reduced using filter banks and parallel processing techniques,53–55 but the overall computational complexity across the entire processing system remains substantial. Recent advances in both Gaussian56 and non–Gaussian57 particle filtering techniques have done much to reduce the computational burden involving Gaussian sum techniques, but they still may not feasible for real–time implementation in many applications. Specifically, the Gaussian particle filter in Ref. 56 can cost between 15 to over 150 times the computation of the Kalman filter filter in the example problems, depending on the number of particles. Computational cost for the Gaussian sum particle filter in Ref. 57 are not provided but are likely to be even greater. Masreliez and Martin58 develop a robust filter by means of a Bayesian approach in which either the state noise is Gaussian and the measurement noise is non-Gaussian, or the state noise is nonGaussian and the measurement noise is Gaussian. No consideration is made for the case when both noise sources are non-Gaussian, which is allowed for under the Huber filtering approach. Tsai and Kurz59 propose an adaptive polynomial approximation technique for robustification of the Kalman filter. The approach is only applicable to estimation problems where the measurements are uncorrelated, and also only applies to cases where either the measurement or process noise is Gaussian. Hewer et al60 propose a robust batch prefiltering technique, in which the raw measurement data are smoothed prior to processing in a standard Kalman filter. Meinhold and Singpurwalla61 also approach the robust Kalman filtering problem from a Bayesian perspective, but instead advocate the use of Student–t distributions for approximating the prior and posterior densities, but the results hold only for scalar systems. Niehsen62 develops a maximum–likelihood filtering technique based on a generalized Gaussian density.
1.2.2
Adaptive State Estimation
In addition to the form of the error probability density function (the Gaussian), the standard Kalman filter also assumes that the statistics of the distribution, namely its mean and covariance, are known quantities. If these assumed parameters of the distribution differ greatly from the true parameters, then the filter can exhibit large errors and possibly divergence.63 This behavior is true even if the true error distributions are Gaussian. The Huber–based formulations of the filtering problem also make some assumptions regarding the distribution. As discussed in the previous section, the Huber approach considers a class of contaminated densities in the neighborhood of the Gaussian density. Essentially the Huber approach assumes that the statistics of the main Gaussian density are known, as well as the ratio or percentage of the contamination (although the filter makes no assumption of the nature of the contaminating density other than it be symmetric with
1.2. STATE ESTIMATION
9
finite variance). Adaptive filtering techniques have been introduced in which the error statistics are estimated along with the state in real time, in order to reduce the possibility of divergence and to improve the filter performance in the presence of unknown statistics of the underlying noise distributions. There are several approaches to the adaptive state estimation problem. An early review article by Mehra64 divides these approaches into four basic techniques, namely Bayesian, maximum likelihood, correlation matching, and covariance matching methods. In the Bayesian case and the maximum likelihood case, the techniques become extremely complicated as the dimension of the measurement noise and process noise covariances matrices increase. For this reason, the Bayesian and maximum likelihood approaches can both be collapsed into a problem of estimating the Kalman gain matrix directly, without estimating the measurement and process noise covariances matrices, which saves on a great deal of the computational complexity inherent to the problem. This is approach, however, is disadvantageous in general since it does not directly permit evaluation of sensor performance or model uncertainty, which are parameters of interest in obtaining through the measurement and process noise covariances. The correlation matching technique operates by attempting to correlate the observed output of a system to the unknown noise covariances. Methods can be developed using either the autocorrelation of the output or that of the residuals. The approach using the output is generally more restrictive, so in practice usually the residuals–based approach is preferred. In both cases, the estimates of the process noise covariance are not unique, and moreover they can only be computed in steady state conditions. The covariance matching technique is an intuitively appealing approach in which the measurement noise and process noise covariances are determined in such a way that the true residual covariance matches the theoretically predicted covariance. The true residual covariance is approximated in real time using the sample covariance, over some finite window of stored residuals. The solution provided by Mehra64 leads to a non-unique estimate of the process noise covariance, as with the correlation matching method. For this reason, the author states that, at the time, this approach has exhibited best success when the process noise covariance is known and one only wishes to solve for the measurement noise covariance. An example of this approach is given in Ref. 65. The covariance matching technique is expanded by Myers and Tapley in Ref. 66. In this approach, the authors are able to determine explicit solutions for both the process noise and the measurement noise covariances by using empirical estimators based on the sample covariance for a finite window of stored observations. The authors also introduce a fading memory weighting parameter in which more recent observations receive more weight than the older observations. The estimators are derived in batch form, but are manipulated into a recursive form suitable for real– time implementation. The approach is not computationally intensive, requiring only 12% more cost than the standard EKF in one sample problem. Special cases of the Myers–Tapley method appear in the literature. For example, Maybeck et 67 al and Whitmore and Leondes68 propose a covariance matching method to estimate only the process noise covariance matrix, assuming the measurement noise covariance is known. In contrast, Hull et al 69 devise a special case of the Myers–Tapley method in which the process noise covariance is known and the measurement noise covariance is estimated in real time. Few authors have developed combined robust and adaptive approaches to state estimation by blending the Huber approach for robust estimation with the Myers–Tapley approach for adaptive
1.2. STATE ESTIMATION
10
estimation. In particular, Groutage et al70 approach the adaptive state estimation problem by applying a robust processing technique based on Huber’s generalized maximum likelihood estimation to develop a data smoother. This data smoother has a similar structure to that proposed by Myers and Tapley. The robust smoother processes outputs from a standard Kalman filter in order to estimate the process noise variance. The method has a major drawback in that it can only be applied to scalar dynamic systems. Kirlin and Moghaddamjoo71 develop a similar approach as that of Ref. 70, but include the estimation of unknown step inputs. The adaptive filter in Ref. 71 is essentially the same as the Myers–Tapley method, with the difference that robust scale estimates are used in place of the sample covariance. The approach is more general than that of Ref. 70 in that both process noise and measurement noise covariances can be estimated. The drawback of this approach is that the results are valid only for scalar linear systems. Durovic and Kovacevic72 develop a methodology for estimating the measurement and process nosie covariances based on robust principles, and include this procedure in a recursive dynamic Huber filter with linear state dynamics and measurement equations. The approach is essentially a merger of Ref. 42 and Ref. 70. The proposed filter adaptively estimates the noise statistics along with the state in a structure similar to that proposed by Myers and Tapley in Ref. 66, however, the approach is only applicable to scalar measurement and process noise cases. Zou et al73 develop a robust adaptive signal processing technique based on Huber’s generalized maximum likelihood estimation with robust adaptive scale estimates used in place of the sample covariance, but the method is only applicable to scalar input and output noise. To date, combined robust and adaptive approaches to the dynamic state estimation problem have only been developed for scalar systems.
1.2.3
Recent Advances in State Estimation
This section describes some recent advances in the area of state estimation, that are not necessarily robust or adaptive in nature, and have been developed using the standard minimum `2 norm approach to stochastic estimation problems. One such technique is the Backward Smoothing Extended Kalman Filter (BSEKF),74 which is a sort of combined filter, smoother, and batch estimator with sliding window of measurement data to be processed. The BESKF essentially operates by relinearizing previous measurement data about the state estimates from the most current observation that are propagated back to the individual measurement points. These relinearized measurement points are then processed according to an EKF–type minimum `2 norm technique. The simulation results presented in Ref. 74 show that for a spacecraft attitude estimation problem with a reasonable measurement data frame size, the computational requirements are over 150 times greater than the standard EKF. Based on this computational burden, and given the non–robust minimum `2 norm nature of the method, there does not appear to be any advantage in the use of the BSEKF over, for example, the Gaussian sum particle filter presented in Ref. 57. The Two–Step Optimal Estimator (TSOE) is a technique developed initially in Ref. 75 and further developed in Refs. 76–78. The TSOE operates by dividing the filter update into two subproblems to be solved in sequence. The first subproblem is the standard linear Kalman filter, which can be solved explicitly. The second subproblem treats the solution to the first subproblem as “measurements” to be processed using an iterative nonlinear least squares method. The product of this nonlinear second subproblem is then taken as the state estimate following the measurement
1.2. STATE ESTIMATION
11
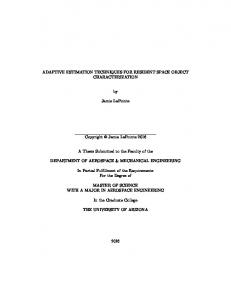
update. The filter as originally developed75 suffered from occasional ill-conditioned covariances matrices,77 which was remedied in Ref. 78. In Ref. 78, it was found that the TSOE costs about 2-3 times the computation of the EKF for the particular example problem, which is a reasonable penalty for the nonlinear measurement update processing. However, the state dynamics are assumed to be linear and the measurement error distribution is assumed to be Gaussian, which implies the TSOE suffers from the same lack of robustness as the basic Kalman filter. Another recent advancement is an estimator known as the divided difference filter (DDF), which is one of several new estimation techniques that are collectively known as sigma–point Kalman filters (SPKF). The first–order (DD1) and second–order (DD2) divided difference filters79, 80 are generalizations of the filter introduced by Schei81 and are two examples of SPKF–class estimators; other examples can be found in Refs. 82–85. Like the basic Kalman filter, the SPKFs seek to determine a state estimate that minimizes the `2 –norm of the residuals. The SPKF technique differs from the standard Kalman filter in the sense that the SPKFs do not linearize the dynamic system for the propagation, but instead propagate a cluster of points centered around the current estimate in order to form improved approximations of the conditional mean and covariance. Specifically, the divided difference filters make use of multidimensional interpolation formulas to approximate the nonlinear transformations. As a result of this approach, the filters do not require knowledge or existence of the partial derivatives of the system dynamics and measurement equations. SPKFs have the additional advantage over the standard Kalman filter in that they can easily be extended to determine second–order solutions to the minimum `2 norm filtering problem, which increases the estimation accuracy when the system and/or measurement equations are nonlinear. It is important to note that the SPKFs use a minimum `2 –norm measurement update and are therefore subject to the same sensitivity to non-Gaussian measurement errors as the Kalman filter. An adaptive SPFK filter that uses the Myers–Tapley covariance matching technique is proposed in Ref. 86. The improvement found using a SPKF technique in favor of the Kalman filter can be shown in the following simple example. Given some transformation z = f (x) where x is a random variable with known distribution and f (x) is a nonlinear transformation, several methods can be used to approximate the covariance of the transformed variable z. One technique to determine a highly accurate approximate solution is a Monte-Carlo approach in which several thousand random choices of x are generated, with each being propagated through the transformation f (x). Then the sample covariance of the transformed points can be calculated. This approach gives a good approximation to the true covariance of variable z but at a usually extreme cost due to the number of calculations that must be made. On the other extreme, a crude approximation can be found by linearizing the transformation and using basic matrix transforms to calculate the covariance. This approach, which is essentially the Kalman filter strategy, works well for nearly linear systems but breaks down in the presence of nonlinearity. A third approach is to use a Divided–Difference transformation in which a select few points are propagated through the transformation to calculate the covariance. In this approach, the transformed covariance is calculated more precisely than that found using a linearization, but requires far fewer points than the Monte-Carlo method. This trade off is illustrated in Fig. 1.6. In this example the initial variable x = [x1 , x2 ] where x1 and x2 are mutually uncorrelated Gaussian random variables with unit variance. The transformation is given by z1 = x1 + x31 + x1 x2 , and z2 = x2 + x31 + x1 x32 + x1 x2 . The “true” covariance of the transformed state z is determined using the Monte-Carlo method shown in Fig. 1.6(a)–(b). In this case, 10,000 points are selected at random and propagated through the transformation in order to
1.2. STATE ESTIMATION
12
4
80
MC Points True Mean True Covariance Ellipse
3
MC Points MC Mean MC Covariance Ellipse
60
2 40
1 20
x
z2
2
0 −1
0 −20
−2 −3
−40
−4
−60
−5 −4
−3
−2
−1
0 x1
1
2
3
−80 −60
4
4
z2
2
60
80
2
0.5 x
40
EKF Mean EKF Covariance Ellipse MC Mean MC Covariance Ellipse
6
1
0
0
−0.5
−2
−1
−4
−1.5
−6
−1.5
−1
−0.5
0 x1
0.5
1
1.5
−8 −8
2
(c) Initial Kalman Filter Distribution
−6
−4
−2
0 z1
2
4
6
8
(d) Transformed Kalman Filter Distribution 8
2 DDF Sigma Points True Covariance Ellipse
1.5
6 4
1
DDF Sigma Points DDF Covariance Ellipse MC Mean MC Covariance Ellipse
2 z2
0.5 2
20
8 True Mean True Covariance Ellipse
1.5
x
0
(b) Transformed Monte-Carlo Distribution
2
0
0
−0.5
−2
−1
−4
−1.5
−6
−2 −2
−20
z1
(a) Initial Monte-Carlo Distribution
−2 −2
−40
−1.5
−1
−0.5
0 x1
0.5
1
1.5
(e) Initial Divided Difference Filter Distribution
2
−8 −8
−6
−4
−2
0 z1
2
4
6
8
(f) Transformed Divider Difference Filter Distribution
Figure 1.6: Illustration of Divided Difference Filter Transformation
1.3. ATTITUDE ESTIMATION
13
calculate the covariance. Next, a linearized mapping similar to the Kalman filter approach is used to approximate the transformation, shown in Fig. 1.6(c)–(d). In this case the linear transformation clearly does not match the “truth” covariance determined using the Monte-Carlo method. Lastly, the Divided–Difference transformation is used to approximate the transformed covariance, shown in Fig. 1.6(e)–(f). In this case, only 5 points are used in the propagation, and the resulting covariance propagation is much more accurate than the linearized result. This example serves to illustrate the benefits of the DDF over that of the EKF.
1.3
Attitude Estimation
Attitude estimation techniques often make use of quaternions for the representing the attitude, for several reasons including globally nonsingular kinematics and linear state propagation as discussed in the previous section.87, 88 However, techniques making use of quaternions as state variables are complicated by the quaternion constraint. The usual approach to satisfying the constraint is to estimate an error quaternion at each measurement update and then form the true quaternion estimate from the composition of the estimated error quaternion with the predicted quaternion based on the state transition matrix. Assuming small errors allows for the first three components of the quaternion to be estimated independently of the fourth component, which is essentially amounts to a linearization using small angle assumptions. Recently, constrained filtering approaches have been investigated by Zanetti and Bishop89 and Majji and Mortari90 (also see Ref. 91). These approaches use a Lagrange multiplier formulation to solve a constrained filtering problem for all four components of the error quaternion, rather than using a linearization in order to enforce the quaternion norm constraint. Other attitude parameterizations can be used, provided that a singularity avoidance method is employed to provide a valid attitude description at any condition. One representation with several attractive features are the Modified Rodrigues Parameters (MRP).92 The MRPs have several interesting properties. Firstly, the MRPs constitute a minimal three parameter set of variables that describe the orientation of a rigid body and are nonsingular for any rotation other than multiples of 2π. Tsiotras and Longuski93 discuss that the MRPs can be viewed as the result of a stereographic projection of the unit quaternion sphere onto a three-dimensional hyperplane. Schaub and Junkins94 use this insight to formulate a family of attitude coordinates called the Stereographic Orientation Parameters (SOP), which contain the MRPs as one particular solution of symmetric SOPs. As part of this development it is noted that the MRPs are not unique, but rather there are always two possible MRP sets that can describe a particular orientation. This alternate MRP is known as the shadow MRP set. The shadow MRP set is singular for zero rotations, but is nonsingular for rotations of 2π. This property allows for the development of a singularity avoidance method by switching to and from the shadow MRP set. For example, this switching procedure allows for non–singular optimal attitude control problems to be formulated using a minimal three– parameter family of MRPs as discussed in Ref. 95, in which an analytical mapping is developed for the MRP costates. The application of MRPs to attitude estimation was first explored in Ref. 96 without discussion of singularity avoidance. Other examples make use of MRPs for representing attitude error rather than the global attitude, preferring to keep track of the quaternion.97, 98 In these cases the MRP singularity is never encountered in practice but the additional computations to transform the MRP
1.4. CONTRIBUTIONS
14
error estimate to the quaternion may not always be desirable. The two MRP sets are applied to attitude estimation problems as a singularity avoidance procedure in Refs. 99–101. In these cases, the transformation of the covariance matrix at the switching point has been ignored, although it is not actually required in the particle filtering approach utilized in Ref. 99.
1.4
Contributions
The purpose of this dissertation is to develop robust adaptive state estimation techniques for nonlinear dynamic systems. The robust technique investigated in this research is based on Huber’s generalized maximum likelihood estimation method, which is further generalized for dynamic filtering problems. A new form of the state update equation for first and second–order divided–difference filtering is found by recasting the filtering problem into a linear regression problem at each measurement update and solving the resulting system of equations using Huber’s generalized maximum likelihood theory. A new robust adaptive procedure for real–time tuning of the noise covariances in the filter is found, as a modified version of the Myers–Tapley covariance matching approach. This new adaptive technique makes use of multidimensional outlier detection methods to remove spurious observations in the stored residual sequence in order to compute robust estimates of the noise covariance matrices. This dissertation also introduces a covariance transformation to accompany the shadow MRP mapping for singularity avoidance in attitude estimation problems. The covariance transformation is introduced for Kalman filtering problems by using a first–order analytical mapping of the MRP covariance to and from the shadow MRP set. Subsequently, a divided difference covariance transformation is introduced, suitable for the first and second–order divided difference filters introduced in Refs. 79 and 80. This singularity avoidance technique offers some advantages for spacecraft attitude estimation problems, not the least of which is the fact that a minimal three parameter set of attitude variables can be used a globally nonsingular attitude description. Lastly, the hybrid robust/adaptive nonlinear filtering methods introduced in this dissertation, along with the MRP attitude formulation, are implemented for 6-DOF rendezvous navigation in elliptical orbit. Relatively simple control laws based on feedback linearization are implemented, with these various filtering approaches implemented as observers inside the control loop. These navigation and control methods are tested in a non-Gaussian simulation setting in order to illustrate performance robustness of the techniques in situations where typical assumptions inherent to the navigation state estimation problem are violated.
1.5
Overview
The remainder of this document is divided as follows. Chapter 2 discusses the generalized maximum likelihood estimation technique as it applies to static linear regression problems. Chapter 3 discusses the application of the Huber–based estimation technique to dynamic state estimation problems, including first and second–order filters and adaptive techniques in which the estimator can solve for the measurement and process noise covariances in real time. Here, outlier identification techniques are introduced to provide robustness to the adaptive filtering approach in the presence of nonGaussian errors. Chapter 4 develops the 6-DOF equations of motion, guidance and control methods,
1.5. OVERVIEW
15
and sensor models suitable for the rendezvous problem in elliptical orbits. Chapter 5 provides simulation results to illustrate the performance of the robust and adaptive filtering methods applied to spacecraft attitude estimation (including comparisons between quaternion-based approaches and the MRP-based approach advocated in this dissertation) and to the 6-DOF rendezvous problem in an elliptical lunar orbit.
Chapter 2
Some Concepts in Regression Theory 2.1
Introduction
The purpose of this section is to review some basic concepts in regression theory. The estimation of a static linear system will later be shown to be easily extended to discrete-time dynamic estimation. In this section the linear regression model of the form y = Hx + w
(2.1)
is considered, where y represents the measurement data, x is the variable to be estimated, H represents the relationship between x and y and is usually called the design matrix, and w represents the random measurement error.
2.2 2.2.1
Maximum Likelihood Estimation Overview of the Method
The method of maximum likelihood estimation was introduced by Fisher102 in a series of papers between 1912 and 1922, although some of the basic ideas had been touched on previously by Bernoulli103 for semi-circular distributions, and Gauss 104 in connection with an effort to determine the probability distribution that made the least squares estimate the most probable estimate.30, 31 The maximum likelihood method proceeds as follows. Given a sample of m measurement data y = [y1 , · · · , ym ]T , let the joint probability density function of the measurement data for a given value of x be denoted by f (y|x). The likelihood function L is then defined as L (x; y) = f (y|x)
(2.2)
If the observation data are considered to be independent and identically distributed, then the joint density function is the product of the marginal density functions.105 Also, the density function reduces to a function only of the residuals between the estimate and the observation data, defined as ζ = Hx − y. Under these assumptions, the likelihood function takes the form L (x; y) =
m Y i=1
16
f (ζ)
(2.3)
2.2. MAXIMUM LIKELIHOOD ESTIMATION
17
The most probable value of x (the mode of the joint distribution) is the value of x that maximizes the likelihood function. In practice it is more convenient to minimize the natural logarithm of the likelihood function. Such a value of x can be found by minimizing the cost function J(x) = −
m X
ln [f (ζi )]
(2.4)
i=1
If the density function is differentiable, then the solution to the maximum likelihood regression problem can be found from the from the implicit equation m X i=1
φ(ζi )
∂ζi =0 ∂x
(2.5)
where φ(ζi ) = −f 0 (ζi )/f (ζi ). By defining the function ψ (ζi ) = φ(ζi )/ζi , and the matrix Ψ = diag [ψ (ζi )], the implicit equation can be written in matrix form as H T Ψ (Hx − y) = 0
(2.6)
Note that, in general, the implicit likelihood equation (2.6) is nonlinear, since the matrix Ψ is a function of x. Solutions of the likelihood equation can be determined by the application standard iterative techniques for nonlinear systems. The solution of the likelihood equation is the maximum ˆ. likelihood estimate for x and is denoted by x Once the solution of the maximum likelihood method is obtained, the covariance associated with the estimate can be computed from22 ¡ ¢ E φ2 ¡ T ¢−1 ˆ H H (2.7) P = [E (φ0 )]2 ˆ and It can be shown that estimators of this form are asymptotically normal with mean x ˆ covariance P . Further, the estimator is minimum variance and asymptotically unbiased, when the true measurement error distribution follows the assumed distribution exactly, and when the assumed distribution is unimodal. See Ref. 106 for further details.
2.2.2
Correlated Residuals
The development of the maximum likelihood estimation method made the assumption that the residuals were independent and identically distributed. If in fact the residuals are correlated then the maximum likelihood method is still applicable, but a transformation of variables is required. If the measurement error covariance matrix is given by R, then the regression problem can be transformed to uncorrelated coordinates (this transformation is sometimes known as stochastic decoupling) by defining the new variables e = R−1/2 w w −1/2
e = R y y −1/2 f = R H H
(2.8) (2.9) (2.10)
Upon defining the above quantities, the regression problem is transformed into f +w e = Hx e y
(2.11)
2.2. MAXIMUM LIKELIHOOD ESTIMATION
18
e = I, In the transformed problem, the measurement errors have a covariance matrix given by R h i ew e T . This fact implies that the transformed as can be seen by expanding the expectation E w residuals are linearly independent and hence that the standard maximum likelihood method can be applied to the transformed linear regression problem.
2.2.3
Consistency, Efficiency, and Bias
This section discusses several properties of estimators, namely consistency, efficiency, and bias. These properties are important qualitative measures of estimator performance. 2.2.3.1
Consistency
ˆ is said to be consistent if the value of the estimator converges to the true value of the An estimator x parameter as the sample size goes toward infinity. Consistency can be expressed mathematically as ˆ=x lim x (2.12) n→∞
ˆ. where n is the number of observations processed by the estimator x 2.2.3.2
Efficiency
A useful metric for comparing estimators is the relative efficiency, which is the ratio of the maximum likelihood asymptotic variance and the asymptotic variance of the estimator. If the asymptotic variance of the maximum likelihood estimator is denoted by PˆM LE , then the asymptotic relative efficiency is defined as e = PˆM LE /Pˆ , where Pˆ is the asymptotic variance of the estimator in question. Note that the best possible asymptotic relative efficiency is e = 1, since the maximum likelihood estimator is asymptotically minimum variance at the particular distribution. 2.2.3.3
Bias
ˆ is said to be unbiased if B (ˆ An estimator x x) = E (ˆ x) − x = 0. For a consistent estimator, the mean–squared error, variance, and bias are related via h i h i E (ˆ x − x) (ˆ x − x)T = E (ˆ x − E (ˆ x)) (ˆ x − E (ˆ x))T + (E (ˆ x) − x) (E (ˆ x) − x)T ˆ + B (ˆ = P x) B (ˆ x)T
(2.13)
Note that an unbiased estimate implies that the mean-squared error is equal to the variance.
2.2.4
Example: Maximum Likelihood Estimator for the Gaussian Distribution
As an example of maximum likelihood regression, consider the case when the error distributions are Gaussian. Specifically, when the marginal density function takes the form · ¸ 1 ζi2 f (ζi ) = √ exp − 2 (2.14) 2σ 2πσ
2.2. MAXIMUM LIKELIHOOD ESTIMATION
19
6
0.4 0.35
4
0.3
2 0.25
Quantiles
Probability Density Function
Gaussian Laplacian
Gaussian Laplacian
0.2 0.15
0
−2
0.1
−4 0.05 0 −3
−2
−1
0 Residual
1
2
3
−6
(a) Density Functions
−2
−1.5
−1
−0.5 0 0.5 Gaussian Quantiles
1
1.5
2
(b) Theoretical Quantile–Quantile Plot
Figure 2.1: Unit Variance Gaussian and Laplacian Distributions where σ 2 is the variance of the distribution. Note that the center of the density is assumed, without loss of generality, to be located at the origin. With f (ζi ) given by Eq. (2.14), the the function φ(ζi ) takes the form ζi f 0 (ζi ) = 2 (2.15) φ (ζi ) = − f (ζi ) σ ¡ ¢ and the function ψ(ζi ) is clearly ψ(ζi ) = 1/σ 2 , which implies that Ψ = 1/σ 2 I. The implicit likelihood equation then becomes (2.16) H T (Hx − y) = 0 and can be solved to yield the estimate ¡ ¢−1 T ˆ = HT H x H y
(2.17)
which is the familiar least squares or minimum `2 norm solution. In the correlated multivariate Gaussian case, the maximum likelihood estimate can be written ³ T ´−1 T ¡ ¢ f H f f y = H T R−1 H −1 H T R−1 y ˆ= H x H (2.18) which is the standard weighted least squares solution.
2.2.5
Example: Maximum Likelihood Estimator for the Laplacian Distribution
The maximum likelihood estimator for the Laplacian distribution can be found by first writing the density function · ¸ 1 |ζi | f (ζi ) = exp − (2.19) 2b b where b is a scale parameter, such that the variance of the distribution is 2b2 . The function φ(ζi ) takes the form sgn (ζi ) f 0 (ζi ) = (2.20) φ(ζi ) = − f (ζi ) b
2.3. GENERALIZED MAXIMUM LIKELIHOOD ESTIMATION
20
In the scalar estimation case, the implicit likelihood equation reduces to n X
sgn (ζi ) = 0
(2.21)
i=1
which implies that the solution for x ˆ is such that half the residuals are negative and half the residuals are positive. This result is the sample median.
2.3 2.3.1
Generalized Maximum Likelihood Estimation Overview of the Method
Huber in 196438 introduced a new class of estimation methods known as the generalized maximum likelihood method, also known as the technique of M -estimation. In this method, one seeks to minimize a function of the residuals of the form J (x) =
m X
ρ (ζi )
(2.22)
i=1
where ρ is an arbitrary function. Note that the generalized maximum likelihood method reduces the standard maximum likelihood method in the special case when ρ(ζi ) = − ln [f (ζi )]. The solution to the generalized maximum likelihood problem can be found from the implicit equation m X i=1
φ(ζi )
∂ζi =0 ∂x
(2.23)
where φ(ζi ) = ρ0 (ζi ). By defining the function ψ (ζi ) = φ(ζi )/ζi , and the matrix Ψ = diag [ψ (ζi )], the implicit equation can be written in matrix form as H T Ψ (Hx − y) = 0
(2.24)
In generalized maximum likelihood estimation, the function ρ can be chosen to yield an estimator ˆ with certain desirable properties. A desirable property of the solution of the generalized maximum x likelihood technique is that of robustness with respect to deviations from the assumed underlying probability distribution. Huber38 introduces a ρ function of the form 1 2 for |ζi | < γ 2 ζi ρ (ζi ) = (2.25) 1 2 γ|ζi | − 2 γ for |ζi | ≥ γ where γ is a tuning parameter. This ρ function is a blend of the minimum `1 and `2 norm functions, and estimates derived from the use of this ρ function have desirable robustness properties. Specifically, the estimates minimize the maximum asymptotic estimation variance when applied to contaminated Gaussian densities. Note that as γ → 0, Eq. (2.25) approaches the `1 norm, which is equivalent to the median in the scalar case, and that as γ → ∞, Eq. (2.25) approaches the `2 norm, which is equivalent to the mean in the scalar case. The ρ, φ, and ψ functions for the `1 , `2 ,
2.3. GENERALIZED MAXIMUM LIKELIHOOD ESTIMATION
21
and Huber cases are shown in Fig. 2.2 for comparison. Note that the ρ, φ, and ψ functions are sometimes known as the score, influence, and weight functions, respectively. The analytic forms of the influence and weighting functions for the Huber estimator are provided as follows. 1 for ζi ≥ γ φ (ζi ) = ζi for |ζi | < γ −1 for ζ ≤ −γ i for |ζi | < γ 1 ψ (ζi ) = 1/|ζi | for |ζi | ≥ γ
(2.26)
(2.27)
Huber38 shows that the ρ function given in Eq. (2.25) is asymptotically optimally robust in the ² neighborhood of the Gaussian distribution. Explicitly, if the measurement errors follow a perturbed Gaussian density function of the form µ ¶ w2 1−² √ exp − + ²g(w) (2.28) f (w) = 2 2π where ² is a perturbing parameter and g(w) is an unknown perturbing density function, then the M -estimation technique with ρ function given by Eq. (2.25) minimizes the maximum asymptotic estimation variance in the ² neighborhood of the Gaussian distribution. Further, it can be shown that estimators of this form are asymptotically normal and unbiased.107
2.3.2
Robustness Concepts and Measures
This section discusses some more formal definitions of robustness of an estimator with respect to deviations from some assumed underlying probability distribution. These concepts of robustness of an estimator to such deviations were developed by Hampel,108, 109 and are known as qualitative robustness, global robustness, and local robustness. Local robustness is most important for the purposes of this dissertation, however a short review of all concepts is provided in the following sections. 2.3.2.1
Qualitative Robustness
Qualitative robustness considers the impact to the estimator stemming from small deviations from the assumptions under which it was developed. A statistical procedure that is qualitatively robust implies that small changes from the assumed model produce small changes on the estimate, where small changes in the assumed model include cases of large changes to a small subset of the data (i.e. outliers) or small changes to all the data. A more precise mathematical definition is beyond the scope of this dissertation but can be found in Refs. 108 and 109. However, it is clear from discussion and examples presented in previous sections that the least–squares estimation technique is not qualitatively robust.
2.3. GENERALIZED MAXIMUM LIKELIHOOD ESTIMATION
3
4.5 l 2 l1
4
2
Huber
3.5
1
3 2.5
φ(ζ)
ρ(ζ)
22
0 l2 l1
2
−1
1.5
Huber
1
−2 0.5 0 −3
−2
−1
0
1
ζ
2
−3 −3
3
−2
(a) Comparison of ρ Functions
−1
0 ζ
1
2
3
(b) Comparison of φ Functions
1.5 l 2 l1 Huber
ψ(ζ)
1
0.5
0 −3
−2
−1
0 ζ
1
2
3
(c) Comparison of ψ Functions
Figure 2.2: Comparison of ρ, φ, and ψ Functions 2.3.2.2
Global Robustness
The concept of global robustness relates to the level of perturbation that the estimator can handle before breaking down completely. Quantitative measures related to the concept of global robustness are known as the maximum bias curve and the breakdown point. For a contaminated distribution of the form G = (1 − ²) F + ²H, where F is the assumed distribution and H is an unknown contaminating distribution, the maximum bias can be represented by bmax (²) = sup|ˆ x (G) − x ˆ (F ) |. The breakdown point describes the maximum value of ² for which the estimator has a finite maximum bias and is denoted by ²∗ . An estimator is not globally robust if ²∗ = 0. Clearly the highest possible value of ²∗ is 1/2. Least–squares estimation is not globally robust since a single outlier can take the bias to infinity.
2.3. GENERALIZED MAXIMUM LIKELIHOOD ESTIMATION
2.3.2.3
23
Local Robustness
The concept of local robustness concerns the effect of infinitesimal perturbations from the assumed model on the bias and variance. A robustness measure related to the concept of local robustness is known as the influence curve or influence function. The asymptotic influence function in a one-dimensional case can be written as109 ¯ φ (ζ) ∂x ˆ (G) ¯¯ = ν (ζ) = (2.29) ¯ ∂² ²=0 E [φ0 (ζ)] where G = (1 − ²) F +²∆, ∆ is a unit mass distribution at the point x. Since E [φ0 (ζ)] is a constant, the asymptotic influence function is proportional to φ (ζ). The asymptotic bias is locally related to the influence function via b (²) = |ˆ x (G) − x ˆ (F ) | ≈ ²|ν (ζi ) |. Therefore a locally robust estimator must have a bounded influence function for the bias to remain finite in the presence of contamination, which in turn implies that φ (ζi ) be bounded for all x. By this definition, the least–squares technique is not locally robust whereas the `1 and Huber techniques are, as can be gathered from Fig. 2.2. The influence function for a linear regression estimator is somewhat more complicated and takes the form109 "µ ¶µ ¶ #−1 ∂ζi ∂ζi T φ (ζi ) ∂ζi E (2.30) νi (ζi ) = E [φ0 (ζi )] ∂x ∂x ∂x In the linear regression case, it is important to note that the influence function can be bounded by an appropriate function φ, but can be unbounded depending on (∂ζi /∂x). Outlying (∂ζi /∂x) are known as leverage points and will be discussed in following sections. It is important to note that linear regression estimators with bounded φ functions are indeed locally robust in the absence of leverage points.
2.3.3
Example of a Gaussian Mixture
To illustrate the advantages of the generalized maximum likelihood techniques, consider for a moment the scalar estimation problem found by setting H = 1. This problem corresponds with estimating the center of a probability distribution given a sample of measurements. In this example, the measurement data are drawn from a mixture of two Gaussian densities given by the function ¶ µ µ ¶ ² 1−² w2 w2 +√ (2.31) f (w) = √ exp − exp − 2 2 2a 2π 2πa where a2 > 1 is the variance of the perturbing density. The mixture of Gaussian densities in Eq. 2.31 was first introduced by Newcomb for the purpose of studying heavy–tailed measurement data.29, 37 ¡Since ¢ H = 1, the estimation variance is a scalar quantity that simplifies from Eq. (2.7) as Pˆ = E φ2 / [E (φ0 )]2 . The `1 , `2 , and Huber estimation variances can be found by carrying out the the necessary integrals. If the asymptotic variance of the `1 , `2 , and Huber estimators are denoted by Pˆ`1 , Pˆ`2 , and PˆH , respectively, then the results are π³ ² ´−2 Pˆ`1 = 1−²+ (2.32) 2 a ¡ ¢ Pˆ`2 = 1 + ² a2 − 1 (2.33)
2.3. GENERALIZED MAXIMUM LIKELIHOOD ESTIMATION
24
(
PˆH
" µ ¶ r µ 2 ¶# ¡ ¢ γ 2 −γ = γ 2 + (1 − ²) 1 − γ 2 erf √ γ exp − π 2 2 " µ ¶ r µ 2 ¶#) ¡ ¢ γ 2 −γ +² a2 − γ 2 erf √ − aγ exp π 2a2 2a ¶ µ ¶¸−2 · µ γ γ × (1 − ²) erf √ + ²erf √ 2 2a
(2.34)
1 1 0.95
0.8
Asymptotic Relative Efficiency
Asymptotic Relative Efficiency
0.9
0.7 0.6 0.5 0.4 0.3 l2 l1
0.2 0.1 0 0
Huber 0.8 0.75 0.7 0.65
0.2
0.4 0.6 Perturbing Parameter ε
0.8
0.6 0
1
0.005
0.01 0.015 0.02 Perturbing Parameter ε
0.025
0.03
(b) Comparison of Asymptotic Relative Efficiencies (Detail) 1
0.45 ε=0 ε=0.005 ε=0.027
0.35
0.9 Asymptotic Relative Efficiency
0.4 Probability Density Function
l 2 l1
0.85
Huber
(a) Comparison of Asymptotic Relative Efficiencies
0.3 0.25 0.2 0.15 0.1 0.05 0 −3
0.9
0.8 0.7 0.6 0.5 0.4
γ=1.0 γ=1.25 γ=1.5 γ=1.75 γ=2.0
0.3 0.2 0.1
−2
−1
0 Residual
1
(c) Comparison of Density Functions
2
3
0 0
0.2
0.4 0.6 Perturbing Parameter ε
0.8
1
(d) Comparison of Asymptotic Relative Efficiencies
Figure 2.3: Comparison of Asymptotic Relative Efficiencies for Gaussian Mixture The asymptotic relative efficiencies are shown in Fig. 2.3(a) as a function of the perturbing parameter ² for fixed a = 5 and γ = 1. The results for the entire range of ² is shown in Fig. 2.3(a) where just the portion of ² between 0 and 0.03 is shown in Fig. 2.3(b). From the plots in Fig. 2.3 it is apparent that when the data are perfectly Gaussian, the `2 estimator is more efficient than
2.3. GENERALIZED MAXIMUM LIKELIHOOD ESTIMATION
25
either the `1 or the Huber estimator. This behavior is to be expected since the `2 estimator is the maximum likelihood estimator at the Gaussian distribution. When the perturbing parameter ² is increased, the `2 efficiency decreases sharply, but the `1 and Huber efficiencies show a more shallow decrease than the `2 case. The Huber and `1 estimators rapidly show higher efficiencies than the `2 case as ² increases away from zero. The `1 estimator becomes superior to the `2 estimator at ² = 0.027 and the Huber estimator becomes superior to the `2 estimator at ² = 0.005. As ² increases further, the distribution function again becomes nearly Gaussian for which the `2 estimator has the minimum variance. This example illustrates the point that a small contamination of an assumed Gaussian model by another distribution will lead to a rapid loss of efficiency of the least squares method, whereas the Huber estimator exhibits a reduced sensitivity. In fact, the Huber efficiency is nearly constant across a wide range of ², illustrating the robustness of the technique. Fig. 2.3(c) shows the density functions for the Gaussian mixture for ² = 0 (the perfectly Gaussian case), for ² = 0.005 and for ² = 0.027. The density corresponding to ² = 0.005 can hardly be distinguished from the perfectly Gaussian case. This plot serves to show that apparently extremely small deviations from Gaussianity can have a large impact on the efficiency of the least squares estimator. The asymptotic relative efficiencies are shown in Fig. 2.3(d) as a function of the perturbing parameter ² for fixed a = 5 and γ ranging between values of 1.0 and 2.0 in increments of 0.25. These curves show how the asymptotic efficiency varies with the tuning parameter γ, in particular the un-contaminated efficiency (² = 0) and the behavior for moderate contamination levels. It is interesting to note that the results for small values of γ begin with smaller efficiencies but become superior for moderate values of ². 1 2
l
k=3 k=2 k=1
0.8 0.7 0.6 0.5 0.4 0.3 0.2
k=3 k=2 k=1
0.9 0.85 0.8 0.75 0.7 0.65
0.1 0 0
2
0.95 Asymptotic Relative Efficiency
Asymptotic Relative Efficiency
1
l
0.9
0.2
0.4 0.6 Perturbing Parameter ε
0.8
(a) Comparison of Asymptotic Relative Efficiencies
1
0.6 0
0.005
0.01 0.015 0.02 Perturbing Parameter ε
0.025
0.03
(b) Comparison of Asymptotic Relative Efficiencies (Detail)
Figure 2.4: Comparison of Asymptotic Relative Efficiencies for Gaussian Mixture The plots in Fig. 2.4 show the asymptotic relative efficiencies for the minimum `2 norm case and for three cases of data censoring. Recall from the previous section that the data censoring technique simply discards data points with large residuals, rather than processing them according to a statistical technique such as that introduced by Huber. The censoring technique corresponds
2.3. GENERALIZED MAXIMUM LIKELIHOOD ESTIMATION
26
to a ψ function of the form ψ(ζi ) = 1, for |ζi | < k and zero otherwise. The plots in Fig. 2.4 show the resulting asymptotic relative efficiencies for the minimum `2 norm case and for the data censoring with k = 1, 2, and 3. Several important points can be gleaned from the plots in Fig. 2.4 along with comparison to the results in Fig. 2.3. First, is that the data censoring technique with k = 3 maintains a high efficiency for small values of the perturbing parameter, and the censoring results for k = 2 and k = 1 are corresponding lower than as for k = 3. It is interesting to note that the efficiency for the censoring technique with k = 2 becomes superior to that for k = 3 for ² > 0.02, and stays higher until well beyond ² = 0.5. The efficiency for data censoring with k = 1 is always lower than the other cases. It should also be noted that the results for all three censoring cases become lower than that corresponding to the minimum `2 norm for ² > 0.6. It can be seen by way of comparison to Fig. 2.3 that the data censoring results appear attractive only for very small contamination levels. The Huber processing technique provides results with a higher efficiency than the data censoring techniques for cases beyond this level.
2.3.4
Example of a Gaussian–Cauchy Mixture
As a slightly more extreme example, consider the Gaussian–Cauchy mixture given by the density µ ¶ 1−² w2 ² 1 f (w) = √ exp − + (2.35) 2 π 1 + w2 2π Note that for any ² > 0, the variance of this distribution is infinite. Therefore, the asymptotic variance of the `2 estimator applied to data drawn from this distribution is also infinite for ² > 0. The `1 and Huber estimator asymptotic variances are finite and given by #−2 2² 2 (1 − ²) + = π π " r µ 2¶ ¢ 2γ² 2 −γ 2² ¡ 2 = γ + +γ (² − 1) exp − 1 + γ 2 arctan γ+ π π 2 π µ ¶¸ · µ ¶¸−2 ¡ ¢ γ γ 2² 1 − γ 2 − ² + γ 2 ² erf √ · arctan γ + (1 − ²) erf √ π 2 2 "r
Pˆ`1 PˆH
(2.36)
(2.37)
The `1 and Huber asymptotic relative efficiencies are shown in Fig. 2.5. Here it is apparent that the Huber estimation technique performs quite well, even when applied to a problem where the random measurement errors have infinite variance.
2.3.5
Choice of Tuning Parameter
Figure 2.6(a) shows the influence of the choice of the tuning parameter γ on the asymptotic relative efficiency of the Huber technique for the Gaussian case (² = 0). The previous examples have shown that for a penalty in asymptotic relative efficiency at the model distribution (the Gaussian case), the relative efficiency is nearly constant in an ² neighborhood of the model distribution. The efficiency can vary between one for γ = ∞ (the `2 case) and 2/π for γ = 0 (the `1 case). If the value of the parameter ² is known (even though the density function g(w) of the perturbing
2.3. GENERALIZED MAXIMUM LIKELIHOOD ESTIMATION
27
1 l1 Asymptotic Relative Efficiency
0.95
Huber
0.9 0.85 0.8 0.75 0.7 0.65 0.6 0
0.2
0.4 0.6 Perturbing Parameter ε
0.8
1
Figure 2.5: Comparison of Asymptotic Relative Efficiencies for Gaussian–Cauchy Mixture 2 1.8 0.95
Optimal Tuning Parameter γ
Asymptotic Relative Efficiency for ε=0
1
0.9 0.85 0.8 0.75 0.7 0.65 0.6 0
1.6 1.4 1.2 1 0.8 0.6 0.4 0.2
0.5
1
1.5 2 2.5 Tuning Parameter γ
3
3.5
(a) Huber Asymptotic Relative Efficiency for ² = 0
4
0 0
0.2
0.4 0.6 Perturbing Parameter ε
0.8
1
(b) Optimal Tuning Parameter γ
Figure 2.6: Huber Gaussian Asymptotic Relative Efficiency and Optimal Tuning Parameter distribution is unknown), then the best choice of γ has been determined by Huber.30, 38 If ² = ²0 is the known perturbing parameter, then the optimal choice of γ, denoted by γ ? , is given by the implicit equation30, 38 " # r µ ?¶ 1 1 2 (γ ? )2 γ = ? exp − + erf √ (2.38) 1 − ²0 γ π 2 2 For a given value of ², estimates computed using γ = γ ? maximize the asymptotic relative efficiency across the range of all possible values of γ.30, 38 The optimal value of the tuning parameter γ ? is shown as a function of ²0 in Fig. 2.6(b).
2.3. GENERALIZED MAXIMUM LIKELIHOOD ESTIMATION
28
When ²0 = 0 the best tuning parameter is infinite. This value is expected because when ²0 = 0, the distribution is Gaussian and least squares estimation (γ = ∞) is minimum variance. As ²0 → 1, the tuning parameter γ ? → 0. This behavior suggests that the median is the best choice of estimation technique when the noise density f (w) = g(w) is completely unknown. However, note that if ²0 > 1/2 then the model distribution should no longer be taken as Gaussian since the perturbing density is in fact greater in proportion. If the perturbing parameter ² is unknown, then the choice of γ is typically motivated by a desired variance at the model distribution. One common choice is γ = 1.345; for this value the Huber filter will exhibit estimation error variances that are 5% larger than that of the least squares method when the measurement error distributions are truly Gaussian. Generally any value of γ between 1.0 and 2.0 is suggested.38
2.3.6
The Huber Estimator as a Maximum Likelihood Estimator 6
0.4 Gaussian Laplacian Least Favorable
4
0.3
2 0.25
Quantiles
Probability Density Function
0.35
Gaussian Laplacian Least Favorable
0.2 0.15
0
−2
0.1
−4 0.05 0 −3
−2
−1
0 Residual
1
(a) Density Functions
2
3
−6
−2
−1.5
−1
−0.5 0 0.5 Gaussian Quantiles
1
1.5
2
(b) Theoretical Quantile–Quantile Plot
Figure 2.7: Unit Variance Gaussian, Laplacian, and Least Favorable Distributions This section poses the same question as did Gauss to the method of least squares: For what probability distribution (if any) is the Huber estimator a maximum likelihood estimator? This question can be answered by simply equating the Huber ρ function to the log-likelihood function, as ρ (ζi ) = − ln [f (ζi )]. This equation can be solved to yield µ ¶ 1−² f (ζi ) = √ exp [−ρ (ζi )] (2.39) 2π where ρ (ζi ) is as found in Eq. (2.25) with γ is determined from Eq. (2.38) for a given ² (or the opposite). The coefficient arises to ensure a unit total area under the density curve. This density function is known as the least favorable density, and is shown in Fig. 2.7(a) for γ = 1, ² = 0.1428, along with the unit variance Gaussian and Laplacian densities. A comparison of the theoretical quantile–quantile plot is shown in Fig. 2.7(b). Clearly the least favorable density is something in between the Gaussian and the Laplacian, which is in keeping with the fact that the Huber estimator
2.4. LEVERAGE POINTS
29
is a blended minimum `2 and `1 norm technique, which are the maximum likelihood estimators for the Gaussian and the Laplacian distribution, respectively.
2.4
Leverage Points
Although the Huber generalized maximum likelihood technique has been proven to exhibit robustness with respect to deviations from an assumed Gaussian error model, an estimator designed using this approach may still lack robustness in the multiple linear regression case due to leverage points, as can be seen from the influence function of linear regression estimators shown in Eq. (2.30). Leverage points are outliers in the design matrix rather than outliers in the measurement errors. Outliers in the design matrix can artificially give extra weight to the associated measurements, whose consequences can be catastrophic in the case that an outlier in the measurement error statistics is combined with an outlier in the design matrix. This section discusses the design of estimators that are robust with respect to leverage points. In this section, two leverage point identification methods are introduced. The first method is a classical technique that is based on the weighted Euclidean norm of the separation between a possible outlier and the sample mean, known as Mahalanobis Distances, introduced in Ref. 114. The weighting in this method is based on the sample covariance matrix. The second method, known as Projection Statistics, is a robust approach in which the sample mean and covariance are replaced by the sample median and the median absolute deviation, respectively. The latter method is said to be robust because it is insensitive to clusters of outliers, unlike the classical method.
2.4.1
The Mahalanobis Distances
Given a cloud of m points in n dimensions represented by the vectors hi for i = 1, · · · , m, the Mahalanobis distances are defined as q¡ ¢ ¡ ¢ ¯ T C −1 hi − h ¯ (2.40) Mi = hi − h ¯ is the sample mean and C is the sample covariance matrix, given by the equations where h ¯ = h
m
1 X hi m
(2.41)
m ¢¡ ¢ 1 X¡ ¯ hi − h ¯ T hi − h m−1
(2.42)
i=1
C =
i=1
respectively. The Mahalanobis distances can also be expressed as the solution to a maximization problem of the form115 ° ° ° T T ° 1 Pm °hi v − m j=1 hj v ° r Mi = max (2.43) ³ ´ 2 kv k=1 T T 1 Pm 1 Pm k=1 hk v − m j=1 hj v m−1 The Mahalanobis Distances represent the surface of an n-dimensional ellipsoid centered at the sample mean. The square of the Mahalanobis distances follow a χ2 distribution with n degrees of
2.4. LEVERAGE POINTS
30
freedom, assuming that the input data are Gaussian. Therefore, an outlier identification method is to consider all points satisfying q Mi > χ2n,α (2.44) to be outliers, where α is the probability that a value falls inside the ellipse (for example, α = 0.95). While the Mahalanobis distances are simple to conceptualize and easy to compute, the method suffers from sensitivity to clusters of outliers. This sensitivity is due to the masking effect, in which it is possible to find groups of points with nonzero errors that can sum to produce very small residuals. The masking effect in the Mahalanobis distances is related to the sensitivity of the sample mean and covariance, which are not robust estimators. In the case of clustered outliers the sample mean can be pulled toward their direction and away from the main cluster of data, which serves also to increase the size of the sample covariance. In effect, these sensitivities serve to hide or mask the cluster of outliers since their associated Mahalanobis distances will not be larger than the main group of data. See Refs. 116 and 117 for further information on the masking effect and sensitivity of the Mahalanobis distances. Another common leverage point identification scheme is based on the diagonal¡ elements ¢−1of the ˆ = HT H least-squares projection matrix. By substituting the least–squares estimate, x HT y ˆ = Λy, where into Eq. (2.1), then the fitted values of y are given by y ¡ ¢−1 T (2.45) Λ = H HT H H is known as the projection matrix. It can be shown that the diagonal elements of the projection matrix are directly proportional to the square of the Mahalanobis distance.117 The relationship of the Mahalanobis distances to the least–squares projection matrix underscores the lack of robustness of the Mahalanobis distances, since the least–squares method is itself non-robust. A robust alternative for leverage point identification will be discussed next.
2.4.2
Projection Statistics
A robust approach to the problem of outlier identification is to replace the sample mean and covariance in the equation for the Mahalanobis distances, Eq. 2.43, with the sample median and the median absolute deviation from the median.115 These estimators of location and scale are known to be robust with respect to outliers and therefore one may expect that the computation of a Mahalanobis–like quantity based on these parameters will also be robust with respect to outliers. These quantities are known as Projection Statistics, and are defined as the solution to the maximization problem # " ° T ¡ ¢° °hi v − median hTj v ° ¡ T ¢°¢ ¡° Pi = max (2.46) ° kv k=1 c · median °hT k v − median hj v where c = 1.4826 in the denominator is a correction factor to ensure unbiasedness.24 The maximization problem can be approximated by considering only the directions that correspond to the unit vectors of the individual data points relative to the median of the point cloud. An algorithm for computing the approximate projection statistics is given in Ref. 118 and is repeated below. £ ¤ Given a matrix H = h1 h2 · · · hm , the projection statistics can be computed by means of the following procedure.
2.4. LEVERAGE POINTS
31
1. Let the vector m represent the median of the column space of the matrix H. 2. Compute the unit vectors of the individual data points relative to the median. These unit vectors are given by v i = (hi − m) /khi − mk for each i = 1, · · · , m. 3. Compute the standardized projections si = kz i − median (z j ) k/mad(z i ), where z i = hT v i and mad(z i ) = c · median |z i − median (z j )|. 4. The projection statistics are then found from Pj = maxi (sij ), where sij represents the jth element of si . Having computed the projection statistics, one could potentially use them directly for multidimensional outlier detection. The projection statistics can also be used to compute robust distances, Ri , which are defined as a weighted form of the Mahalanobis distances where the weights are a function of the projection statistics. The robust distances are defined as116 q¡ ¢ ¡ ¢ ¯ r T Cr −1 hi − h ¯r Ri = (2.47) hi − h ¯ r and Cr are a robust mean and covariance matrix, calculated from where h ¯r = h
"m X i=1
Cr =
"m X
#−1 # "m X wi wi hi ·
(2.48)
i=1
# "m #−1 X ¢T ¢¡ ¡ ¯r ¯ r hi − h · wi wi hi − h
(2.49)
i=1
i=1
where wi are weights computed from the projection statistics by means of · ³ 2 ´2 ¸ χn,α wi = min 1, P i
(2.50)
The robust distances calculated through the projection statistics algorithm grants an improvement in robustness properties without a great increase in computation, depending on the dimensionality of the system in question. In fact, the projection statistics method may be faster to compute than the classical Mahalanobis distances in high dimensions, since the former does not require the inversion of the sample covariance matrix. The following example case serves to illustrate the advantage of projection statistics in leverage point identification.
2.4.3
Simple Example of Leverage Point Identification
To illustrate the advantages of the projection statistics over the classical Mahalanobis distances, consider a simple example from power system state estimation.119 In the following example, consider the matrix H given by · H=
x1 1 −1 0 0 11 −1 y1 0 0 −1 1 −10 −1
¸T (2.51)
2.4. LEVERAGE POINTS
32
2
2
0
0
−2
−2
−4
−4
Y
Y
← (x1 , y1 )
−6
−6
−8
−8
−10
−10
−2
0
2
4
6
8
10
12
−2
(x1 , y1 ) → 0
2
4
X
6
8
10
12
X
(a) Point Cloud for x1 = 1, y1 = −1
(b) Point Cloud for x1 = 10, y1 = −10
Figure 2.8: Elements of H Matrix Table 2.1: Comparison of Mi and Pi
(a) x1 = 1, y1 = −1
Point 1 2 3 4 5 6 7
Mi 0.26 1.21 0.76 0.71 1.40 2.25 1.54
Pi 0.67 0.67 1.35 0.67 1.35 13.49 1.35
(b) x1 = 10, y1 = −10
Point 1 2 3 4 5 6 7
Mi 1.47 1.30 0.84 0.75 1.45 1.56 1.53
Pi 7.16 0.67 0.75 0.67 1.35 7.57 1.35
The points in this matrix are shown in Fig. 2.8(a) for values x1 = 1, y1 = −1 and in Fig. 2.8(b) for values x1 = 10, y1 = −10. In the first case, one leverage point exists whereas two leverage points in a cluster appear in the second case. The Mahalanobis distances and the projection statistics have been computed for each case and are shown in Table 2.1. If the typical 0.95 χ2 test is used ¢1/2 ¡ to identify leverage points, then any value of Mi or Pi that exceeds χ22,0.95 ≈ 2.45 should be identified as a leverage point. In the example with x1 = 1, y1 = −1, point 6 is clearly identified as a leverage point the projection statistics, but the value of the Mahalanobis distance associated with this point does not exceed the threshold, although it is the largest value. In the case of x1 = 10, y1 = −10, the situation is worsened because of the clustered leverage points. Here, the projection statistics correctly identifies the leverage points but the Mahalanobis distances do not. In fact, the Mahalanobis distances associated with the two leverage points are not any larger than those associated with the other (non-leverage) points. This behavior is due to the masking effect of clustered leverage points.
2.5. MODIFIED GENERALIZED MAXIMUM LIKELIHOOD ESTIMATION
2.5
33
Modified Generalized Maximum Likelihood Estimation
The method of generalized maximum likelihood estimation can be modified to provide robustness against leverage points by means of re-weighting the residuals by functions of the measure of the spread of the point cloud. Two methods are in common use for providing robustness against leverage points in linear regression, which are discussed in the following sections.
2.5.1
Mallows Form
The modified generalized maximum likelihood technique with leverage point identification is said to be in Mallows form120, 121 if the cost function is written as J (x) =
m X
wi ρ (ζi )
(2.52)
i=1
where wi are the leverage point weights that are determined according to one of the previously developed leverage point identification methods. The solution of the Mallows modified generalized maximum likelihood technique can be found by solving for the minimum of the cost function by means of the equation m X
wi φ (ζi )
i=1
∂ζi =0 ∂x
(2.53)
where φ(ζi ) = ρ0 (ζi ). By defining the function ψ (ζi ) = wi φ(ζi )/ζi , and the matrix Ψ = diag [ψ (ζi )], the implicit equation can be written in matrix form as H T Ψ (Hx − y) = 0
(2.54)
which is in the same form as Eq. (2.24). The influence function of a Mallows estimator is given by109 wi φ (ζi ) E νi (ζi ) = E [wi φ0 (ζi )]
"µ
∂ζi ∂x
¶µ
∂ζi ∂x
¶T #−1
∂ζi ∂x
(2.55)
The Mallows form of the modified generalized maximum likelihood estimation technique, advocated in Refs. 120–123, successfully reduces the weights of leverage points in the linear regression problem. However, this reduced weighting occurs without concern for the magnitude of the residual. Therefore, leverage points with a small residual receive the same reduced weighting as leverage points with a large residual. Generally, leverage points with small residual are termed good leverage points whereas those with large residual are termed bad leverage points. In the Mallows form, both good and bad leverage points receive the same weights, when, in fact, it is desirable that the good leverage points receive their full weight since they can be pivotal in determining the fit. The next technique avoids this problem using a different form of the modified generalized maximum likelihood estimation technique.
2.5. MODIFIED GENERALIZED MAXIMUM LIKELIHOOD ESTIMATION
2.5.2
34
Schweppe Form
The modified generalized maximum likelihood technique with leverage point identification is said to be in Schweppe form124 if the cost function is written as µ ¶ m X ζi 2 J (x) = wi ρ (2.56) wi i=1
where wi are the leverage point weights. The solution of the Schweppe modified generalized maximum likelihood technique can be found by solving for the minimum of the cost function by means of the equation µ ¶ m X ζi ∂ζi wi φ (2.57) =0 wi ∂x i=1
ρ0 (ζi ).
where φ(ζi ) = By defining the function ψ (ζi /wi ) = wi φ(ζi /wi )/ζi , and the matrix Ψ = diag [ψ (ζi /wi )], the implicit equation can be written in matrix form as H T Ψ (Hx − y) = 0 which is in the same form as Eq. (2.24) and Eq. (2.54). The influence function of a Schweppe estimator is given by109 "µ ¶µ ¶ #−1 ∂ζi ∂ζi T ∂ζi wi φ (ζi /wi ) ¤E νi (ζi ) = £ 2 0 ∂x ∂x ∂x E wi φ (ζi /wi )
(2.58)
(2.59)
The Schweppe form of the modified generalized maximum likelihood estimation technique, advocated in Refs. 41, 119, 124–126, reduces the weight of leverage points, but only those with large residuals. If the ρ function is quadratic for small residuals, as is the case with the Huber ρ function, then the φ function is linear which in turn implies that the weighting function cancels out in the numerator and denominator of Eq. (2.57). Therefore the data point in question receives the full weight irrespective of its leverage.119 This cancellation implies that Schweppe estimators only reject bad leverage points.
2.5.3
Weighting Function
In either the Mallows or Schweppe form of the modified generalized maximum likelihood technique, the weighting function for leverage point identification can be written using either the Mahalanobis distances or the projection statistics. In the case of the Mahalanobis distances, the weighting function takes the form £ ¢ ¤ ¡ wi = min 1, χ2n,α /M2i (2.60) In the case of projection statistics, the weighting function is £ ¢ ¤ ¡ wi = min 1, χ2n,α /Pi2
(2.61)
It is worth noting that very few authors working on estimation problems have considered the use of the projection statistics for leverage point identification since the introduction in Ref. 115 in 1982. The projections statistics for leverage point identification in regression problems have appeared in Refs. 115–117, 119, 126, 127.
2.6. NUMERICAL SOLUTION OF THE IMPLICIT LIKELIHOOD EQUATION
2.6
35
Numerical Solution of the Implicit Likelihood Equation
This section discusses a numerical technique of solving the implicit equation resulting from application of the generalized maximum likelihood method. Equation (2.24) can be expanded to yield ¡ ¢−1 T H T ΨHx = H T Ψy, which can be solved for x to give x = H T ΨH H Ψy. Since the matrix Ψ depends on the residuals ζi , and hence on x, an iterative solution to Eq. (2.24) is expressed as ³ ´−1 x(j+1) = H T Ψ(j) H H T Ψ(j) y
(2.62)
where the superscript (j) refers to the iteration index. The method can be initialized by using the ¡ ¢−1 T least–squares solution x(0) = H T H H y. The converged value from the iterative procedure is ˆ . This technique is known as iteratively reweighted least–squares,110 taken as the state estimate, x and is generally attributed to Beaton and Tukey.111 This iteration will converge if the ψ function is nonincreasing25 (for ζi > 0), which is the case when using the Huber ρ function in Eq. 2.25. The algorithm can be iterated until convergence or can be carried out through only one fixed iteration step, as discussed by Bickel,112 and Rousseeuw and Leroy,24 an approach that captures the robustness properties of the estimator and also saves on the computational costs associated with the iterative solution. When the measurement errors are correlated, they can be transformed to uncorrelated measurements with unit variance by means of the transformations given in Sec. 2.2. The resulting solution by means of the iteratively reweighted algorithm takes the form ³ ´−1 x(j+1) = H T R−1/2 Ψ(j) R−1/2 H H T R−1/2 Ψ(j) R−1/2 y
(2.63)
Note that as γ → ∞, the Huber filtering problem reduces to the least squares estimator. Specifically, when γ → ∞, the matrix Ψ → I, and Eq. (2.24) can be solved exactly in one iteration step and is equal to the least squares solution.
2.7 2.7.1
Examples in Linear Regression A Simple Example Without Leverage Points
This section discusses the application of the robust Huber technique to a sample problem drawn from a simple linear regression involving fitting a line through data points. The Huber technique is used to estimate the slope and intercept of the line. Fig. 2.9 shows the data points, the least squares data fit, and four iterations of the Huber estimator for γ = 1.345. In this case, the data points are shown with black circles, the least squares solution is shown with the blue line, and the first though fourth iterates of the Huber technique are shown with cyan, red, magenta, and green lines, respectively. In this problem, it is clear that the Huber technique effectively reduces the effect of the outlier, and also the convergence of the iteratively re-weighted least squares technique is clearly demonstrated. It should be noted that this example problem did not include leverage points, which is the subject of the next example problem.
2.7. EXAMPLES IN LINEAR REGRESSION
36
10 9 8 7 6
Data Points Least Squares Solution 1st Huber Iterate 2nd Huber Iterate 3rd Huber Iterate 4th Huber Iterate
y
5 4 3 2 1 0 −1 0
2
4
6
8
10
x
Figure 2.9: Data Points and Regression Results for Example Problem
Table 2.2: Linear Regression Solution Iteration Slope Intercept Least Squares 0.5455 1.3636 1st Huber Iterate 0.8420 0.4413 2nd Huber Iterate 0.9285 0.2144 3rd Huber Iterate 0.9331 0.2007 4th Huber Iterate 0.9333 0.2000
2.7.2
Example With a Single Bad Leverage Point
This section discusses a similar example problem, but now adds a single leverage point, which is simultaneously an outlier. The least squares, Huber estimator, Mallows estimator using the Mahalanobis distances for leverage point identification, Mallows estimator using the projection statistics for leverage point identification, the Schweppe estimator with both Mahalanobis distances and projection statistics for leverage point identification are implemented for this problem. The results of the estimation problem are shown in Fig. 2.10. In this case, the data points are shown with black circles, the least squares solution is shown with the blue line, the Mallows–Mahalanobis distance solution is shown with the cyan line, the Schweppe–Mahalanobis distance solution is shown with the dashed cyan line, the Mallows–Projection statistics solution is shown with the magenta line, and the Schweppe–Projection statistics solution is shown with the dashed magenta line. The slope, intercept, and iteration count is shown in Table 2.3.
2.7. EXAMPLES IN LINEAR REGRESSION
37
30 25 20
Data Points Least Squares Solution Huber Mallows−MD Schweppe−MD Mallows−PS Schweppe−PS
y
15 10 5 0 −5 0
5
10
15 x
20
25
30
Figure 2.10: Data Points and Regression Results for Example Problem With Single Bad Leverage Point
Table 2.3: Linear Regression Solution With Single Bad Leverage Point Method Slope Intercept Iterations Least Squares -0.0029 4.1096 0 Huber technique 0.7515 1.0182 28 Mallows–Mahalanobis distances 0.8005 0.8175 15 Schweppe–Mahalanobis distance 0.8398 0.6563 12 Mallows–Projection statistics 0.9262 0.3023 8 Schweppe–Projection statistics 0.9781 0.0897 6
From these results it is apparent that the Schweppe form of the modified generalized maximum likelihood technique is superior to the Mallows form, and also that the use of projection statistics is superior to that of the Mahalanobis distances for the weighting functions used in leverage point identification. Interestingly, the number of iterations required of the estimator reduces as the robustness of the estimator increases, using the same convergence tolerance on each particular case (explicitly, the change in slope and intercept are both less than 10−5 ). The next section discusses a similar problem with multiple leverage points.
2.7.3
Examples With Multiple Leverage Points
This section discusses two example problems involving multiple leverage points in the data for the linear regression problem. The first example involves data with both a good and bad leverage point,
2.7. EXAMPLES IN LINEAR REGRESSION
38
Table 2.4: Linear Regression Solution With Method Least Squares Huber technique Mallows–Mahalanobis distances Schweppe–Mahalanobis distance Mallows–Projection statistics Schweppe–Projection statistics
One Good and One Bad Leverage Point Slope Intercept Iterations 0.4275 2.4011 0 0.9563 0.1834 10 0.9563 0.1834 10 0.9563 0.1834 10 0.9705 0.1219 6 0.9908 0.0381 5
whereas the second example involves data with two bad leverage points. 2.7.3.1
Example with Good and Bad Leverage Points 30 25 20
Data Points Least Squares Solution Huber Mallows−MD Schweppe−MD Mallows−PS Schweppe−PS
y
15 10 5 0 −5 0
5
10
15 x
20
25
30
Figure 2.11: Data Points and Regression Results for Example Problem With Good and Bad Leverage Points The results of a sample problem with one good and one bad leverage point are shown in Fig. 2.11. The slope, intercept, and iteration count for this problem is shown in Table 2.4, for the same group of estimators investigated in the previous example involving one leverage point. These results illustrate that the estimators based on the Mahalanobis distances for leverage point identification falls prey to the clustered leverage points in this problem, even though one point is good and the other is bad, while the estimators based on the projection statistics can successfully handle the clustered leverage points. Clearly, the results using the Huber estimator alone without
2.7. EXAMPLES IN LINEAR REGRESSION
39
30 25 20
Data Points Least Squares Solution Huber Mallows−MD Schweppe−MD Mallows−PS Schweppe−PS
y
15 10 5 0 −5 0
5
10
15 x
20
25
30
Figure 2.12: Data Points and Regression Results for Example Problem With Two Bad Leverage Points
Table 2.5: Linear Regression Solution With Two Bad Leverage Points Method Slope Intercept Iterations Least Squares -0.0900 4.4553 0 Huber technique 0.1610 3.4811 12 Mallows–Mahalanobis distances 0.1610 3.4811 12 Schweppe–Mahalanobis distance 0.1610 3.4811 12 Mallows–Projection statistics 0.8404 0.6523 13 Schweppe–Projection statistics 0.9473 0.2153 7
any leverage point identification are identical to those using the Mahalanobis distances in both the Mallows and Schweppe form, indicated that the Mahalanobis distance–based leverage point identification method failed to successfully pick out the leverage points in this problem. This problem also illustrates that the performance of the Mallows estimator is degraded compared with that of the Schweppe estimator, since the latter can distinguish between good and bad leverage points. 2.7.3.2
Example with Two Bad Leverage Points
The results of a sample problem with two bad leverage points are shown in Fig. 2.12. The slope, intercept, and iteration count for this problem is shown in Table 2.5. These results illustrate that the estimators based on the Mahalanobis distances for leverage point identification falls prey
2.7. EXAMPLES IN LINEAR REGRESSION
40
to the clustered leverage points in this problem, whereas the estimators based on the projection statistics can successfully handle the clustered leverage points. As in the previous example, the results using the Huber estimator alone without any leverage point identification are identical to those using the Mahalanobis distances in both the Mallows and Schweppe form, indicating that the Mahalanobis distance–based leverage point identification method failed to successfully pick out the leverage points in this problem. This problem also illustrates that the performance of the Mallows estimator is degraded compared with that of the Schweppe estimator even for cases with multiple bad leverage points.
Chapter 3
Dynamic State Estimation 3.1
Introduction
This chapter discusses the problem of estimating the state of the system of ordinary differential equations x˙ = f (x, u, v, t) (3.1) where x is the state vector, u are the deterministic inputs to the system, and v are random inputs ¯ = 0 and its covariance is Q. It is assumed that the state to the system. The mean value of v is v of the system can be measured at discrete times in the form of a model given as y k = h (xk ) + wk
(3.2)
where the subscript k refers to the value of the parameter at time tk , y k is the measurement at ¯ k = 0 and its time tk , and wk is the measurement noise at time tk . The mean value of wk is w covariance is Rk .
3.2
Robust Extended Kalman Filter
The Kalman filter is a well-known technique for estimating the state of systems of differential equations described in the form provided in Eqs. (3.1–3.2). The filter is a predictor–corrector approach in which the state predictions are computed by numerical integration of the dynamic model, and state corrections are obtained by a weighted linear combination of the predicted measurements and the actual measurements. In this approach, the state and covariance predictions are given as Z tk ¯ , t) dt ¯k = x ˆ k−1 + f (x, u, v x (3.3) tk−1 tk
Z ¯k = P ˆ k−1 + P
£ ¤ ¯ (t) + P ¯ (t)T A(ˆ A(ˆ x(t), t)P x(t), t)T + B(ˆ x(t), t)Q(t)B(ˆ x(t), t)T dt(3.4)
tk−1
¯ k is the predicted value of the state at time tk , based on the estimated value of the state where x ¯ k is the predicted state error covariance matrix at time tk ˆ k−1 . Similarly, P at time tk−1 , which is x
41
3.2. ROBUST EXTENDED KALMAN FILTER
42
ˆ k−1 is the estimated state error covariance matrix and time tk−1 . Also, the matrices A and and P B are given by ¯ ∂f ¯¯ A(t) = (3.5) ∂x ¯x=x ¯ (t),v =v ¯ ¯ ∂f ¯¯ B(t) = (3.6) ∂v ¯x=x ¯ (t),v =v ¯ The discrete–time covariance propagation can also be written as ¯ k+1 = Φk P ˆ k ΦT + Q ˜k P k
(3.7)
˜ k is the process noise covariance matrix. Both of where Φk is the state transition matrix and Q these quantities can be determined jointly through the relation130, 141 µ· ¸ ¶ · ¸ · ¸ ˜k −A BQB T X 11 X 12 Q X 11 Φ−1 k exp δt = = (3.8) 0 X 22 0 AT 0 ΦTk ˜ k = Φk X 12 , where δt = tk+1 − tk . Note that these leading to the result Φk = X T22 and Q relationships and the use of the state transition matrix are approximations that are true only when the state dynamics matrix is constant. These approximations generally work well when the process is slowly varying and/or the sampling rate is sufficiently high for a particular problem. The state correction obtained at the time of the measurement update can be expressed as a linear regression problem between the predicted state and the observed quantity.128 If the true ¯ k , then value of the state is written as xk and the state prediction error is written as δ k = xk − x ¯ k = xk −δ k . By approximating the measurement equation the state prediction can be expressed as x as ¯k) (3.9) y k ≈ h (¯ xk ) + H k (xk − x the regression problem then takes the form ¾ ¾ · ¸ ½ ½ ¯k Hk wk y k − h (¯ xk ) + H k x = xk + ¯k I −δ k x where the matrix H k is defined as
¯ ∂h ¯¯ Hk = ∂x ¯x=x ¯ k ,w =w ¯
(3.10)
(3.11)
By defining the quantities ¸ Rk 0 ¯k 0 P ½ ¾ ¯k y k − h (¯ xk ) + H k x −1/2 Tk ¯k x · ¸ Hk −1/2 Tk I ½ ¾ wk −1/2 Tk −δ k · Tk = zk = Gk = ξk =
(3.12) (3.13) (3.14) (3.15)
3.2. ROBUST EXTENDED KALMAN FILTER
43
the linear regression problem is transformed to z k = Gk xk + ξk
(3.16)
Note that Eq. (3.16) is in precisely the same form as the linear regression problem given in Eq.(2.11), which can be solved using the robust Huber generalized maximum–likelihood technique. Recall from the previous section that the solution of the Huber estimation problem can be written as the converged solution of the iterative equation ³ ´−1 (j+1) xk = GTk Ψ(j) Gk GTk Ψ(j) z k (3.17) where the superscript (j) refers to the iteration index. The method can be initialized by using ¡ ¢−1 T (0) the least–squares (Kalman filter) solution xk = GTk Gk Gk z k . The converged value from the ˆk. iterative procedure is taken as the corrected state estimate following a measurement update, x Finally, the estimated state estimate error covariance matrix following the measurement update is computed from ¡ ¢ ˆ k = GT ΨGk −1 P (3.18) k using the final value of Ψ corresponding to the converged state estimate. Due to the particular structure of the matrix Gk , the discrete time dynamic state estimation technique can be simplified considerably from the static state estimation technique by application of the matrix inversion lemma.129 It is first useful to decompose the Ψ matrix into two portions Ψx and Ψy corresponding to the state prediction and measurement prediction residuals so that · ¸ Ψy 0 (3.19) Ψ= 0 Ψx The state update equation can be rewritten as ³ T ´−1 ¢−1 T ¡ e G ek e kz ek ˆ k = GTk ΨGk x Gk Ψz k = G G k e k = Ψ1/2 Gk and z ek = Ψ1/2 z k . It follows from Eq. 3.14 that where G · ¸ H −1/2 k 1/2 ek = Ψ T G k I " #" #· ¸ −1/2 1/2 Rk 0 Ψy 0 Hk = 1/2 ¯ −1/2 I 0 Ψx 0 P k # " 1/2 −1/2 Ψy R k H k = 1/2 ¯ −1/2 Ψx P
(3.20)
(3.21)
k
Then, eTG e G k k
# ¸ " 1/2 −1/2 ³ ´T ³ ´T Ψ R H y k −1/2 −1/2 1/2 1/2 k ¯ = H Tk Rk Ψy P Ψx 1/2 ¯ −1/2 k Ψx P k ³ ´ ³ ´T −1/2 −1/2 −1/2 T −1/2 T ¯ ¯ = H k Rk Ψy R k H k + P Ψx P k k ·
−1 e e −1 H k + P ¯ = H Tk R k k
(3.22)
3.2. ROBUST EXTENDED KALMAN FILTER
44
³ ´T ³ ´T e e k = R1/2 Ψ−1 R1/2 ¯k = P ¯ 1/2 Ψ−1 P ¯ 1/2 . Since P ˆ −1 = G eTG e where R and P y x k k k , then the k k k k covariance expansion reduces to µ ¶ −1 −1 −1 T e ˆk = H R e ¯ P (3.23) k k Hk + P k Making use of the matrix inversion lemma, Eq. (3.23) can be reduced to∗ ³ ´−1 e e e e ˆk = P ¯k −P ¯ kHT HkP ¯ kHT + R ek ¯k P HkP k k · ¸ ³ ´−1 T T e e e ¯ ¯ e ¯k = I − P k H k H k P k H k + Rk Hk P e ¯k = [I − K k H k ] P ³ ´−1 e e ¯ kHT + R ek ¯ kHT HkP where K k = P is the reweighted Kalman gain matrix. k k Next, the state update equation can be manipulated to form ³ T ´−1 e G e e kz ek ˆk = x G G k k · ³ −1/2 ´T µ −1/2 ¶T ¸ e T e ¯ ¯ e = [I − K k H k ] P k H k R P k k ½ ¾ e −1/2 R 0 ¯k y k − h (¯ xk ) + H k x k × −1/2 ¯k e x ¯ 0 P k ¾ ½ −1 −1 T e e e [y k − h (¯ ¯ x ¯k H R ¯k] + P ¯k = [I − K k H k ] P xk ) + H k x k
k
(3.24)
k
e ¯ kHT R e −1 ¯ k ] + [I − K k H k ] x ¯k = [I − K k H k ] P xk ) + H k x k k [y k − h (¯
(3.25)
e ¯ kHT R e −1 The term [I − K k H k ] P k k can be further simplified as e e e ¯ kHT R e −1 = P ¯ kHT R e −1 − K k H k P ¯ kHT R e −1 [I − K k H k ] P k k ³k k ´ −1k k e e ¯ kHT + R ek R e − KkHkP ¯ kHT R e −1 = Kk HkP k k k k h³ ´ −1 i e e ¯ kHT + R ek R e − HkP ¯ kHT R e −1 = Kk HkP k k k k h i −1 −1 e e ¯ kHT R e + I − HkP ¯ kHT R e = Kk HkP k k k k = Kk
(3.26)
Substituting this result into Eq. (3.25) yields ˆ k = K k [y k − h (¯ ¯ k ] + [I − K k H k ] x ¯k x xk ) + H k x ¯k + x ¯k − KkHkx ¯k = K k [y k − h (¯ xk )] + K k H k x ¯ k + K k [y k − h (¯ = x xk )]
(3.27)
Recall that the¢ matrix inversion lemma provides the relation (A + BCD)−1 = A−1 − ¡ −1 −1 −1 −1 A B DA B + C DA where A and C are invertible and all matrices have suitable dimensions. −1 e ¯ k , B = H Tk , C = R e −1 To apply the lemma to Eq. (3.23), let A = P k , and D = H k . ∗
−1
3.3. ROBUST DIVIDED DIFFERENCE FILTERING
45
³ ´T ³ ´T e e k = R1/2 Ψ−1 R1/2 ¯k = P ¯ 1/2 Ψ−1 P ¯ 1/2 Substituting the definitions R and P back into y x k k k k equations for the state and covariance updates results in the iteratively reweighted Kalman filter algorithm given by (j+1)
ˆk x
where
(j)
(3.28)
ˆ k = (I − K k H k ) P ¯ 1/2 Ψ−1 P ¯ 1/2 P x k k
(3.29)
¯ k + K k [y k − h (¯ = x xk )]
³ ´−1 ¯ 1/2 H T H k P ¯ 1/2 H T + R1/2 Ψ−1 R1/2 ¯ 1/2 Ψ−1 P ¯ 1/2 Ψ−1 P Kk = P y x x k k k k k k k k
(3.30)
Note that as the tuning parameter γ → ∞, the matrix Ψ → I and the Huber recursive estimation technique reduces to the familiar Kalman filter solution.
3.3
Robust Divided Difference Filtering
The Divided Difference Filter is one of several new estimation techniques that are collectively known as Sigma–Point Kalman Filters (SPKF). Like the basic Kalman filter, the SPKFs seek to determine a state estimate that minimizes the `2 –norm of the residuals. The SPKF technique differs from the basic Kalman filter in that the estimate and covariance propagation prior to determining the state estimate at the time of the measurement update. The divided difference filter arises from an alternate approach to the nonlinear state estimation and filtering problem than the EKF. Whereas the EKF is based on first–order Taylor series approximations, the divided difference filter relies on multidimensional interpolation formulas to approximate the nonlinear transformations. As a result of this approach, the filter does not require knowledge or existence of the partial derivatives of the system dynamics and measurement equations. The First–Order (DD1) and Second–Order (DD2) Divided Difference Filters79, 80 are generalizations of the filter introduced by Schei,81 and are two examples of SPKF–class estimators; other examples can be found in Refs. 82–84. This section describes the DD1 and DD2 filters and shows how the measurement update equation can be modified to provide robustness against deviations from the assumed Gaussian error model by use of the Huber technique. The filter summary closely follows that given in Refs. 79 and 80. The filter equations rely upon a discrete representation of the system dynamics, in which the differential equation in Eq. (3.1) is replaced with a difference equation of the form (3.31) xk+1 = F (xk , v k , tk ) and the measurement equation is given by y k = G (xk , wk , tk )
(3.32)
where y k is the measurement at time tk , and wk is the measurement noise at time tk . As in Sec. 3.2, ¯ k = 0 and its covariance is the matrix Rk . the mean value of wk is w ¯ k , corrected state The following square-root decompositions of the predicted state covariance, P ˆ k , process noise covariance, Qk , and measurement noise covariance, Rk , are defined covariance, P as ˆT ˆk = S ˆx S P xk k
(3.33)
3.3. ROBUST DIVIDED DIFFERENCE FILTERING
46
¯k = S ¯x S ¯T P xk k
(3.34)
S vk S Tvk S wk S Twk
(3.35)
Qk = Rk =
(3.36)
¯xk is referred to as s ¯xkj ; likewise for the other matrices. Also, the jth column of s
3.3.1
Overview of the DD1 Filter
The DD1 filter makes use of first–order divided differences to approximate the system and measurement dynamics rather than the first–order Taylor series expansions used in the EKF. The following matrices of first–order divided differences are defined as S 0xˆxk
=
S 0xvk
=
S 0y¯xk
=
S 0ywk
=
i,j
i,j
i,j
i,j
¢ ¡ ¢¤ 1 £ ¡ ˆ + cˆ ¯ k , tk − F i x ˆ k − cˆ ¯ k , tk Fi x sxj , v sxj , v 2c ¢ ¡ ¢¤ 1 £ ¡ ˆk, v ¯ k + csvj , tk − F i x ˆk, v ¯ k − csvj , tk Fi x 2c ¢¤ ¡ ¢ 1 £ ¡ ¯ k , tk ¯ k − c¯ ¯ k , t k − Gi x ¯ k + c¯ sxj , w sxj , w Gi x 2c ¢¤ ¡ ¢ 1 £ ¡ ¯k, w ¯ k − cswj , tk ¯k, w ¯ k + cswj , tk − Gi x Gi x 2c
(3.37) (3.38) (3.39) (3.40)
where c the divided–difference perturbing parameter. The state, state root–covariance, measurement, and measurement root-covariance predictions are given by ¯ k+1 = F (ˆ ¯ k , tk ) x xk , v ¡£ 0 ¤¢ ¯x = H S S xˆxk S 0xvk k+1
(3.41)
¯ k = G (¯ ¯ k , tk ) y xk , w ¡£ 0 ¤¢ S yk = H S y¯xk S 0ywk
(3.43)
(3.42) (3.44)
where H(·) represents a Householder transformation of the argument matrix.79, 80 The state and root-covariance measurement update equations are given by ˆk = x ¯ k + K k (y k − y ¯k) x ¡£ ˆx = H ¯ x − KkS0 S S yxk k k
K k S 0ywk
¤¢
(3.45) (3.46)
¡ ¢ ¯ x S 0T S y S T −1 is the Kalman gain matrix. where K k = S y¯ xk yk k k The form of the state root-covariance update can be derived by first defining P yk = S yk S Tyk = 0T 0T 0 0 ¯ S y¯xk S 0T ¯yk = S xk S y¯ xk . Then, it is clear that the gain matrix can be written y¯ xk + S ywk S ywk , and P x −1 ˆk = as K k = P x¯yk P yk . The state error covariance matrix update can be computed from P T ¯ P k − K k P yk K k , but in the DD1 implementation it is desirable to update the root-covariance matrix directly. By noting the identities, K k P yk K Tk
T 0T T ¯ = P x¯yk P −1 yk P yk K k = S xk S yxk K k
= =
T 0 ¯T K k P −1 yk P yk P x ¯yk = K k S yxk S xk T K k S yk S Tyk K Tk = K k S 0y¯xk S 0T y¯ xk K k
(3.47) (3.48) T + K k S 0ywk S 0T ywk K k
(3.49)
3.3. ROBUST DIVIDED DIFFERENCE FILTERING
47
the state covariance update can be manipulated to form ˆk = P ¯ k − KkP y KT − KkP y KT + KkP y KT P k k k T T 0T T 0 T 0 0T T ¯ ¯ ¯ ¯ = S xk S xk − S xk S yxk K k − K k S yxk S xk + K k S 0y¯xk S 0T y¯ xk K k + K k S ywk S ywk K k ¢T ¡ ¢¡ ¢T ¡ ¢¡ ¯ x − KkS0 ¯ x − KkS0 S + K k S 0ywk K k S 0ywk = S (3.50) yxk yxk k k ˆ T , where S ˆ x takes ˆ k can clearly be factored into P ˆk = S ˆx S Then, the state covariance matrix P xk k k the form given in Eq. (3.46).
3.3.2
Overview of the DD2 Filter
The DD2 filter makes use of second–order divided differences to approximate nonlinear transformation of the state and covariance. The matrices of second–order divided differences are defined as √ ¢ ¢ ¡ c2 − 1 £ ¡ 00 ¯ k , tk ˆ k − cˆ ¯ k , tk + F i x ˆ k + cˆ sxj , v = S xˆxk sxj , v Fi x 2 i,j 2c ¯ k , tk )] −2F i (ˆ xk , v (3.51) √ 2 ¢ ¡ ¢ c −1£ ¡ ˆk, v ¯ k − cswj , tk ˆk, v ¯ k + cswj , tk + F i x S 00xvk = Fi x 2 i,j 2c ¯ k , tk )] −2F i (ˆ xk , v (3.52) √ 2 ¢ ¡ ¢ c −1£ ¡ ¯ − c¯ ¯ k , tk ¯ + c¯ ¯ k , tk + Gi x sxj , w sxj , w Gi x S 00y¯xk = 2 i,j 2c ¯ k , tk )] −2Gi (¯ xk , w (3.53) √ 2 ¡ ¢ ¢ c −1£ ¡ ¯kw ¯ k − cswj , tk ¯k, w ¯ k + cswj , tk + Gi x Gi x S 00ywk = 2 i,j 2c ¯ k , tk )] −2Gi (¯ xk , w (3.54) The state, state root–covariance, measurement, and measurement covariance predictions are given by µ 2 ¶ c − nx − nv ¯ k+1 = ¯ k , tk ) x F (ˆ xk , v c2 nx h ³ ´ ³ ´i 1 X ˆ k + cˆ ¯ k , tk + F x ¯ k , tk ˆ k − cˆ + 2 F x sxkj , v sxkj , v 2c j=1
¯x S k+1 ¯k y
nv h ³ ´i ´ ³ 1 X ˆk, v ¯ k − csvkj , tk ˆk, v ¯ k + csvkj , tk + F x F x + 2 2c j=1 ¤¢ ¡£ 0 = H S xˆxk S 0xvk S 00xˆxk S 00xvk µ 2 ¶ c − nx − nw ¯ k , tk ) = G (¯ xk , w c2 nx h ³ ´i ´ ³ 1 X ¯ k , tk ¯ k , tk + G x ¯ k − c¯ ¯ k + c¯ sxkj , w + 2 G x sxkj , w 2c j=1
(3.55) (3.56)
3.3. ROBUST DIVIDED DIFFERENCE FILTERING
S yk
48
nw h ³ ´ ³ ´i 1 X ¯k, w ¯ k + cswkj , tk + G x ¯k, w ¯ k − cswkj , tk + 2 G x 2c j=1 ¡£ 0 ¤¢ = H S y¯xk S 0ywk S 00y¯xk S 00ywk
(3.57) (3.58)
where nx is the size of the state dimension, nv is the size of the process noise dimension, and nw is the size of the measurement noise dimension. Lastly, the state and root-covariance update equations are given by ˆk = x ¯ k + K k (y k − y ¯k) x ¡£ ˆx = H ¯ x − KkS0 S S yxk k k
K k S 0ywk
K k S 0yxk
K k S 0ywk
¤¢
(3.59) (3.60)
¡ ¢ ¯ x S 0T S y S T −1 is the Kalman gain matrix. where K k = S y¯ xk yk k k Note that many of the same state and noise perturbations used to calculate the first–order divided differences are again used to compute the second–order divided differences. This point has important implications with regard to the computational costs, suggesting that the DD2 filter may not require a great deal more computing time than the DD1 filter.
3.3.3
Modification of Measurement Update Equations Using Huber’s Technique
This section discusses how the measurement update equations of the DD1 and DD2 filters can be solved using the Huber method. To apply this method, it is first required to recast the measurement update as a regression problem between the observed quantity and the state prediction. Following ¯ k , then the state prediction can Sec. 3.2, the state prediction error can be written as δ k = xk − x ¡ ¢T ¯ x S0 ¯ k = xk − δ k . By defining the cross–covariance matrix79 P xyk = S be expressed as x and y¯ xk k ³ ´−1 −1 T 0 ¯ ¯ the matrix H k = P Txyk P , then the measurement update can then be written in k = S y¯ xk S xk the form of a linear regression problem in same manner as shown in Sec. 3.2.134 If the measurement update given in Eq. (3.45) is taken as the initial guess for the state estimate, then a one-step Huber update can be written as ³h i´ −1/2 −1/2 = H S (1) (3.61) S 0y¯xk Ψx S 0ywk Ψy yk ³ ´ −1 (1) ¯ x Ψ−1 S 0T S (1) S (1)T Kk = S (3.62) x y¯ xk yk yk k (1)
ˆk = x ¯ k + K k (y k − y ¯k) x i´ ³h −1/2 −1/2 (1) 0 −1/2 (1) 0 ˆx = H ¯ S Ψ Ψ K S S Ψ − K S y x x x k ywk yxk k k k
(3.63) (3.64)
The form of the robust DD1 measurement update given in Eqs. (3.61–3.64) can be found from following a similar procedure for the non-robust case. In the Huber case, note that P yk = −1 T 0T S yk S Tyk = S 0y¯xk Ψ−1 xk + S ywk Ψy S ywk . It then follows that P yk can be factored to give the x S y¯ result in Eq. (3.61). The identities given in Eqs. (3.47–3.49) can be rewritten as K k P yk K Tk
T −1 0T T ¯ = P x¯yk P −1 yk P yk K k = S xk Ψx S yxk K k
= =
T 0 −1 ¯ T K k P −1 yk P yk P x ¯yk = K k S yxk Ψx S xk 0T T K k S yk S Tyk K Tk = K k S 0y¯xk Ψ−1 x S y¯ xk K k
(3.65) (3.66) 0T T + K k S 0ywk Ψ−1 y S ywk K k
(3.67)
3.4. ADAPTIVE FILTERING FOR UNKNOWN NOISE STATISTICS
49
Using these results, the state covariance update equation can be found by manipulating the equation ˆk = P ¯ k − KkP y KT − KkP y KT + KkP y KT P k k k −1 0T T 0 −1 ¯ T ¯ ¯ ¯T = S x Ψ S − S x Ψ S K − K k S Ψ−1 S k
x
xk
k
x
yxk
k
yxk
x
xk
0T T 0 −1 0T T +K k S 0y¯xk Ψ−1 x S y¯ xk K k + K k S ywk Ψy S ywk K k ³ ´³ ´T ¯ x Ψ−1/2 − K k S 0 Ψ−1/2 S ¯ x Ψ−1/2 − K k S 0 Ψ−1/2 = S x yxk x x yxk x k k ´T ´³ ³ + K k S 0ywk Ψy−1/2 K k S 0ywk Ψ−1/2 y i´ ³h −1/2 −1/2 −1/2 0 0 ¯ = H S xk Ψx − K k S yxk Ψx K k S ywk Ψy
(3.68) (3.69)
Similarly for the DD2 filter, if the measurement update given in Eq. (3.59) is taken as the initial guess for the state estimate, then a one-step Huber update can be written as ³h i´ −1/2 −1/2 −1/2 −1/2 0 0 00 00 S (1) = H (3.70) S y¯xk Ψx S ywk Ψy S y¯xk Ψx S ywk Ψy yk ´−1 ³ (1) ¯ x Ψ−1 S 0T S (1) S (1)T Kk = S (3.71) x y¯ xk yk yk k (1)
ˆk = x ¯ k + K k (y k − y ¯k) x ³h −1/2 (1) −1/2 (1) −1/2 ˆx = H ¯ x Ψx S S − K k S 0yxk Ψx K k S 0ywk Ψy k k i´ −1/2 −1/2 (1) 00 (1) 00 K k S ywk Ψy K k S yxk Ψx
(3.72)
(3.73)
In each case, Ψx and Ψy are diagonal matrices computed from the Huber ψ function, with residuals that take the form # y −y " ¯k k −1 S wk 0 · (3.74) ζ= ¯ −1 0 S (0) x xk ˆk − x ¯k where the superscript (0) refers to the initial state estimate computed from the standard DD1 or DD2 update.
3.4
Adaptive Filtering For Unknown Noise Statistics
Although the Huber technique has been shown to be beneficial in the presence of contaminated Gaussian probability distributions, the approach can still be improved upon by including a method by which the covariance of the main Gaussian distribution can be estimated along with the state and state error covariance matrix. A technique such as this allows the filter to adaptively tune the gain matrix to suite either slow changes in the error statistics, or statistics that are not well known. For example, a rendezvous radar used in a Mars sample return mission is very likely not to behave in the same manner as tested on the Earth, prior to launch, cruise, entry and descent to the Mars surface, and then a launch from the surface of Mars back to an Earth–return vehicle.
3.4. ADAPTIVE FILTERING FOR UNKNOWN NOISE STATISTICS
3.4.1
50
Myers–Tapley Method
An intuitive approach to adaptive state estimation is proposed by Myers and Tapley.66 In this approach, the measurement residual sequence is mined to produce estimates of the measurement noise statistics, and state prediction residuals are mined to compute estimates of the process noise statistics. The estimators make use of a sliding window of N stored measurement noise and process noise residuals to compute the noise statistics. In batch form, the estimator for the measurement noise covariance can be derived by first defining the empirical covariance matrix N
¢¡ ¢T 1 X¡ Cζ = ζ j − ζ¯ ζ j − ζ¯ N −1
(3.75)
j=1
where ζ j is the jth stored measurement residual, and ζ¯ is the sample mean of the residuals, N 1 X ζ¯ = ζj N
(3.76)
j=1
The expected value of C ζ is66 E [C ζ ] = R +
N 1 X ¯ jHT HjP j N
(3.77)
j=1
By substituting Eq. (3.75) into Eq. (3.77), an estimate for the measurement noise covariance matrix is ¸ ¶ µ N · ¢¡ ¢T 1 X ¡ N −1 T ¯ ¯ ¯ ˆ R= ζj − ζ ζj − ζ − HjP jHj (3.78) N −1 N j=1
In order to form estimates for the process noise statistics, the process noise sample is defined ˆj − x ¯ j . Then, the empirical covariance matrix for λ is as λj = x Cλ =
N ¢¡ ¢ 1 X¡ ¯ λj − λ ¯ T λj − λ N −1
(3.79)
j=1
where
N X ¯= 1 λj λ N
(3.80)
j=1
˜k −P ˆ k , where P ¯ ? is the propagated ¯k = P ¯? +Q The expected value of C λ is67 E [C λ ] = K k H k P k k ˆ k−1 ΦT where Φk−1 is ¯ ? = Φk−1 P covariance without the process noise component, given by P k k−1 the state transition matrix computed from Eq. (3.8). By manipulating Eq. (3.7), an estimator for the process noise covariance matrix is ˆ = Q
¸ µ ¶ N · ¢¡ ¢T 1 X ¡ N −1 ³¯? ˆ ´ ¯ ¯ λj − λ λj − λ − Pj − Pj N −1 N j=1
(3.81)
3.4. ADAPTIVE FILTERING FOR UNKNOWN NOISE STATISTICS
51
An adaptive filter can function by using some initial guess of the measurement noise and process noise matrices, storing the residuals for the first N frames, and then updating the covariance estimates based on Eqs.(3.78) and (3.81) at each subsequent frame. It is important to note that the Myers–Tapley method for adaptively estimating the measurement noise and process noise covariance matrices make use of the sample mean and covariance of the stored residuals, which are non–robust estimators. This lack of robustness implies that the performance Myers–Tapley adaptive method can degrade in the presence of non–Gaussianity. Therefore it is of interest to develop a modification of the Myers–Tapley approach that is robust with respect to non–Gaussian distributions, which is the subject of the following section.
3.4.2 3.4.2.1
Modified Myers–Tapley Method Robust Covariance Estimation
This section discusses a robust modification of the Myers–Tapley adaptive filter in order to protect against the possible presence of non–Gaussian distributions in the measurement and/or process noise. The main issue with the Myers–Tapley method is the use of the sample covariance and the sample mean in forming the noise covariance estimates from the stored residuals. Fortunately, the technique can be modified to use a robust form of the covariance estimate in computing the measurement and process noise statistics. The proposed technique makes use of the leverage point identification methods introduced in Sec. 2.4. The Myers–Tapley adaptive tuning method can be modified in order to account for non– Gaussianity by means of using the robust covariance estimates based on the Mahalanobis distances or the projection statistics of the stored residuals. In particular, the measurement and process noise covariance estimates can be written as # #−1 " N "N X¡ X ¢T ¢¡ ? ˆ wζ ζ − ζ¯ wζ ζ − ζ¯ · R = wζ − 1 i
i
i
r
i
i
r
i=1
i=1
· ´ ³ ´ ¸ median ³ 1/2 1/2 T −1 ¯ ¯ − HjP j Ψx H j P j j∈N # "N #−1 " N X¡ X ¢¡ ¢T ¯r ¯ r wλ λi − λ ˆ = · wλi λi − λ Q wλi − 1 i i=1
(3.82)
i=1
median ³ ¯ ? ˆ ´ − Pk − Pj j∈N
(3.83)
where wζi and wλi are the weights based on the Mahalanobis distances or projection statistics of the measurement and process noise residuals, respectively, and " ζ¯ r = " ¯r = λ
N X i=1 N X i=1
#−1 " N # X wζi · wζi ζi
(3.84)
i=1
#−1 " N # X wλi · wλi λi i=1
(3.85)
3.4. ADAPTIVE FILTERING FOR UNKNOWN NOISE STATISTICS
where wi are weights computed from the statistics by means of £ ¡ ¢ ¤ wi = min 1, χ2n,α /M2i or wi = min
£
1,
¡ 2 ¢ ¤ χn,α /Pi2
for some specified probability α. ˆ ? is related to the measurement noise covariance estimate as The matrix R ³ 1/2 ´T ˆ ˆ? = R ˆ 1/2 Ψ¯y −1 R R
52
(3.86)
(3.87)
(3.88)
−1
where Ψ¯y is the median value of the Ψy matrix across the buffer of stored observations and residuals. The estimate of the measurement noise covariance matrix can be determined from a square root decomposition of Eq. (3.82). Specifically, ³ ? ´1/2 ³ ? ´1/2 ˆ = R ˆ ˆ ¯y R R Ψ
T
(3.89)
³ ´ ³ ´T ¯ 1/2 Ψ−1 H j P ¯ 1/2 Note that in the DD1 and DD2 filter formulation, the quantity H j P x j i´j ³h −1/2 −1/2 −1 0 0 T 00 0 (DD2) for the mea(DD1) and H is replaced by S y¯xk Ψx S y¯xk S y¯xk Ψx S y¯xk Ψx ? ¯ = Φk−1 P ˆ k−1 ΦT is replaced by surement noise covariance ¡£ estimation. Similarly, the quantity P k k−1 ¤¢ 0 0 0 00 T (DD2) for the process noise covariance estimation. S xˆxk S xˆxk (DD1) and H S xˆxk S xˆxk In summary, the proposed modified Myers–Tapley method makes use of a robust technique for outlier identification and weighting based on the projection statistics in forming the estimates of the measurement and process noise covariance matrices. 3.4.2.2
Estimation of the Contamination Parameter
The modified Myers–Tapley approach discussed in the previous section can also offer a crude scheme for estimating the contamination parameter ² by using the weighting parameters relating to the stored residual data. In particular, a crude estimate of the contamination parameter is ²ˆk = 1 −
N 1 X wζi N
(3.90)
i=1
At each frame where the measurement and process noise covariances are computed, the contamination parameter can be estimated directly from the weighting parameters. Then, the optimal tuning parameter γ ? can be calculated from Eq. (2.38), which is then used within the Huber filter at each measurement update. Note, however, that it should be expected that the estimated contamination parameter will in general be biased as in cases of large contamination there will be some portion of errors drawn from the contaminating distribution that appear to be drawn from the nominal distribution, in other words false–negatives or the so-called Type II errors in detection theory. Likewise in cases of small contamination there will be some nonzero quantity of data that appear as outliers when they are in fact perfectly valid, in other words the Type I error in detection theory.
3.4. ADAPTIVE FILTERING FOR UNKNOWN NOISE STATISTICS
53
The bias of the contamination parameter is not necessarily problematic, so long as upper and lower bounds are set on the value of the tuning parameter γ used in the Huber measurement update. Clearly, the Huber technique is by nature a sub-optimal filter, since the purpose is to find a filter that is consistent across a range of distributions but not necessarily optimal at any one in particular. Therefore one could expect the performance of the technique to improve by having good estimates of the contamination parameter, but so long as the tuning parameter is bounded by some reasonable value then the robustness properties of the estimator will not be compromised by such a bias. 3.4.2.3
Fading Memory Filter
In the course of computing the estimates of the measurement and process noise covariance matrices, as well as the contamination parameter estimates, it is useful to introduction a “forgetting” factor, kf , in order to smooth the estimate histories. The filter can be implemented as ˜ k = kf R ˜ k−1 + (1 − kf ) R ˆk R ˜ k = kf Q ˜ k−1 + (1 − kf ) Q ˆk Q
(3.91)
²˜k = kf ²˜k−1 + (1 − kf ) ²ˆk
(3.93)
(3.92)
In this approach, the estimates based on the current set of stored residuals is averaged with the previous estimate, with kf as a weighting parameter. In general the recommended value of kf £ ¤ depends on the particular application, but a reasonable range is kf ∈ 1/2 1 .
Chapter 4
Spacecraft Rendezvous Guidance, Navigation, and Control 4.1
Introduction and Overview
This section describes the development of the 6 degree of freedom (6-DOF) nonlinear equations of motion for a maneuvering spacecraft with respect to an elliptical reference orbit. Coordinate systems are defined, which are then used to develop the equations of motion based on Newton–Euler mechanics. These equations of motion are used to develop nonlinear control methodologies based on feedback linearization techniques. Sensor models suitable for rendezvous navigation processing are also introduced in this chapter.
4.2
Coordinate Systems
The development of the 6–DOF rendezvous equations of motion requires the definition of several coordinate systems. First, a planet–centered inertial frame, I, is introduced. This frame is aligned with the target spacecraft orbit (assuming no perturbations) such that the x-axis is oriented towards the periapsis, the z-axis is oriented along the positive orbit normal, and the y-axis completes a right-handed system. The local, or L, frame has its origin located at the position of the target spacecraft and is defined such that the z-axis is oriented toward the center of the planet, the y-axis is oriented along the negative orbit normal, and the x-axis is in the transverse direction, completing the right-handed system. The I and L frames are illustrated in Fig. 4.1. The chaser body frame is denoted by B with right-handed axes. It is assumed that the various sensors carried onboard the chaser spacecraft produce outputs referenced to this body frame. These sensors are introduced in later sections in this chapter, following the development of the equations of motion.
54
4.3. ROTATIONAL DYNAMICS
55
zI
yI xI
θ0
r0 zL Elliptical Orbit
Target Periapsis
xL θ
yL
ρ
φ Chaser
Figure 4.1: Illustration of I and L Coordinate Frames
4.3 4.3.1
Rotational Dynamics Attitude Representations and Kinematics
There are many different attitude representations available in the literature to use for modeling spacecraft attitude and relative orientation, too numerous to review here in detail. Two attitude representations in particular are discussed in this chapter for application to the spacecraft rendezvous navigation problem. First, the quaternion representation is discussed, followed by the modified Rodrigues parameters. 4.3.1.1
Quaternions
The attitude dynamics of spacecraft is well understood and can be represented in many forms. Perhaps the most attractive form for attitude estimation is the quaternion representation, which is the smallest non-singular attitude parameterization. The quaternion can be expressed in terms of the Euler axis, e, and the Euler angle, θ, of the transformation between a reference frame fixed in the body and the inertial frame. The quaternion elements are defined as q1 = e1 sin (θ/2) , q2 = e2 sin (θ/2) , q3 = e3 sin (θ/2) , q4 = cos (θ/2). With knowledge of the quaternion elements, the
4.3. ROTATIONAL DYNAMICS
56
transformation matrix T relating the body ¡ ¢ 1 − 2 q12 + q32 T = 2 (q1 q2 − q3 q4 ) 2 (q1 q3 + q2 q4 )
frame to the inertial frame can be expressed as 2 (q1 q2 + q3 q4 ) 2 (q1 q3 − q2 q4 ) ¡ 2 ¢ 2 (q1 q4 + q2 q3 ) 1 − 2 q1 + q32 ¢ ¡ 2 (q2 q3 − q1 q4 ) 1 − 2 q12 + q22
(4.1)
By defining q = [ q1 q2 q3 q4 ]T it can be seen that the quaternion representation must satisfy the constraint equation q T q = 1. Quaternions obey the multiplication rules ¡ ¢ q 0 ⊗ q = Υ q 0 q = Ξ (q) q 0 (4.2) where
q4 −q3 q2 q40 q30 −q20 q10 0 0 0 ¡ 0 ¢ −q30 q3 q4 −q3 q4 q1 q2 Ξ (q) = Υ q = 0 0 , −q2 q 0 −q 0 q1 q4 q q 2 1 4 3 0 0 0 0 −q1 −q2 −q3 −q1 −q2 −q3 q4 £ ¤T and the inversion rule q −1 = −q1 −q2 −q3 q4 . The quaternion kinematic equations can be written as92
where
q1 q2 q3 q4
(4.3)
1 q˙ = Ω (ω) q 2
(4.4)
0 −ω1 −ω2 −ω3 ω1 0 −ω3 ω2 Ω (ω) = ω2 ω3 0 −ω1 ω3 −ω2 ω1 0
(4.5)
and ω is the angular velocity of the body frame with respect to the inertial frame. Quaternions have the special property of bilinear kinematics. If high-rate measurements of the spacecraft angular velocity are available, from a gyroscope system for instance, then the angular velocity can reasonably be assumed to be constant over the sampling interval. In this case, the quaternion kinematic equations become constant coefficient ordinary differential equations and so the solution can be determined from the matrix exponential. Explicitly, the solution for the predicted quaternion at time k + 1 can be written as140 ¸ · sin (ˆ ωk ∆t/2) ˆ k) q ˆk ¯ k+1 = I cos (ˆ Ω (ω (4.6) q ωk ∆t) + ω ˆk ˆ k is the estimated quaternion at time k, q ¯ k+1 is the predicted quaternion at time k + 1, where q ˆ k k is the assumed constant angular velocity between time k and k + 1. and ω ˆ k = kω The filtering of the attitude quaternion is complicated by the unit norm constraint. One standard approach for handling the constraint is to use a multiplicative method for the measurement update. In this approach, the attitude quaternion is replaced by an error quaternion, δq, which allows for the processing of the error quaternion as a three component vector of small angles, denoted by δα. In this approach, the quaternion estimate is propagated to the star tracker measurement at time k by means of Eq. (4.6). Then an error quaternion relating the star tracker measurement quaternion to the predicted quaternion based on propagation from the previous measurement is
4.3. ROTATIONAL DYNAMICS
57
¯ −1 ¯ k ) = q mk ⊗ q defined as δ¯ q k (δ α k . The first three components of this error quaternion are processed as independent small angles with measurement sensitivity matrix H = [ I 0 ]. The small angle error and gyroscope bias estimate error dynamics are given by ˙ = −ω ˆ × δα − δβ + η ω δα δ β˙ = η β where
0 −ω3 ω2 ˆ × = ω3 ω 0 −ω1 −ω2 ω1 0
(4.7) (4.8)
(4.9)
By setting x = [ δα δβ ]T , then these differential equations are in an appropriate form for filter implementation. The quaternion and gyroscope bias estimates following the measurement ˆ =β ¯ + δβ ˆ . ˆ k = δq (δ α ˆ k) ⊗ q ¯ k and β update are given by q k k k 4.3.1.2
Modified Rodrigues Parameters
The MRPs are defined in terms of the quaternions (q1 , q2 , q3 , q4 ) as92, 94, 145–147 µ ¶ q θ σ= = e tan 1 + q4 4
(4.10)
where q = (q1 , q2 , q3 ) is the vector part of the quaternion, q4 is the scalar part of the quaternion, e is the principal rotation axis, and θ is the principal rotation angle. The shadow MRP set is defined as92, 94 µ ¶ θ − 2π σ S σ = − T = e tan (4.11) σ σ 4 Note that the MRP set σ behaves nearly linearly (with respect to θ) near the zero rotation and grows infinitely large after a revolution, while the shadow MRP set σ S behaves linearly about 2π and is singular about the zero rotation. Further, while kσk < 1 (or > 1), σ describes the short (or long) rotation back to the origin, the shadow set σ S describes the opposite rotation. The MRP and shadow MRP set can also be described as the inner and outer MRPs,148 respectively, where inner refers to the MRP set within the unit sphere (kσk < 1) and outer refers to the MRP set outside the unit sphere (kσk > 1). Both inner and outer sets lie on the unit sphere when kσk = 1. As proposed in Ref. 94, the shadow MRP set can be exploited to yield a globally non–singular attitude description with a minimal three–parameter coordinate set at the expense of a discontinuity. To avoid the singularity, the MRP set is switched to the shadow set before reaching the singularity. A convenient switching condition is the unit magnitude surface kσk = 1, such that the composite MRP description always satisfies kσ(t)k ≤ 1. This surface represents all possible orientations where the body has performed a principal rotation relative to the origin of θ = π. Note that on this surface there are two possible MRP sets that describe the same attitude. The coordinate transformation matrix involving the MRPs can be expressed as92 ¡ ¢ ¡ × ¢2 4 1 − σT σ × 8 T =I− σ + σ (4.12) 2 2 (1 + σ T σ) (1 + σ T σ)
4.3. ROTATIONAL DYNAMICS
58
qi
Euler Parameter Unit Constraint Sphere
q σ Projection Point
θ/2
q4 +1
−1
−q Modified Rodrigues Parameter Hyperplane
σS
Figure 4.2: MRP Illustration as the Result of a Stereographic Projection where σ × is the skew-symmetric cross product matrix. MRPs have additive and subtractive composition rules, ¢ ¡ ¢ ¡ 1 − σ T0 σ 0 δσ + 1 − δσ T δσ σ 0 − 2δσ × σ 0 ¢ ¡ σ = δσ ⊕ σ 0 = (4.13) 1 + σ T0 σ 0 (δσ T δσ) − 2σ T0 δσ ¢ ¡ ¢ ¡ 1 − σ T0 σ 0 σ − 1 − σ T σ σ 0 + 2σ × σ 0 ¢ ¡ δσ = σ ª σ 0 = (4.14) 1 + σ T0 σ 0 (σ T σ) − 2σ T0 σ (4.15) Both sets of MRPs satisfy the same kinematic differential equation92 ¢ ¤ 1 1 £¡ σ˙ = B (σ) ω = 1 − σ T σ I + 2σ × + 2σσ T ω 4 4
(4.16)
where ω is the angular velocity. The matrix B has the useful property92 B −1 (σ) =
1 B T (σ) 1 + σT σ
Another useful property involving the matrix B is155 ¡ ¢ σ T B (σ) ω = 1 + σ T σ σ T ω
(4.17)
(4.18)
Aside from providing a non–singular attitude description, another advantage of the combined MRP set restricted to kσ(t)k ≤ 1 is that they behave nearly linearly for a large set of orientations. Figure 4.3 illustrates tan (θ/4) and the linearized θ/4 for rotations up to θ = π.
4.3. ROTATIONAL DYNAMICS
59
1
tan(θ/4) θ/4
0.5
!Π
!
Π 2
Π 2
Π
!0.5
!1
Figure 4.3: Illustration of the weakly nonlinear behavior of the MRPs restricted to kσk ≤ 1. Having the analytical mapping between two possible MRP sets allows for two attitude motion descriptions to be solved simultaneously, using only one integration of the kinematic equations. After integrating the kinematic equations, the MRP set can be switched if kσk ≥ 1 and then the integration can continue. Note that the mapping in Eq. (4.11) is valid for any non–singular switching point. This observation allows the integration procedure to avoid the need to track the kσk = 1 surface crossing precisely. Instead, the mapping step is performed only if the MRP set falls outside this surface. Note that in general, the MRP can switched to the shadow set at any surface of kσk ≥ 1. The shadow MRP mapping cannot be performed at conditions kσk < 1. For example, suppose a switching condition of kσk = 1/2 is specified. It follows from Eq. (4.11) that kσ S k = 2. Since 2 > 1/2, the MRP must immediately be switched back again and the cycle continues indefinitely. The most convenient switching condition is kσk ≥ 1 since that corresponds to the principal rotation angle of π. However there may be certain circumstances where other switching surfaces are favorable for a particular application. Therefore the covariance transformations developed in the following section are kept to the general case of any switching surface greater than one. Note that it is possible to construct other minimal attitude coordinate sets which are even more linear with respect to the principal rotation angle θ than the MRPs. Reference 149 calls them the Higher Order Rodrigues Parameters (HORPs). Parameters ϑ can be developed which are written as ¶ µ θ (4.19) ϑ = e tan 2N where N ≥ 1 is an integer value. These HORPs also contain multiple sets of possible values which can be used to avoid singular attitude descriptions. The MRP covariance mapping methods developed in this paper could be used for the HORP descriptions as well, but are not developed in this work. 4.3.1.3
Nonsingular Attitude Filtering Using Modified Rodrigues Parameters
In order to use the MRP shadow set singularity avoidance technique for attitude estimation, a mapping must also be developed in order to transform the MRP state estimate error covariance
4.3. ROTATIONAL DYNAMICS
60
matrix into the shadow set MRP state estimate error covariance matrix. In previous applications of the MRPs to attitude estimation problems, the state covariance matrix has implicitly been kept fixed during this switching to the shadow set.101 The following section describes the application of the shadow MRP set for singularity avoidance in the Kalman filter, including a first–order covariance transformation to accompany the MRP singularity avoidance mapping. During the course of state propagation or following the state update, the state can be switched to the shadow state if certain conditions are met, namely if kσk > σr where σr is a threshold value. The shadow set transformation is given by xS = λ (x), where ( ¡ ¢−1 ) − σT σ σ λ (x) = (4.20) β ¯k To examine the covariance transformation at the switching point, let the covariance matrix P be decomposed into sub-matrices with the structure · ¸ P σσ P σβ ¯ Pk = (4.21) P Tσβ P ββ where P σσ is the covariance matrix of the MRP state, P ββ is the covariance matrix of the bias state, and P σβ is the cross-correlation matrix between the MRP and the bias state. It follows that the covariance mapping to the shadow MRP set in the neighborhood of the reference MRP condition is given by ¸· T ¸ · ¸· P σσ P σb Λ11 0 Λ11 0 S T ¯ ¯ P k = ΛP k Λ = P Tσβ P ββ 0 I 0 I ¸ · T Λ11 P σσ Λ11 Λ11 P σβ (4.22) = P Tσb ΛT11 P ββ where
∂λ Λ= = ∂x
¢ ¸ · ¡ −4 T 2σ σσ − σ −2 I 0 0 I
(4.23)
and Λ11 = 2σ −4 σσ T − σ −2 I. Note that this covariance mapping scales all MRP components. Assume that σ = kσk is small, and the associated covariance components are small as well indicating good attitude knowledge. Then the corresponding shadow MRP set is stretched toward infinity due to σ being near zero. The associated covariance matrix for the shadow set is large as well, reflecting the large changes in coordinate values in the neighborhood of the singularity. The rate bias covariance is held constant during the MRP mapping, which is expected since the bias estimate itself is held constant in Eq. (4.20). Following the development in Ref. 79 and 80, a first–order divided difference transformation of the state covariance matrix to the shadow state covariance matrix suitable for the DD1 filter is given by n X £ ¡ ¢ ¡ ¢¤ £ ¡ ¢ ¡ ¢¤T ˆ S1 = 1 ˆ k + cˆ ˆ k − cˆ ˆ k + cˆ ˆ k − cˆ P λ x sxj − λ x sxj λ x sxj − λ x sxj k 2 4c j=1
(4.24)
4.4. TRANSLATIONAL DYNAMICS
61
Similarly the second–order transformation suitable for the DD2 filter is n 2 X £ ¡ ¢ ¡ ¢ ¤ ˆ S2 = P ˆ S1 + c − 1 ˆ k + hˆ ˆ k − cˆ P λ x sxj + λ x sxj − 2λ (ˆ xk ) k k 4 4c j=1 £ ¡ ¢ ¡ ¢ ¤T ˆ k + cˆ ˆ k − hˆ xk ) · λ x sxj + λ x sxj − 2λ (ˆ
(4.25)
Following these covariance transformations at the switching point, the square–root decompositions of the state covariance can be calculated from Eqs. (3.33) and (3.34), which are in turn used to continue the state propagations forward in time according to Eqs. (3.37), (3.39), (3.51), (3.53), (3.55) and (3.57) until the next measurement update.
4.3.2
Attitude Dynamics
The dynamic equations describing the change in angular momentum are the well–known Euler equations, ω˙ = −I−1 ω × Iω + I−1 τ (4.26) where ω is the inertial angular velocity of the body, I is the inertia tensor of the vehicle, and τ is the net control and/or disturbance torque. The relative angular velocity between the chaser and the L frame is δω = ω − Ω where Ω is the angular velocity of the L frame (with all quantities represented in the spacecraft B frame). By solving for ω and substituting into Eq. (4.26), the dynamic equation for the relative angular velocity becomes ˙ + I−1 τ δ ω˙ = −I−1 δω × Iδω − I−1 δω × IΩ − I−1 Ω× Iδω − I−1 Ω× IΩ + Ω
(4.27)
The angular velocity Ω is given by
0 Ω = T (σ) −ω0 0
(4.28)
where σ is the MRP representing the transformation from the L frame to the B frame and ω0 is the angular velocity of the reference orbit.
4.4
Translational Dynamics
The translation equations of motion for a spacecraft relative to an elliptical Keplerian reference orbit are well known and can be written as92 µx x ¨ − 2ω0 z˙ − ω˙0 z − ω02 x + h i3/2 x2 + y 2 + (r0 − z)2 µy y¨ + h i3/2 x2 + y 2 + (r0 − z)2 z¨ + 2ω0 x˙ + ω˙ 0 x − ω02 z +
µ µ (r0 − z) −h i3/2 2 r0 x2 + y 2 + (r0 − z)2
= ux + vx
(4.29)
= uy + vy
(4.30)
= uz + vz
(4.31)
4.4. TRANSLATIONAL DYNAMICS
62 µ r02 2r˙0 ω0 ω˙ 0 + r0
r¨0 − r0 ω02 +
= 0
(4.32)
= 0
(4.33)
Here, x is the in-track position component, z is the position component along the negative radial direction, and y is the position along the negative orbit normal direction. The variables r0 and ω0 correspond to the radius and angular velocity of the reference orbit, and µ is the gravitational parameter of the planet. It is convenient to introduce a transformation of variables such that the equations of motion are in spherical coordinates centered at the reference point.139 Such a transformation can be found by setting x = ρ cos φ cos θ
(4.34)
y = ρ sin φ
(4.35)
z = −ρ cos φ sin θ
(4.36)
where ρ is the range between the target spacecraft and the maneuvering spacecraft, θ is an azimuth angle in the reference orbit plane measured from the x-axis, positive toward the −z direction, and φ is an out of plane angle measured from the x − z plane positive toward the y-axis. After the substitution of this transformation the equations of motion become ³ ´2 µ ρ¨ = ω0 − θ˙ ρ cos2 φ + ρφ˙ 2 + 2 sin θ cos φ r0 µ (ρ + r0 cos φ sin θ) (4.37) −¡ ¢3/2 + uρ + vρ r02 + 2r0 ρ cos φ sin θ + ρ2 ³ ´ ³ ´ ρ˙ µ cos θ sec φ − 2 ω0 − θ˙ φ˙ tan φ + θ¨ = ω˙ 0 + 2 ω0 − θ˙ ρ r02 ρ µr0 cos θ sec φ − ¡ (4.38) ¢3/2 + uθ + vθ 2 ρ r0 + 2r0 ρ cos φ sin θ + ρ2 ´2 1³ 2φ˙ ρ˙ µ sin θ sin φ φ¨ = − ω0 − θ˙ sin 2φ − − 2 ρ r02 ρ µr0 sin θ sin φ + ¡ (4.39) ¢3/2 + uφ + vφ ρ r02 + 2r0 ρ cos φ sin θ + ρ2 where the control inputs are uρ = ux cos θ cos φ + uy sin φ − uz sin θ cos φ " # ¡ ¢ 2r0 ρ sin2 θ + r02 + ρ2 sin θ sec φ ¡ ¢ uθ = −ux ρ r02 + 2r0 ρ cos φ sin θ + ρ2 " # ¡ ¢ 2r0 ρ cos θ sin θ + r02 + ρ2 cos θ sec φ ¡ ¢ −uz ρ r02 + 2r0 ρ cos φ sin θ + ρ2 uφ = −ux
cos θ sin φ cos φ sin θ sin φ + uy + uz ρ ρ ρ
with similar relations for the process noise inputs.
(4.40)
(4.41) (4.42)
4.5. NAVIGATION SENSOR MODELS
63
The translation equations of motion can be written in the form ¨ = f (η, η, ˙ t) + u + v η where η =
4.5
£
ρ θ φ
¤T
,u=
£
uρ uθ uφ
¤T
and v =
£
vρ vθ vφ
(4.43) ¤T
.
Navigation Sensor Models
Vehicles performing autonomous rendezvous maneuvers must make use of a wide variety of navigation sensors to estimate the trajectory and perhaps other relevant parameters in order to successfully complete the mission. Having developed the dynamics of spacecraft rendezvous, this chapter discusses the modeling of sensor systems whose data can be processed to estimate the relative position, velocity, and orientation of the chaser vehicle.
4.5.1
Inertial Measurement Unit
An inertial measurement unit (IMU) is a device which measures applied accelerations and angular rates by using a system of accelerometers and gyroscopes. The mathematical modeling of such a system can be relatively complex when systematic errors are included in the model.153, 154 For the purposes of real–time error parameter estimation in the navigation filter, reduced–order models that capture the net error effects are preferred in order to reduce the computational complexity. 4.5.1.1
Gyroscope Model
The gyroscope system can be represented mathematically by using Farrenkopf’s model. In this model, the sensed angular velocity if expressed as the true angular velocity with an additive bias and white noise. The bias term is itself a slowly varying parameter driven by white noise. The model can be expressed as ˜ = ω + β + ηω ω β˙ = η β
(4.44) (4.45)
˜ is the sensed inertial angular velocity, ω is the true inertial angular velocity, β is the meawhere ω surement bias, and η ω and η β are unbiased and uncorrelated random vectors with variances given by σω2 and σβ2 , respectively. Discrete–time simulated gyroscope measurements can be generated according to this model by use of the equations141 ˜ k+1 ω
¢ 1¡ = ωk + β k+1 + β k + 2
β k+1 = β k + σβ (∆t)1/2 nβ
µ
¶1/2 σω2 1 2 + σ ∆t nω ∆t 12 β
(4.46) (4.47)
where k refers to the time increment, ∆t = tk+1 − tk is the sampling interval, and nω and nβ are unbiased, uncorrelated, unit–variance random vectors.
4.5. NAVIGATION SENSOR MODELS
4.5.1.2
64
Accelerometer Model
An accelerometer system measures the accelerations applied to the spacecraft. Typically these measurements are corrupted by noise in addition to systematic error such as bias, scale factor, and misalignment. Bias can easily be accounted for by subtracting the accelerometer reading during quiescent periods of flight without thrust or any other disturbance acceleration. During thrusting maneuvers, scale factor uncertainties become important. A model for acceleration measurements including scale factor and noise errors is ˜ m = (I + S) am + η a a
(4.48)
˜ m is the sensed acceleration, η a is the where am is the true acceleration at the IMU location, a measurement noise, and S is a diagonal matrix of constant scale factor errors. The accelerations at the vehicle center of mass can be calculated from ¡ ¢ a = am − ω˙ × + ω × ω × r m (4.49) where a is the center of mass acceleration and r m is the position of the IMU with respect to the vehicle center of mass.
4.5.2
Star Tracker Sensors
It is assumed that a star tracker or some other generic attitude sensor is available to provide corrections to the attitude estimates formed by direct numerical integration of the angular velocity measurements, which are subject to error buildup due to integrating errors in the estimated bias and the random noise. The star tracker is assumed to output an estimated quaternion that relates the orientation of the body to the inertial frame. The quaternion estimates are assumed to be unbiased but with a superimposed random measurement noise. The output from such a sensor can be expressed as q m = δq (δα) ⊗ q where q is the quaternion representing the true orientation, q m is the measured quaternion, and δq (δα) is an error quaternion parameterized by a random angular error δα. Similarly, the attitude sensing device can be assumed to output an estimated MRP that relates the orientation of the body to the inertial frame. The estimates are assumed to be unbiased but with a superimposed random measurement noise. The output from such a sensor can be expressed ˜ I = σ I + δσ where σ I is the MRP representing the true orientation of the vehicle with respect as σ ˜ I is the “measured” MRP, and δσ is an error MRP with covariance matrix to inertial space, σ denoted by R. For instance, the measured MRP could be an output from the algorithm described in Ref. 150, involving vector measurements. The inertial attitude MRP, σ I , can be written as a function of the relative attitude, σ, and the inertial orbital position angle θ0 . First, note that the matrix of the transformation from the I frame to the L frame can be written as a sequence of two elementary rotations, T 1 (−π/2) · T 3 (θ0 + π/2) where T i (ς) represents the matrix for an elementary rotation of angle ς about axis i. Using the axis-angle representation of the MRP given in Eq. (4.10), the transformation sequence can be expressed as the composite MRP, 0 tan (−π/8) ⊕ σ θ0 = 0 0 tan [(1/4) (θ0 + π/2)] 0
4.6. RENDEZVOUS GUIDANCE AND CONTROL
=
65
ª © 2 tan [(1/4) (θ0 + π/2)] − 1 tan (π/8) 1 −2 tan (π/8) tan [(1/4) (θ0 + π/2)] (4.50) £ ¤ 1 + tan2 (π/8) tan2 [(1/4) (θ0 + π/2)] 1 − tan2 (π/8) tan [(1/4) (θ0 + π/2)]
The inertial attitude MRP can then be expressed as σ I = σ ⊕ σ θ0 .
4.5.3
Laser/Radar Navigation Sensors
A radar or laser sensing system provides range, azimuth, elevation measurements between the sensor and the target. These measurements can be modeled as cos α cos ε (4.51) % = T (σ) r − δr s sin α cos ε sin ε where % is the range, α is the azimuth angle, and ε is the elevation angle. Here, r = [x, y, z]T is the cartesian relative position in the local frame and δr s is the sensor position in the body frame. Assuming the target spacecraft has either a system of retro-reflectors,157, 158 a network of light emitting diodes (LEDS),156 or a passive geometric sensing system,159 that provides multiple range, azimuth, and elevation measurements, then the relative attitude between the target and chaser can also be determined in addition to range and bearing. This relative attitude is modeled in the same ˜ = σ + δσ where σ ˜ is the manner as the inertial attitude sensor given in Sec. 4.5.2, namely that σ “measured” relative MRP, σ is the true relative attitude MRP and δσ is an error MRP.
4.5.4
Orbit Sensor
A wide variety of sensors can be used to estimate the orbit of the spacecraft. For example, Global Position System (GPS) orbit determination sensors can be used to Earth orbiting and some lunar orbit cases.160 In other cases, such as lunar orbit, autonomous orbit determination can be accomplished using optical sensors and landmark tracking.161 For the purposes of this dissertation, it is assumed that some general orbit determination sensor is available for use in the state estimator. This sensor is assumed to provide position data in the form of radius r0 and orbit angle θ0 measurements.
4.6
Rendezvous Guidance and Control
This section develops 6-DOF guidance and control schemes for rendezvous in elliptical orbit. These guidance and control schemes are fairly straightforward, as will be seen presently, but they are adequate for the purposes of illustrating the navigation filter performance during rendezvous maneuvers. Considerably more advanced control schemes for spacecraft rendezvous have been published recently, for instance the adaptive control formulations in Refs. 162 and 163. If required, these control laws could be implemented to improve performance, however such work is beyond the scope of this research.
4.6. RENDEZVOUS GUIDANCE AND CONTROL
4.6.1
66
Translational Guidance and Control
Given a commanded translational reference trajectory, η c , a translation error state can be defined as δη = η − η c . This error state obeys the differential equations ¨=η ¨ −η ¨ c = f (η, η, ˙ t) + u + v − η ¨c δη
(4.52)
This system can be controlled by using a feedback linearization of the form ¨ c − f (η, η, ˙ t) − K η δη − K η˙ δ η˙ u=η
(4.53)
By substituting Eq. (4.53) into Eq. (4.52), the closed–loop system becomes ¨ + K η δη + K η˙ δ η˙ = v δη
(4.54)
This closed–loop system is asymptotically stable in the absence of disturbance inputs for any gain matrices K η > 0 and K η˙ > 0. These gains can be specified by using a number of different approaches. For example, an approach based on desired closed–loop damping ratio and natural frequency is investigated in Ref. 48. Note that non–zero disturbance accelerations result from both model error and feedback error due to erroneous state estimates from the navigation outputs. This mixture of deterministic and stochastic disturbances suggests a gain design using a suboptimal H∞ approach. To this end, the closed–loop system can first be written in the standard state space form x˙ t = At xt + B t [ut + dt ] where xt = input, and
£
δη δ η˙
¤T
(4.55)
is the translational state, ut is the acceleration input, dt is a disturbance · At =
0 I 0 0
¸
· ,
Bt =
0 I
¸ (4.56)
The infinite horizon full information state feedback H∞ control results from the solution of the Ricatti equation129 µ ¶ 1 T T T X t At + At X t − X t B t B t − 2 B t B t X t + C t = 0 (4.57) κ where C t is a state error weighting matrix and κ is the the H∞ performance bound. Once the algebraic Ricatti equation is solved for matrix X t , the state feedback control law is ut = −B Tt X t xt
(4.58)
If the state error weighting matrix C t is chosen to be diagonal, then the state feedback gain matrix can be decomposed into the following structure to solve for the gains K η and K η˙ , £ ¤ B Tt X t = K η K η˙ (4.59) It is assumed here that a suitable reference trajectory η c is available to provide the guidance commands. In general this trajectory can be specified using a multitude of approaches depending on the specific nature of the rendezvous and docking sequence and path constraints for a particular spacecraft application. For example, the rendezvous guidance can be formulated as either minimum fuel or minimum time optimal trajectories with path constraints,164 as nonoptimal glideslope approaches,165 or using non-linear guidance techniques as described in Ref 166.
4.6. RENDEZVOUS GUIDANCE AND CONTROL
4.6.2
67
Attitude Guidance and Control
Attitude guidance commands are generated by solving for the MRP σ c that provides zero azimuth and elevation angles so that the radar boresight is aligned with the target vehicle. The following system of nonlinear algebraic equations is solved at each guidance cycle αc (σ c ) = 0
(4.60)
εc (σ c ) = 0
(4.61)
ϕc (σ c ) = 0
(4.62)
The quantity ϕc specifies the relative roll angle and is defined by ϕc = y L · z B £ ¤ £ ¤T = 0 1 0 · T (σ)T · 0 0 1 ¡ ¢ 8σ2 σ3 + 4σ1 1 − σ T σ = (1 + σ T σ)2
(4.63)
A zero-order hold is applied to the MRP attitude commands in order to generate a MRP rate command. The rate command is computed using a backward difference derivative between the current MRP command and the lagged MRP command. The commanded MRP and MRP rate are the inputs to the attitude control law. Given the commanded MRP and MRP rate, σ c and σ˙ c , respectively, an attitude control law to track these commands can be constructed using the multi–input backstepping method.167 Here, the control design is split into a sequence of two sub-problems. First, the angular velocity is assumed to be a control, which is chosen to suitably stabilize the attitude kinematics. Next, torque commands are generated in order to track the desired angular velocity. In order to construct this controller, an error MRP is defined as δσ = σ ª σ c . The error MRP obeys the kinematic differential equation 1 δ σ˙ = B (δσ) δω 4
(4.64)
Assuming the relative angular rate δω = ν (δσ) can be chosen arbitrarily, a Lyapunov function can easily be constructed in order to stabilize the relative MRP kinematics. To this end, a candidate Lyapunov function is ¡ ¢ (4.65) V (δσ) = 2kv ln 1 + δσ T δσ where kv > 0 is a gain. Making use of the identity in Eq. (4.18), the candidate Lyapunov function rate is V˙ =
4kv kv δσ T δ σ˙ = δσ T B (δσ) ν (δσ) = kv δσ T ν (δσ) T 1 + δσ δσ 1 + δσ T δσ
(4.66)
By choosing the function ν (δσ) = −K σ δσ, where K σ > 0, the Lyapunov function rate becomes ˙ V = −kv δσ T K σ δσ < 0. According to Theorem 4.2 in Ref. 167, the relative kinematics are asymptotically stable with this choice of function ν (δσ) since the function V (δσ) is positive definite with negative definite rate. Moreover, the origin is exponentially stable as can be seen
4.6. RENDEZVOUS GUIDANCE AND CONTROL
68
from the following expansion of the kinematics differential equation. The closed-loop kinematics are 1 δ σ˙ = − B (δσ) K σ δσ 4µ ¶ 1 1 + δσ T δσ × T = − I − δσ + δσδσ − I K σ δσ 2 2 µ ¶ 1 1 1 + δσ T δσ × T (4.67) = − K σ δσ + δσ + δσδσ − I K σ δσ 4 2 2 Clearly the linearization of the closed–loop kinematics is Hurwitz since K σ > 0, and therefore the origin δσ = 0 is exponentially stable, in view of Theorem 4.15 in Ref. 167. Next, control torques must be provided that cause the spacecraft angular velocity to track the desired angular velocity δω = ν (δσ) = −K σ δσ. An augmented Lyapunov function can be introduced as 1 Va (δσ, δω) = V (δσ) + [δω − ν (δσ)]T [δω − ν (δσ)] (4.68) 2 The Lyapunov function rate is · ¸ ∂ν ∂V T δ σ˙ + [δω − ν (δσ)] δ ω˙ − δ σ˙ V˙ a (δσ, δω) = ∂δσ ∂δσ 1 ∂V 1 ∂V = B (δσ) ν (δσ) + B (δσ) [δω − ν (δσ)] 4 ∂δσ 4 ∂δσ £ + [δω − ν (δσ)]T −I−1 δω × Iδω − I−1 δω × IΩ − I−1 Ω× Iδω ¸ 1 ∂ν −1 × −1 ˙ −I Ω IΩ + Ω + I τ − B (δσ) δω (4.69) 4 ∂δσ By choosing the control input τ
˙ = δω × Iδω + δω × IΩ + Ω× Iδω + Ω× IΩ − IΩ · ¸T 1 ∂V 1 ∂ν B (δσ) δω − I B (δσ) − IK ω [δω − ν (δσ)] + I 4 ∂δσ 4 ∂δσ
(4.70)
where K ω > 0, the Lyapunov function rate becomes V˙ a = −δσ T K σ δσ − [δω − ν (δσ)]T K ω [δω − ν (δσ)] < 0
(4.71)
Since the function Vs is positive definite and radially unbounded with a negative definite rate, it follows from Lyapunov’s direct method (Theorem 4.3 in Ref. 167) that the origin of the closed–loop system is globally asymptotically stable. By substituting the appropriate expressions for V (δσ) and ν (δσ), the control torque τ is ˙ = δω × Iδω + δω × IΩ + Ω× Iδω + Ω× IΩ − IΩ kv 1 (4.72) − IK σ B (δσ) δω − Iδσ − IK ω [δω + K σ δσ] 4 2 Substituting this control law into Eq. (4.27) and linearizing about (δσ, δω) = (0, 0) yields τ
1 δω 4µ ¶ µ ¶ kv 1 δ ω˙ = − I + K ω K σ δσ − K ω + K σ δω 2 4 δ σ˙ =
(4.73) (4.74)
4.6. RENDEZVOUS GUIDANCE AND CONTROL
69
Following a similar logic as that discussed in the translational controller section, the gains can be chosen according to a suboptimal H∞ controller development. First, the linearized rotational system can be written in the form x˙ r = Ar xr + B r [ur + dr ]
(4.75)
£ ¤T where xr = δσ δω is the rotational state, ur is the angular acceleration input, dr is a disturbance input, and · ¸ · ¸ 0 14 I 0 Ar = , Br = (4.76) 0 0 I The H∞ full information state feedback control law is ur = −B Tr X r xr
(4.77)
where X r is the solution to a Ricatti equation of the same form shown in Eq. (4.57) corresponding to the rotational system. By choosing a diagonal state error weighting matrix, the state feedback gain matrix can be decomposed into B Tr X r =
£ ¡k v 2
I + KωKσ
¢ ¡ ¢ ¤ K ω + 41 K σ
(4.78)
Note that this approach leaves three unknowns, namely the gains kv , K σ , and K ω , with only two equations. The implication is that families of solutions can be obtained for given values of one parameter. In this work, it is convenient to specify the gain kv and then solve for K σ and K ω from Eq. (4.78).
Chapter 5
Simulation Results This chapter discusses simulation results of the robust and adaptive filtering techniques introduced in Chapter 3. These results include radar tracking of an entry vehicle, adaptive estimation illustrated using the multiplicative quaternion filtering technique, with both Gaussian and non– Gaussian noise, attitude filtering using the modified Rodrigues parameters, and finally, the full 6-DOF rendezvous navigation simulation.
5.1
Radar Tracking Problem
This section discusses the application of the robust filters to the problem of estimating the trajectory of a target using range measurements recorded from a radar tracking station. The example problem is to estimate the trajectory of a mass falling through an exponential atmosphere with a constant, yet unknown, drag coefficient. The gravitational acceleration acting on the body is neglected in the dynamic model. This truncated model is valid for high initial velocities that cause the aerodynamic acceleration to dominate over the gravitational acceleration. This benchmark nonlinear filtering problem was initially studied in Ref. 131 and has been repeated numerous times in the literature. This problem is especially of interest for non–Gaussian estimation problems given the known non– Gaussian nature of radar noise, including for instance that of glint.60, 132 Fig. 5.1 shows the geometry of the problem.
5.1.1
Dynamic Model and Measurement Equations
The dynamic model for the radar tracking problem described above can be derived by writing x˙ 1 = −x2 CD Aρ 2 x˙ 2 = − x 2m 2
(5.1) (5.2)
where x1 represents the altitude of the mass, x2 its downward velocity, CD is the drag coefficient, A is the cross-sectional area, m is the mass, and ρ is the atmospheric density, which is assumed to follow an exponential function of the form ρ = ρ0 e−ηx1
70
(5.3)
5.1. RADAR TRACKING PROBLEM
71
yk
x2
radar location b x1
a
Figure 5.1: Geometry of Example Problem
where the quantity η is the known constant inverse density scale height. If the aerodynamics of the target are considered to be an unknown parameter to be estimated in real time, then a third state variable can be expressed as r CD Aρ0 x3 = (5.4) 2m Here, the square-root of CD Aρ0 /2m is used since this term must always be positive, in other words since the quantity x23 is always non-negative. In summary, the complete dynamic model for this problem is expressed as x˙ 1 = −x2 x˙ 2 =
−x23 x22 e−ηx1
x˙ 3 = 0 The radar measurement equation is q yk = b2 + [x1 (tk ) − a]2 + wk
(5.5) (5.6) (5.7)
(5.8)
where wk represents zero-mean random error, with probability density function f (wk ). Random measurement errors are drawn from the mixture of zero–mean Gaussian probability distributions, defined by the probability density function µ ¶ · µ 2 ¶¸ µ ¶ · µ 2 ¶¸ wk wk 1−² ² √ √ f (wk ) = exp − + exp − (5.9) 2 2σ1 2σ22 σ1 2π σ2 2π
5.1. RADAR TRACKING PROBLEM
72
Table 5.1: Simulation Parameters Parameter Value a, km 30.5 b, km 30.5 −1 η, m 1.64 · 10−4 σ1 , m 30.5 γ 1.345 2 c 3.0
Initial State x1 (0), km x2 (0), km/s √ x3 (0), 1/ m
Table 5.2: Initial Conditions True Value Estimated Value Standard Deviation 91.5 91.5 0.31 6.1 6.1 0.06 0.06 0.01 0.02
where σ1 and σ2 are the standard deviations of the individual Gaussian distributions, and ² is a perturbing parameter that represents error model contamination. The standard deviations σ1 are chosen according to Table 5.1 and σ2 is chosen as σ2 = 5σ1 . The measurements are assumed to occur at a frequency of 1 Hz. The model parameters and initial conditions for the problem are summarized in Table 5.1. The true trajectory for these initial conditions is shown in Fig. 5.2.
5.1.2
Results of Example Problem: Perfect Noise Case
This section discusses the results of applying several filters to the benchmark tracking problem with both Gaussian and non–Gaussian measurement noise cases. These filters include the EKF, DD1, DD2, and the robust versions of each using the one–step Huber update. The results of a Monte–Carlo simulation are shown in the following figures. In this simulation, 2000 trial cases have been conducted, each case terminating after an elapsed time of 60 s. The results presented in this subsection are for the case with perfect knowledge of the measurement error variance σ12 with no adaptive tuning. 5.1.2.1
Comparison of Leverage Point Identification Methods
This section discusses the impact of the leverage point identification methods on the state estimates using the Huber discrete–time filtering technique. Fig. 5.3 shows a comparison of the average state estimate errors for the case ² = 0, and Fig. 5.4 shows the average state estimate errors for the case ² = 0.5. In these plots, the estimation errors found by using the projection statistics are shown in the solid curve, the errors found by using the Mahalanobis distances are shown in the dashed curve, and estimation errors without using leverage point identification are shown in the dash-dot curve. These results show that the leverage point identification does not have a significant impact on the state estimation accuracy for this problem. In the cases of the Mahalanobis distances,
5.1. RADAR TRACKING PROBLEM
73
7
100 90
6
80
5 Velocity [km/s]
Altitude [km]
70 60 50 40
4 3 2
30 20
1 10 0 0
10
20
30 Time [s]
40
(a) True Position
50
60
0 0
10
20
30 Time [s]
40
50
60
(b) True Velocity
Figure 5.2: True Trajectory of Target the results are exactly equal to the cases that do not use a leverage point identification method. The cases using projection statistics leads to an increased overall estimation accuracy. In each case, the leverage point identification using the Mahalanobis distances costs approximately 1% more computation than the case without a leverage point identification, whereas the case using projection statistics costs approximately 5% more computation. In this application, the benefits of the use of projection statistics for detecting and weighting the leverage points does not seem worth the cost in computation. In problems of higher dimension, however, it is anticipated that the benefits of the use of projection statistics will increase. 5.1.2.2
Comparison of Filters
The absolute value of the median errors are shown for the case of ² = 0 in Figs. 5.5(a)–(c). In this case the DD2 filter gives a smaller estimation error than the other robust and nonrobust filters. The DD1 filter exhibits slightly larger errors than the EKF. These results are not surprising based on the results given in Ref. 79 and 80. The robust filters do not perform as well as their non-robust counterparts in this case, because the Huber update does not minimize the `2 norm during the measurement update. The increase in the estimation error for the robust filters is to be expected in a perfectly Gaussian simulation since the minimum `2 norm is the maximum likelihood estimator in this case. The absolute value of the median errors are shown in Figs. 5.5(d)–(f) for the case ² = 0.5, for the case where the measurement errors are highly non–Gaussian. In this case, the Huber–EKF and DD2 filters give comparable results to each other for the position and velocity errors, but the Huber–EKF gives a smaller error in the estimate of the ballistic parameter. Both Huber–EKF and DD2 are superior to the EKF and DD1 filter in this case. The Huber–DD2 filter exhibits the smallest errors, because it captures both nonlinearity and non-Gaussianity. The DD1 and Huber–DD1 filters do not perform as well as the EKF and the Huber–EKF, respectively, in the non–Gaussian case, which follows the behavior from the Gaussian case. In the non-Gaussian case,
5.1. RADAR TRACKING PROBLEM
74
0.01
0.02
Velocity Error Difference [m/s]
Altitude Error Difference [m]
0 −0.01 −0.02 −0.03 −0.04 MD PS
−0.05 −0.06 −0.07 0
0
−0.02
−0.04
−0.06
−0.08 MD PS
10
20
30 Time [s]
40
50
60
−0.1 0
10
(a) Estimated Position Errors
20
30 Time [s]
40
50
60
(b) Estimated Velocity Errors
Root Ballistic Coefficient Error Difference [m−1/2]
−6
0.5
x 10
0 −0.5 −1 −1.5 −2 −2.5 −3 −3.5 0
MD PS 10
20
30 Time [s]
40
50
60
(c) Estimated Ballistic Coefficient Errors
Figure 5.3: Estimated Trajectory Errors for ² = 0.0: Comparison of Leverage Point Identification Methods six cases of the EKF and two cases of the DD1 methods diverged completely, while the robust counterparts, Huber-EKF and Huber-DD1 did not exhibit divergence. Divergence problems with the Kalman filter have been noted previously.133 In this case, the ballistic parameter initialization is poor, which is compounded by the presence of non-Gaussian errors. The DD2 filter, being a second–order filter and therefore not as sensitive to initialization, did not diverge in any of the Monte-Carlo cases, but the median error is clearly reduced by making use of the Huber update method. The computational cost associated with implementing the each filter is summarized in Table 5.3. In this table, the computational costs are divided by the EKF processing time to provide a ratio of the cost relative to that associated with the EKF. These ratios are based on the median computation time for each filter during the Monte-Carlo simulation. The results show that the Huber–EKF filter requires the smallest relative computational cost whereas the DD2 and Huber–DD2 filters require a
75
2
10
0
5 Velocity Error Difference [m/s]
Altitude Error Difference [m]
5.1. RADAR TRACKING PROBLEM
−2 −4 −6 −8 −10 −12 0
20
30 Time [s]
40
50
−5 MD PS
−10 −15 −20
MD PS 10
0
60
−25 0
10
(a) Estimated Position Errors
20
30 Time [s]
40
50
60
(b) Estimated Velocity Errors
Root Ballistic Coefficient Error Difference [m−1/2]
−4
2
x 10
0
−2
−4
−6 MD PS −8
−10 0
10
20
30 Time [s]
40
50
60
(c) Estimated Ballistic Coefficient Errors
Figure 5.4: Estimated Trajectory Errors for ² = 0.5: Comparison of Leverage Point Identification Methods more: 3.12 and 3.15 times the total computation, respectively. It is not surprising that the Huber– DD2 filter has the largest cost, because it has the smallest errors for the non-Gaussian case, but it is interesting to note that the similar levels of accuracy in the non-Gaussian case can be found by use of the Huber–EKF filter over that of DD2 filter, for only a fraction of the computation time. The results show that for perfectly Gaussian error distributions the standard DD2 filter exhibits the lowest estimation error time history, which was the expected outcome based on previously published results. The DD1 filter exhibited slightly larger estimation errors than that of the EKF. The filters with the Huber update technique produced larger errors than the standard update, since the standard form of the update is a the maximum likelihood estimate for the perfectly Gaussian case. However, for non–Gaussian error distributions, the modified filters with the Huber update outperformed the standard filters. The modified DD2 filter with the Huber update equation
5.1. RADAR TRACKING PROBLEM
76
4
10 EKF DD1 DD2 HEKF HDD1 HDD2
Altitude Error [m]
2
10
EKF DD1 DD2 HEKF HDD1 HDD2
2
10 Velocity Error [m/s]
3
10
1
10
0
10
0
10
−2
10 −1
10
−4
0
10
20
30 Time [s]
40
50
60
10
(a) Estimated Position Errors for ² = 0.0
0
10
20
30 Time [s]
40
50
60
(b) Estimated Velocity Errors for ² = 0.0
−2
Root Ballistic Coefficient Error [m−1/2]
10
−3
10
−4
10
−5
10
−6
10
−7
10
−8
10
0
EKF DD1 DD2 HEKF HDD1 HDD2 10
20
30 Time [s]
40
50
60
(c) Estimated Ballistic Coefficient Errors for ² = 0.0
Figure 5.5: Estimated Trajectory Errors for ² = 0 Table 5.3: EKF-Relative Computation Ratios Filter Computation Ratio H-EKF 1.08 DD1 2.95 H-DD1 3.14 DD2 3.02 H-DD2 3.19
exhibited the smallest errors in the non-Gaussian numerical simulations conducted. The HuberEKF and the Huber-DD1 filters were able to mitigate divergence problems in their non-robust counterparts.
5.2. ADAPTIVE MULTIPLICATIVE QUATERNION FILTERING
77
3
10 EKF DD1 DD2 HEKF HDD1 HDD2
Altitude Error [m]
2
10
EKF DD1 DD2 HEKF HDD1 HDD2
2
10 Velocity Error [m/s]
3
10
1
10
0
1
10
0
10
−1
10
10
−2
10 −1
10
−3
0
10
20
30 Time [s]
40
50
60
10
(a) Estimated Position Errors for ² = 0.5
0
10
20
30 Time [s]
40
50
60
(b) Estimated Velocity Errors for ² = 0.5
−1
Root Ballistic Coefficient Error [m−1/2]
10
−2
10
−3
10
−4
10
−5
10
−6
10
0
EKF DD1 DD2 HEKF HDD1 HDD2 10
20
30 Time [s]
40
50
60
(c) Estimated Ballistic Coefficient Errors for ² = 0.5
Figure 5.6: Estimated Trajectory Errors for ² = 0.5 Comparisons of the computational costs associated with each filter show that the Huber–EKF filter is able to process data at a rate approximately three times faster than the standard DD2 filter, and produces similar accuracy levels in the non–Gaussian case. Therefore, for non-Gaussian cases, the Huber–EKF filter is superior to the standard DD2 filter. If computation costs are not a concern for the particular application, then the Huber–DD2 filter exhibits the best performance.
5.2
Adaptive Multiplicative Quaternion Filtering
This section describes the results of the application of the filtering techniques discussed in previous sections to the spacecraft attitude estimation problem using gyroscopes and star trackers. The standard Kalman filter, Myers–Tapley adaptive Kalman filter, Huber filter, and the proposed modified Myers–Tapley adaptive Huber filter are applied to the attitude estimation problem. The
5.2. ADAPTIVE MULTIPLICATIVE QUATERNION FILTERING
78
example includes both Gaussian and non–Gaussian noise densities with unknown statistics. In this example, the true spacecraft angular velocity is ω = [ ω0 ω0 ω0 ]T , for ω0 = 10−3 rad/s. The angular velocity is sampled at a rate of 10 Hz, with star tracker updates at a rate of 1 Hz. Noise samples for the gyroscope and star tracker measurements are drawn from a mixture model with a probability density function of the form µ ¶ ¶ µ 1−² w2 ² |w| f (w) = √ exp − (5.10) + exp − 2 2b b 2π √ where b = 5/ 2. Note that this density is a mixture of a nominal Gaussian with a Laplacian contaminating density. A comparison of the probability density and distribution functions for the cases ² = 0 (no contamination) and ² = 0.1 (with 10 % contamination) is shown in Fig. 5.7. A comparison of pure Gaussian with the contaminated Gaussian densities is shown in Fig. 5.7(a), the distribution functions are shown in Fig. 5.7(b), and a quantile–quantile plot (or QQ plot) in Fig. 5.7(c). From the density function and distribution function plots it is not entirely obvious that the contaminating density is in fact non-Gaussian; it appears to have Gaussian characteristics but with a larger variance. The differences between the two distributions is much more apparent in the QQ plot in Fig. 5.7(c). A QQ plot is a plot of the scaled ordered data against the quantiles of a comparison distribution. Since the data are scaled prior to creating the plot, the result is independent of the variance, rendering only the shape of the distribution to be important. A linear result with unit slope indicates that the data follows the same distribution as the comparison distribution (the Gaussian, in this case). The QQ plot of the contaminated Gaussian indicates that the data follows a roughly Gaussian distribution in the middle ranges but with a greater thickness in the extremes. This result indicates that the contaminated distribution has a higher probability of generating extreme points. The sensor uncertainty specifications are σω2 = 2.25 · 10−13 rad2 /s, σβ2 = 2.25 · 10−19 rad2 /s3 , and σs2 = 3.81 · 10−8 rad2 . It is assumed that the known sensor uncertainties differ from the true sensor uncertainties by a factor of 50% of the standard deviation. In addition, the star tracker measurement errors are initially assumed to be uncorrelated in each axis whereas the true errors are correlated with a correlation coefficient of 0.5 in each axis. The Huber filter and adaptive Huber filter use an initial value for the tuning parameter of γ = 1.5. The tuning parameter is specified to be bounded such that 1 ≤ γ ≤ 2 within the adaptive Huber filter. The adaptive filtering techniques are implemented in such a way that they begin estimating the noise statistics after 25 samples and store up to a specified maximum threshold of observations. This maximum threshold is varied in later sections to show the improvements that can be achieved through larger samples. The adaptive filtering techniques use a value kf = 0.9 to smooth the covariance and contamination parameters estimates.
5.2.1
Gaussian Simulation
This section describes the results of a 2000 case Monte-Carlo simulation involving pure Gaussian random errors (² = 0) with the specified noise variances discussed in the previous section. The adaptive filtering techniques make use of a maximum buffer size of 100 observations in forming the estimates of the process and measurement noise covariance matrices.
5.2. ADAPTIVE MULTIPLICATIVE QUATERNION FILTERING
0.4 0.35
1 ε=0 ε=0.1
0.9
79
ε=0 ε=0.1
0.8 Distribution Function
Density Function
0.3 0.25 0.2 0.15
0.7 0.6 0.5 0.4 0.3
0.1
0.2 0.05 0 −3
0.1 −2
−1 0 1 Standard Residual
2
3
0 −3
−2
(a) Density Functions 6
−1 0 1 Standard Residual
2
3
(b) Distribution Functions ε=0 ε=0.1
4
Quantiles
2
0
−2
−4
−6
−2
−1.5
−1
−0.5 0 0.5 Gaussian Quantiles
1
1.5
2
(c) Quantile–Quantile Plot
Figure 5.7: Comparison of Probability Density and Distribution Functions for ² = 0 and ² = 0.1 The results in the form of root mean square (RMS) errors are shown in Fig. 5.8. The total attitude angle RMS error is shown in Fig. 5.8(a), the vector norm of the gyroscope bias RMS error is shown in Fig. 5.8(b). The error in the RMS error prediction of the total attitude angle is shown in Fig. 5.8(c), and that of the gyroscope bias is shown in Fig. 5.8(d). The (1,1) component of the star tracker variance estimate RMS error is shown in Fig. 5.8(e), and the RMS error of the contamination parameter estimate is shown in Fig. 5.8(f). In each case, the Kalman filter results are shown with the blue curve, the adaptive Kalman filter results are shown with the cyan curve, and the Huber filter results are shown with the red curve. For the adaptive Huber filter cases, the filter based on the projection statistics is shown with the magenta curve while that based on the Mahalanobis distances is shown with the green curve. In this case, the attitude angle errors are not significantly different between the various tech-
5.2. ADAPTIVE MULTIPLICATIVE QUATERNION FILTERING
−1
1
10
10 KF AKF HF AHF−PS AHF−MD
Total Gyro Bias RMS Error [deg/hr]
Total Attitude Angle RMS Error [deg]
80
−2
10
0
100
200
300
400
0
10
−1
10
500
0
100
200
Time [s]
−1
10
−2
10
100
200
400
500
400
500
(b) Gyro Bias RMS Error Error in Gyro Bias RMS Error Prediction[deg/hr]
Error in Attitude Angle RMS Error Prediction [deg]
(a) Attitude Angle RMS Error
0
300 Time [s]
300
400
500
1
10
0
10
−1
10
0
100
Time [s]
200
300 Time [s]
(c) Error in Attitude Angle RMS Error Prediction
(d) Error in Gyro Bias RMS Error Prediction
−8
4
x 10
0.05 Contamination Parameter RMS Error
Rk(1,1) RMS Error [rad2]
3.5 3
2.5 2
1.5 1
0.5 0 0
100
200
300 Time [s]
˜ k (1, 1) RMS Error (e) R
400
500
0.045 0.04 0.035 0.03 0.025 0.02 0.015 0.01 0.005 0 0
100
200
300
400
Time [s]
(f) Contamination Parameter RMS Error
Figure 5.8: Gaussian Simulation RMS Errors
500
5.2. ADAPTIVE MULTIPLICATIVE QUATERNION FILTERING
81
niques even though the measurement statistics assumed by the filters are erroneous. The Kalman and adaptive Kalman filter provide similar performance, slightly superior to the Huber approaches, which is to be expected since the errors are perfectly Gaussian. The adaptive Huber filters show slightly better performance than the non–adaptive case. The adaptive Huber filter based on the Mahalanobis distances performs better than that based on the projection statistics, which is to be expected since the sample mean and covariance used in computing the Mahalanobis distances are maximum likelihood estimates for perfectly Gaussian problems. The same trends and relative performance between filters is shown in the gyroscope bias RMS error. The comparison of the error predictions in Figs. 5.8(c) and (d) show that the adaptive Kalman filter outperforms the other filters for both the attitude error prediction and rate bias error prediction. The predicted error estimates of the Huber–based adaptive filters are similar, and superior to the non–adaptive Huber and Kalman filters. The improved estimates of the attitude and bias errors for the adaptive filters is to be expected since these filters attain an improved knowledge of the measurement and process noise covariances. Naturally, the adaptive Kalman filter is superior since this problem is Gaussian. ˜ k (1, 1) RMS error results in Fig. 5.8(e) show that the adaptive filters are able to reduce The R the error in the assumed measurement statistics. The adaptive Kalman filter shows superior performance than the adaptive Huber filter for this case, which is expected since the errors are purely Gaussian in nature. For the same reason, the adaptive Huber filter based on the Mahalanobis distances is superior to that based on the projection statistics. In passing it should be mentioned that the other components of the measurement and process noise covariance estimates exhibit the ˜ k (1, 1) estimate, and therefore only this one particular quantity is shown as same behavior as the R an example. Finally, the contamination parameter RMS error shows that the adaptive Huber filter is able to reduce the error in the assumed contamination parameter by means of the formula based on the robust weighting parameters in Eq. 3.90. Note that the adaptive Huber filter is the only filter investigated in this dissertation that can estimate the contamination parameter, which is evident from the fact that the other filter results show a constant RMS error. In this case, both the Kalman and adaptive Kalman filter show no error in the contamination parameter estimate, as these filters implicitly assume the errors are Gaussian and this simulation was conducted with only Gaussian errors. The Huber filter shows a constant RMS error at the value of the contamination parameter corresponding to the tuning parameter γ = 1.5. Due to Gaussianity, the adaptive Huber filter based on the Mahalanobis distances is superior to the filter based on the projection statistics.
5.2.2
Non–Gaussian Simulation
This section describes the results of a 2000 case Monte-Carlo simulation involving non–Gaussian errors, specifically for the mixture model in Eq. (5.10) with ² = 0.1. The RMS error results corresponding to this simulation are shown in Fig. 5.9. The adaptive filters again use a buffer size of N = 100 stored residuals in order to compute the measurement and process noise covariance matrices. For this case, the total attitude RMS errors clearly show the superiority of the Huber–based filtering methods. The adaptive Huber method exhibits the smallest RMS error, followed by the non–adaptive Huber method. The projection statistics-based adaptive Huber filter is superior
5.2. ADAPTIVE MULTIPLICATIVE QUATERNION FILTERING
−1
1
10
10 KF AKF HF AHF−PS AHF−MD
Total Gyro Bias RMS Error [deg/hr]
Total Attitude Angle RMS Error [deg]
82
−2
10
0
100
200
300
400
0
10
−1
10
500
0
100
200
Time [s]
−1
10
−2
10
100
200
400
500
400
500
(b) Gyro Bias RMS Error Error in Gyro Bias RMS Error Prediction[deg/hr]
Error in Attitude Angle RMS Error Prediction [deg]
(a) Attitude Angle RMS Error
0
300 Time [s]
300
400
500
1
10
0
10
−1
10
0
100
200
Time [s]
300 Time [s]
(c) Error in Attitude Angle RMS Error Prediction
(d) Error in Gyro Bias RMS Error Prediction
−7
x 10
0.12 Contamination Parameter RMS Error
3
Rk(1,1) RMS Error [rad2]
2.5
2
1.5
1
0.5
0 0
100
200
300 Time [s]
˜ k (1, 1) RMS Error (e) R
400
500
0.1
0.08
0.06
0.04
0.02
0 0
100
200
300
400
Time [s]
(f) Contamination Parameter RMS Error
Figure 5.9: Contaminated Gaussian Simulation RMS Errors
500
5.2. ADAPTIVE MULTIPLICATIVE QUATERNION FILTERING
Table 5.4: Comparison of Identification Point Mi A 24.07 B 22.15 C 18.22
83
Techniques for Clustered Outliers Pi 166.53 166.96 126.07
to the filter based on the Mahalanobis distances, due to the non–Gaussianity in this example. Interestingly, the standard, non–adaptive Kalman filter exhibits smaller errors than that of the adaptive Kalman filter. This behavior is explored in more detail below. As with the previous case, the same trends seen in the attitude angle error appear in the gyroscope bias estimate RMS error, as expected. The predicted attitude and bias estimate errors show that the adaptive Huber–based filters are better predictors of the estimation errors than the other filters for the non–Gaussian case. As expected, the filter based on the projection statistics performs the best for both the attitude and bias error prediction. Of the non–adaptive filters, the Huber filter exhibits a better error prediction than the Kalman filter. ˜ k (1, 1) estimate is quite interesting. Here, the adaptive Huber technique The RMS error in the R based on the projection statistics is able to reduce the error associated with the assumed measurement noise covariance, whereas the adaptive Huber filter using the Mahalanobis distances and the adaptive Kalman technique exhibit an increased error. This increase in the measurement noise error is the cause of the increased error in the attitude angle estimate as previously noted. Essentially, the adaptive Kalman technique associates the contaminated measurements with an increase in the measurement covariance, therefore causing the assumed covariance to inflate in order to account for the contamination. This covariance inflation is known to cause an increase in the estimation error due to the fact that all measurements are processed as if they were outliers, receiving less weight, than a technique that is able to distinguish outlying measurements and weight them accordingly.20 Likewise, the adaptive Huber technique using the Mahalanobis distances suffers from the inherent limitations of the sample mean and covariance when applied to non-Gaussian problems. As discussed in the previous section, the only technique described in this dissertation to adaptively estimate the contamination parameter associated with the noise densities are the adaptive Huber-based filters. In the non–Gaussian case, the adaptive Huber filter is successfully able to the reduce the error in the assumed contamination parameter. However, the results of the filter based on the projection statistics is far superior to that of the Mahalanobis distances. Essentially, the filter based on the Mahalanobis distances attempts to find a compromise between the crude covariance inflation of the adaptive Kalman filter and the Huber filter. The result is that the contamination parameter estimate error does not improve substantially over that of the non–adaptive Huber filter, and the covariance estimate inflates slightly but not to the extent of the adaptive Kalman filter. All other filters assume (explicitly or implicitly) a constant contamination parameter. In the case of the adaptive and non–adaptive Kalman filters, the contamination is assumed to be zero, thus the error is constant at 0.1 for this case. The Huber filter error again corresponds to the assumption leading to the tuning parameter γ = 1.5. Figure 5.10 shows a scatter plot of the stored measurement residuals from the adaptive Huber
5.2. ADAPTIVE MULTIPLICATIVE QUATERNION FILTERING
84
0.15 Residuals Clustered Outliers
Residual ζj,3 [deg]
0.1
0.05
0
A C B −0.05
−0.1
−0.05 Residual ζ
j,2
0 [deg]
0.05
0.1
Figure 5.10: Example of Clustered Outliers in Adaptive Filter
technique, from an arbitrary stopping point in a non-Gaussian simulation, projected into the (2,3) plane. This sample includes 100 measurement residuals, with several apparent outliers. In particular, a group of 3 outliers appears in a cluster as indicated in the plot. The Mahalanobis Distances and Projection Statistics have been computed for this set of residuals, and the values corresponding to the clustered outliers is shown in Table 5.4. Compared with the χ23,0.95 = 7.81 threshold, both methods are able to detect the clustered outliers in this example. However, the Projection Statistics is not influenced by the clustering and assigns these point much smaller weights than the Mahalanobis Distances. The Projection Statistics provide a better estimate of the contamination parameter, giving a value of 0.104, opposed to the estimate based on the Mahalanobis Distances of 0.051, for this set of residuals.
5.2.3
Sensitivity to the Adaptive Filter Buffer Size
The previous two sections have discussed the application of the various filtering techniques to both Gaussian and non–Gaussian cases, using a maximum buffer size of 100 stored residuals for the adaptive filters. This section explores the trade off in performance found by using a smaller buffer size, with the expectation that processing a smaller number of stored residuals reduces the computational costs of the filter. Additional 2000 case Monte–Carlo studies were conducted for N = 50 and N = 25 for the cases ² = 0 and ² = 0.1. Figure 5.11 shows the results of the attitude angle RMS error for each adaptive filter investigated for this problem. Each subplot shows the result of a particular filter for a range of N for the given value of ². For instance, Fig. 5.11(a) shows results for the adaptive Kalman filter for a range of N and for ² = 0. These results show that, for this particular problem, the buffer size can be made as low as N = 25 without severe degradation in the filter performance for the attitude error estimates. It is also interesting to note that the scales are all the same in each subplot in Fig. 5.11, and the sensitivity of the adaptive Kalman filter can clearly been detected for the ² = 0.1 case compared with the ² = 0.0 results. Likewise, the insensitivity of the Huber–based approaches is readily apparent.
5.2. ADAPTIVE MULTIPLICATIVE QUATERNION FILTERING
−1
−1
10
10 AKF, N=100 AKF, N=50 AKF, N=25
Total Attitude Angle RMS Error [deg]
Total Attitude Angle RMS Error [deg]
85
−2
10
0
100
200
300
400
AKF, N=100 AKF, N=50 AKF, N=25
−2
10
500
0
100
200
Time [s]
(a) Attitude Angle RMS Error: AKF (² = 0) −1
−1
Total Attitude Angle RMS Error [deg]
Total Attitude Angle RMS Error [deg]
−2
10
100
200
300
400
AHF−MD, N=100 AHF−MD, N=50 AHF−MD, N=25
−2
10
500
0
100
200
Time [s]
300
400
500
Time [s]
(c) Attitude Angle RMS Error: AHF–MD (² = 0)
(d) Attitude Angle RMS Error: AHF–MD (² = 0.1)
−1
−1
10
10 AHF−PS, N=100 AHF−PS, N=50 AHF−PS, N=25
Total Attitude Angle RMS Error [deg]
Total Attitude Angle RMS Error [deg]
500
10 AHF−MD, N=100 AHF−MD, N=50 AHF−MD, N=25
−2
10
0
400
(b) Attitude Angle RMS Error: AKF (² = 0.1)
10
0
300 Time [s]
100
200
300
400
Time [s]
(e) Attitude Angle RMS Error: AHF–PS (² = 0)
500
AHF−PS, N=100 AHF−PS, N=50 AHF−PS, N=25
−2
10
0
100
200
300
400
500
Time [s]
(f) Attitude Angle RMS Error: AHF–PS (² = 0.1)
Figure 5.11: Attitude Angle RMS Errors for Varying Buffer Size
5.2. ADAPTIVE MULTIPLICATIVE QUATERNION FILTERING
−8
4.5
−7
x 10
3 AKF, N=100 AKF, N=50 AKF, N=25
4
x 10
AKF, N=100 AKF, N=50 AKF, N=25
2.5 Rk(1,1) RMS Error [rad2]
3.5
Rk(1,1) RMS Error [rad2]
86
3
2.5
2
1.5
2
1.5
1
1 0.5 0.5 0 0
100
200
300
400
0 0
500
100
200
Time [s]
˜ k (1, 1) RMS Error: AKF (² = 0) (a) R 12 AHF−MD, N=100 AHF−MD, N=50 AHF−MD, N=25
4
Rk(1,1) RMS Error [rad2]
Rk(1,1) RMS Error [rad2]
2.5 2
1.5
9 8 7 6 5
1
4
0.5
3 200
300
400
AHF−MD, N=100 AHF−MD, N=50 AHF−MD, N=25
10
3
100
x 10
11
3.5
2 0
500
100
˜ k (1, 1) RMS Error: AHF–MD (² = 0) (c) R −8
400
500
−8
4.5 AHF−PS, N=100 AHF−PS, N=50 AHF−PS, N=25
4
x 10
AHF−PS, N=100 AHF−PS, N=50 AHF−PS, N=25
4 3.5
Rk(1,1) RMS Error [rad2]
3.5
Rk(1,1) RMS Error [rad2]
300
˜ k (1, 1) RMS Error: AHF–MD (² = 0.1) (d) R
x 10
3
2.5
3
2.5
2
1.5
2
1.5
1
1
0.5
0.5
0 0
200 Time [s]
Time [s]
4.5
500
−8
x 10
0 0
400
˜ k (1, 1) RMS Error: AKF (² = 0.1) (b) R
−8
4.5
300 Time [s]
100
200
300
400
Time [s]
˜ k (1, 1) RMS Error: AHF–PS (² = 0) (e) R
500
0 0
100
200
300
400
Time [s]
˜ k (1, 1) RMS Error: AHF–PS (² = 0.1) (f) R
Figure 5.12: R11 RMS Errors for Varying Buffer Size
500
5.2. ADAPTIVE MULTIPLICATIVE QUATERNION FILTERING
0.12 AHF−MD, N=100 AHF−MD, N=50 AHF−MD, N=25 AHF−PS, N=100 AHF−PS, N=50 AHF−PS, N=25
0.1
0.08
Contamination Parameter RMS Error
Contamination Parameter RMS Error
0.12
87
0.06
0.04
0.02
0 0
100
200
300
400
Time [s]
(a) Contamination Parameter RMS Error (² = 0)
500
AHF−MD, N=100 AHF−MD, N=50 AHF−MD, N=25 AHF−PS, N=100 AHF−PS, N=50 AHF−PS, N=25
0.1
0.08
0.06
0.04
0.02
0 0
100
200
300
400
500
Time [s]
(b) Contamination Parameter RMS Error (² = 0.1)
Figure 5.13: Contamination Parameter RMS Errors for Varying Buffer Size ˜ k (1, 1) RMS errors for the adaptive filters for a range of N for both Figure 5.12 shows the R Gaussian and non–Gaussian cases. Differences are apparent in the filter performance depending on the type of filter and the parameter N , which controls the amount of data used in the adaptive filters for estimating the covariance matrices. In all cases, the R11 RMS error decreases as the parameter N is increased. Figure 5.13 shows the contamination parameter estimates for the Huber filters based on the Mahalanobis Distances and the Projection Statistics. These results show interesting behavior in estimates based on the Mahalanobis distances in that they are actually more accurate for smaller sample sizes in the case of no contamination. This effect implies that the Mahalanobis distances tend to be optimistic regarding the contamination in small samples. This phenomenon is another well known limitation of the Mahalanobis distances: the small sample Mahalanobis distances tend to regard the entire sample as Gaussian, thus setting a lower contamination ratio, which in the Gaussian case leads to a lower error level.116 In the non–Gaussian case, the opposite trend occurs and the error increases since the true distribution has nonzero contamination. The estimates based on the projection statistics are not as accurate for Gaussian cases but they do follow the expected trends of increasing accuracy with an increasing buffer size. In the small sample case (N =25) without contamination, the projection statistics tend to over predict the ratio of contamination.
5.2.4
Computational Costs
Based on the results shown in the previous section, the Huber–based filtering methods show a clear advantage over traditional Kalman filter methods when applied to contaminated Gaussian measurement distributions. In the Gaussian case, the Huber–based methods do not suffer appreciably from any kind of mistuning associated with incorrect assumptions regarding the true underlying statistics of the problem. This section compares the computational costs associated with the Huber–based approaches compared with the Kalman filtering techniques. Table 5.5 shows the computational costs for each filter discussed in this dissertation. Here, the computational time is divided by that corresponding to the standard Kalman filter in order to provide a relative comparison of the
5.3. ATTITUDE FILTERING USING MODIFIED RODRIGUES PARAMETERS
Table 5.5: Relative Computation Ratios Filter Nonadaptive N =25 Kalman Filter 1.00 – Adaptive Kalman Filter – 1.13 Huber Filter 1.33 – Adaptive Huber Filter (Mahalanobis Distances) – 1.75 Adaptive Huber Filter (Projection Statistics) – 2.86
N = 50 – 1.16 – 1.89 4.29
88
N = 100 – 1.24 – 2.15 7.18
computational burden associated with the particular filter. For this problem, the adaptive Kalman filter and the Huber filter are comparable in computational cost relative to the standard Kalman filter. The adaptive Huber filters proposed in this dissertation require more computation, well beyond that of the adaptive Kalman filter or the nonadaptive Huber filter as can be seen from Table 5.3. As expected, the computation associated with the adaptive filters is reduced as the buffer size reduced. Note that the computational cost of the filter based on the projection statistics is reduced at a higher rate than the filter based on the Mahalanobis distances. The adaptive Huber filter based on the projection statistics has good properties when applied to contaminated Gaussian distributions, however, one must trade off the computational costs to determine the feasibility of implementing the technique for any particular application.
5.3
Attitude Filtering Using Modified Rodrigues Parameters
This section describes an example problem that illustrates the MRP–based estimation techniques using the shadow set transformation for singularity avoidance. In this problem, consider a spacecraft rotating with an angular velocity of 1 deg/s about the body z-axis over a period of 1000 s. The simulation parameters are shown in Table 5.6. The true principal rotation angle and true MRP time history are shown in Fig. 5.14. Note that there are several shadow set transformations apparent in Fig. 5.14(b) in order to keep the MRP value within the unit sphere. The results of a 2000 case Monte-Carlo simulation are shown Fig. 5.15. Figure 5.15(a) shows the root mean square (RMS) total attitude angle error and Fig. 5.15(b) shows RMS of the norm of the gyroscope bias estimate error. The Monte-Carlo simulations involve five filtering techniques: a standard Quaternion Multiplicative Extended Kalman Filter (QM-EKF),87 a Quaternion Constrained Extended Kalman Filter (QC-EKF),90 an extended Kalman filter based on the MRP formulation discussed in this dissertation (MRP-EKF), and first and second–order divided difference filters using the MRP formulation (MRP-DD1 and MRP-DD2, respectively). In these plots, the RMS errors of the filters are shown in the solid curves while the predicted RMS error based on the filter covariance matrix are shown in the dashed curves. In this case, the QM–EKF and the MRP–EKF exhibit nearly the same overall performance. This result is not a surprise because both filters involve similar first–order approximations of the state dynamics and measurement noise. However, it can be seen in the detailed plot over the first 50 s of the simulation, Fig. 5.15(c) and (d), that the MRP–EKF converges faster than the QM–EKF to the steady state error level. This enhanced convergence rate is due to the fact that the MRP formulation does not require a linearization in
5.3. ATTITUDE FILTERING USING MODIFIED RODRIGUES PARAMETERS
1
16
0.8
14
0.6
12
0.4
True MRPs [rad]
Principal Rotation Angle [rad]
18
10 8 6 4 2 0 0
89
0.2 0 −0.2 −0.4
σ1
−0.6
σ2
−0.8
200
400
600
800
Time [s]
(a) True Principal Rotation Angle
1000
−1 0
σ
3
200
400
600
800
1000
Time [s]
(b) True MRPs
Figure 5.14: True Principal Rotation Angle and MRPs Table 5.6: Simulation Parameters Variable Value Gyroscope Sample Rate 10 Hz MRP Sample Rate 1 Hz σω2 10−13 rad2 /s σβ2 10−15 rad2 /s3 2 σs 7.16·10−5 rad2 ¡£ ¤¢ ˆ σσ P diag 0.0122 0.0122 0.0122 rad2 0 ¡£ ¤¢ ˆ ββ P diag 2.35 2.35 2.35 · 10−9 rad2 /s2 0 ˆ σβ P 0 rad2 /s 0 £ ¤T σ0 rad 0 0 0 £ ¤T β0 rad/s 0 0 0
order to enforce the quaternion norm constraint. Similarly, the QC–EKF converges to the steady state error faster then the QM–EKF over all, though its initial convergence rate is slower. The MRP–DD1 filter does not meet the same level of performance as that of the MRP–EKF case. This result is not particularly bothersome since the DD1 filter performance is usually worse than that of the EKF as seen in Refs. 79, 80 and 134. The MRP–DD2 filter exhibits the best performance overall, which is to be expected since it is a second–order filter and as a result can better capture the system nonlinearities. The uncertainty predictions based on the covariance matrix do not match the actual RMS for any of the filter results. The uncertainties can be tuned to better match the actual performance either offline or by using an adaptive approach to estimate the process noise covariance.66 As discussed in earlier sections, the MRP switching condition can occur for any value of σr ≥ 1. Figure 5.16 shows the estimator performance for values of σr ranging from 1 to 1000. The results are
5.3. ATTITUDE FILTERING USING MODIFIED RODRIGUES PARAMETERS
2
0
10
−1
10
−2
3
10
2
10
1
10
0
10
10
−3
10
QM−EKF RMS Error QM−EKF RMS Prediction QC−EKF RMS Error QC−EKF RMS Prediction MRP−EKF RMS Error MRP−EKF RMS Prediction MRP−DD1 RMS Error MRP−DD1 RMS Prediction MRP−DD2 RMS Error MRP−DD2 RMS Prediction
10
Gyro Bias Error [deg/hr]
1
10 Attitude Error [deg]
4
QM−EKF RMS Error QM−EKF RMS Prediction QC−EKF RMS Error QC−EKF RMS Prediction MRP−EKF RMS Error MRP−EKF RMS Prediction MRP−DD1 RMS Error MRP−DD1 RMS Prediction MRP−DD2 RMS Error MRP−DD2 RMS Prediction
10
−1
0
200
400
600
800
10
1000
0
200
400
Time [s]
1
10
0
10
1000
−1
10
QM−EKF RMS Error QM−EKF RMS Prediction QC−EKF RMS Error QC−EKF RMS Prediction MRP−EKF RMS Error MRP−EKF RMS Prediction MRP−DD1 RMS Error MRP−DD1 RMS Prediction MRP−DD2 RMS Error MRP−DD2 RMS Prediction
4
10 Gyro Bias Error [deg/hr]
Attitude Error [deg]
10
800
(b) Gyroscope Bias Estimation Error
QM−EKF RMS Error QM−EKF RMS Prediction QC−EKF RMS Error QC−EKF RMS Prediction MRP−EKF RMS Error MRP−EKF RMS Prediction MRP−DD1 RMS Error MRP−DD1 RMS Prediction MRP−DD2 RMS Error MRP−DD2 RMS Prediction
2
600 Time [s]
(a) Attitude Angle Estimation Error
3
10
2
10
1
10
0
−2
10
10
−3
10
90
−1
0
10
20
30
40
Time [s]
(c) Attitude Angle Estimation Error (Detail)
50
10
0
10
20
30
40
50
Time [s]
(d) Gyroscope Bias Estimation Error (Detail)
Figure 5.15: Comparison of MRP-based filters and Quaternion–based filter shown only for the EKF formulation of the MRP attitude filter. Clearly the estimator performance degrades as the switching surface grows in magnitude, and it can be inferred from the results that the limiting case σr → ∞ leads to infinite estimation error since the MRP is reaching the neighborhood of the singularity. Similar trends occur for the DD1 and DD2 formulations. Based on these results there does not seem to be any benefit for using a MRP switching surface greater than the unit sphere but for some particular applications it may be preferable to do so. Having a general MRP covariance switching solution, however, also use to switch at any time where kσk > 1. It is not required to intercept the kσk = 1 surface precisely, making the numerical implementation far easier. Previous applications of the MRP singularity avoidance based on the shadow set transformation have neglected the covariance mapping associated with the transformation. Fig. 5.17 shows a comparison of the MRP–based EKF with and without the covariance transformation to illustrate the issues associated with neglecting the transformation. At the first switching point a sharp bend
5.3. ATTITUDE FILTERING USING MODIFIED RODRIGUES PARAMETERS
2
4
10
10
σ = 1000
σ = 1000
r
r
σ = 100
σ = 100
r
r
3
σr = 10
σr = 10
10 Gyro Bias Error [deg/hr]
1
10 Attitude Error [deg]
91
σr = 2 σr = 1
0
10
−1
10
σr = 2 σr = 1
2
10
1
10
0
10
−2
10
0
−1
200
400
600
800
10
1000
0
200
400
Time [s]
600
800
1000
Time [s]
(a) Attitude Angle Estimation Error
(b) Gyroscope Bias Estimation Error
Figure 5.16: Comparison of MRP-based filter with varying σr 1
3
10
Attitude Error [deg]
MRP−EKF RMS Error (Without Mapping) MRP−EKF RMS Prediction (Without Mapping) MRP−EKF RMS Error (With Mapping) MRP−EKF RMS Prediction (With Mapping) 0
10
−1
10
−2
10
0
Gyro Bias Error [deg/hr]
10
MRP−EKF RMS Error (Without Mapping) MRP−EKF RMS Prediction (Without Mapping) MRP−EKF RMS Error (With Mapping) MRP−EKF RMS Prediction (With Mapping)
2
10
1
10
0
10
−1
200
400
600
800
Time [s]
(a) Attitude Angle Estimation Error
1000
10
0
200
400
600
800
1000
Time [s]
(b) Gyroscope Bias Estimation Error
Figure 5.17: Comparison of MRP-based filter with and without the covariance transformation can clearly be seen in the case without the covariance transformation after which the estimator performance is degraded relative to the case that includes the proper covariance transformation. This bend is due to the fact that elements of the covariance matrix must change sign during the shadow mapping since the MRP state representation changes sign during the mapping. Therefore the estimates that neglect the covariance transformation develop systematic error and are no longer optimal. The results are shown only for the EKF–based filter, similar behavior is found for the DD1 and DD2 filters. Table 5.7 shows a comparison of the computational costs of each filter applied to this problem. The mean computation time is calculated for each Monte-Carlo set and then divided by the QM–EKF time to provide a relative cost comparison ratio. Also the standard deviation of the com-
5.4. RENDEZVOUS NAVIGATION IN ELLIPTICAL ORBIT
92
Table 5.7: Computational Cost Filter Mean Computation Time Standard Deviation QM–EKF 1.000 0.015 QC–EKF 1.089 0.029 MRP–EKF 0.977 0.024 MRP–DD1 10.795 0.316 MRP–DD2 11.062 0.274
putation times are provided to show the confidence intervals. The MRP–based EKF formulation described in this dissertation requires slightly less computation on average than the quaternion– based EKF. These cost savings are consistent with the results of Ref. 152, which found a reduced computation using the Rodrigues parameters for attitude estimation compared with the quaternion filter. The DD1 and DD2 filters require roughly the same computational cost which is consistent with Ref. 134. In this case the divided difference filters are each about an order of magnitude more expensive than the EKF.
5.4 5.4.1
Rendezvous Navigation in Elliptical Orbit Overview and Simulation Setup
This section described the application of the robust/adaptive filtering algorithms to the problem of 6-DOF rendezvous navigation and control in elliptical orbit. Here, the navigation filters are used “real–time” inside the control loop as state observers. The previous examples have considered only open loop estimation problems where the state estimator does not interact with the dynamics of the problem. The specific example discussed in this section involves terminal rendezvous maneuver in a 15km by 75km altitude lunar orbit. This orbit is typical of intermediate phasing orbit during ascent from the lunar surface. Hypothetically, the lunar ascent vehicle could have failed, leaving it stranded in such an orbit. Therefore, a CEV/Orion-like vehicle must maneuver from a circular parking orbit, typically 100km altitude, to rendezvous with the lunar ascent vehicle. This problem assumes that the midcourse maneuvering and phasing has already been accomplished such that the initial conditions of the maneuvering vehicle are 1km behind the target vehicle in the in-track direction. The rendezvous trajectory begins with a constant closure rate from 1km to 100m over a duration of half an orbital period (in this problem, one orbital period is approximately 113 minutes). At this point, the vehicle is commanded to execute a circumnavigation of the target vehicle at a constant range of 100m over one orbital period. Finally, the vehicle executes a glideslope maneuver using a Space Shuttle–based exponentially decaying range rate guidance scheme170 with decay rate of 0.2% over a time span of half an orbital period. These guidance commands are shown in Fig. 5.18. Attitude commands are generated as discussed in Sec. 4.6.2, in which commands are given such that the vehicle remains pointed at the target throughout the maneuver. In a nominal scenario with no out of plane motion, the attitude commands are purely in the pitch plane, resulting in MRP and MRP-rate commands shown in Fig. 5.19. Note that the MRPs are used exclusively
5.4. RENDEZVOUS NAVIGATION IN ELLIPTICAL ORBIT
93
for the attitude representation in this problem, making use of the singularity avoidance methods discussed in Sec. 4.3.1.3 for globally non-singular attitude estimation. The guidance commands are generated at a rate of 4 Hz. The control laws and navigation filter update rates are at 4 Hz. The inertial navigation sensors operate at 20 Hz. The controller gains are computed according to the H∞ development discussed in Sec. 4.6. The translational gains are computed using the state ¡ ¢ error weighting matrix C t = 103 I and the rotational gains are computed using C r = I, with kv = 1 s−2 . In both cases, the H∞ performance bound is set to κ = 5. Control force and torque limits were set to 1779.2 N and and 5337.6 Nm, respectively. The nominal vehicle mass properties correspond to a total mass of 1.1·105 kg with inertia tensor given by 2.9441 0.0368 0.3680 I = 104 · 0.0368 3.6801 0.0074 kg · m2 (5.11) 0.3680 0.0074 3.6801 Monte-Carlo simulations have been conducted for this problem for several different navigation filters. In particular, the extended Kalman filter and first and second order divided difference filters, including Huber implementations, Myers–Tapley adaptive implementations, and combined Huber–Myers–Tapley adaptive filtering methods. Results are shown in the following subsections for both Gaussian and non-Gaussian cases.
5.4.2
Gaussian Simulation
Rendezvous simulation conducted with pure Gaussian errors are described in this section. The initial conditions of the maneuvering vehicle are at the time of perilune passage of the target vehicle and are provided in Table 5.8. Table 5.8 shows the true value of the initial conditions, the estimate of the initial conditions for filter initialization, and the components of the initial variance matrix for filter initialization. The initial state errors are uncorrelated in this simulation. The vehicle mass properties are dispersed by multiplying the total mass by a Gaussian random variable with standard deviation of 0.5% and a inertia tensor uncertainty by the mass multiplier coupled with a uncorrelated random axis uncertainty with 0.5 deg standard deviation in yaw-pitch-roll Euler angles. The navigation sensor uncertainties are summarized in Table 5.9, which shows the measurement standard deviations for the gyro parameters (η ω and η β ), the accelerometer errors (η a and S), the rendezvous lidar sensor errors (%, α, ε, and δσ), the star tracker errors (δσ I ) and the orbit sensor errors (r0 and θ0 ). For this simulation, the errors are cast as uncorrelated Gaussian random numbers with standard deviations given in Table 5.9. The filter measurement noise and process noise matrices are set according to the sensor errors in Table 5.9 without error in the assumed values. In this simulation, the accelerometer scale factor errors are not modeled in the filter formulation as state variables in order to provide a mismatch between the true measurements and the modeled measurements in the filter. Figures 5.20–5.22 show the results of 100 Monte-Carlo cases involving Gaussian errors. In these cases, the navigation system is operating in pure-inertial mode, in which no measurement data are processing in the navigation filter to improve accuracy and reduce the drift inherent in inertial navigation systems. Figure 5.20 shows the position and velocity RMS error, Fig. 5.21 shows the attitude and gyro bias RMS errors, and Fig. (5.22) shows the orbital position and velocity RMS
5.4. RENDEZVOUS NAVIGATION IN ELLIPTICAL ORBIT
Table 5.8: Initial Conditions Initial State Mean Standard Deviation ρ(0), km 1.0 0.005 θ(0), deg 180.0 0.25 φ(0), deg 0.0 0.25 ρ(0), ˙ m/sec -0.266 0.05 ˙ θ(0), deg/sec 0.0 0.003 ˙ φ(0), deg/sec 0.0 0.003 σ1 , rad 0.0 0.0175 σ2 , rad 0.0 0.0175 σ3 , rad 0.0 0.0175 β1 , deg/hr 0.0 1.0 β2 , deg/hr 0.0 1.0 β3 , deg/hr 0.0 1.0 r0 , km 1753.1 0.01 θ0 , deg 0.0 0.001 r˙0 , m/s 0.0 1.0 · 10−5 θ˙0 , deg/s 9.619 · 10−5 1.0 · 10−5
Table 5.9: Sensor Specifications Measurement Standard Deviation η ω , deg/s 1.8 · 10−5 I η β , deg/s2 1.8 · 10−8 I 2 η a , m/s 0.1 I S, ppm 500 %, m 0.1 α, deg 0.05 ε, deg 0.05 δσ, deg 0.05 I δσ I , deg 0.05 I r0 , m 0.1 θ0 , deg 3.3 · 10−5
94
5.4. RENDEZVOUS NAVIGATION IN ELLIPTICAL ORBIT
95
errors. These figures clearly indicate that the rendezvous maneuver cannot be accomplished without processing measurement data in the filter due to the large buildup of error in the navigation solution. Figures 5.23–5.28 show the RMS error results of the Gaussian simulation involving the use of several navigation filters for processing measurement data to aid the pure inertial solution. Results are shown from the first and second order divided difference filters (DD1 and DD2), including Huber implementations (H-DD1 and H-DD2), Myers–Tapley adaptive implementations (A-DD1 and A-DD2), and combined Huber–Myers–Tapley adaptive filtering methods (AH-DD1 and AHDD2). The adaptive filters use a buffer size of 500 samples in the procedures to estimate the measurement and process noise covariances. Results from the Extended Kalman Filter approaches are essentially identical to the first–order divided difference filtering approaches, both being firstorder filters, and therefore are omitted from the RMS error plots in an effort to keep the results clear. In Figures 5.23–5.28, the DD1 results are shown with the blue curve, the DD1 results with the red curve, the H-DD1 results in cyan, the H-DD2 results in magenta, the A-DD1 results in green, and A-DD2 results in yellow, the AH-DD1 results in the solid black curve, and the AH-DD2 results in the dashed black curve. Figure 5.23 shows the position RMS error results. The left column shows the actual RMS error plots for the position variables ρ, θ, and φ while the right column shows the predicted RMS errors based on the filter covariance matrix. Although the differences between the performance various filters in this case is small, it is possible to discern a slightly better performance in the Gaussianbased filters such as the DD1 and DD2. Note in this simulation that the measurement and process noise cases were initialized without error. Therefore, the adaptive filters do not perform as well as the non-adaptive filters since their measurement and process noise covariances are not exact estimates due to the finite sample sizes used in the buffering technique. The predicted RMS error results show the trend that the adaptive Gaussian filters (A-DD1 and A-DD2) exhibit the smallest error prediction. This trend is due to the adaptive tuning of the filter in real time, which has the effect of reducing the state covariance matrix. This reduction is erroneous however, since the actual RMS error results are higher due to the introduction of error into the measurement and process noise covariances. The Huber–based filters (H-DD1 and H-DD2) correctly predict that the RMS error should be higher than the other filters. The adaptive Huber filters (AH-DD1 and AH-DD2) have a slightly lower RMS error prediction than the non-adaptive Huber filters due to the adaptive tuning. ˙ and φ˙ is The actual RMS error and predicted RMS error results for the velocity variables ρ, ˙ θ, shown in Fig. 5.24. As in the position plots, the actual RMS error from the Monte-Carlo simulation is shown on the left column and the predicted RMS error is shown in the right column. As expected, the velocity performance trends between the various filters matches with the position performance trends. The MRP attitude RMS errors are shown in Fig. 5.25. As in the previous results, the differences between the various filters is small yet it can be seen that the Gaussian filters perform slightly better than their non–Gaussian counterparts. In particular the adaptive filters tend to under predict the accuracy of the attitude solution. The adaptive DD1 filters exhibit the lowest RMS predictions, which is consistent with recent analytical results that conclude that the DD1 filter can produce overly optimistic covariance estimates.171 The MRP shadow set switching point for the singularity avoidance can be seen in the RMS error prediction plots at the time of approximately 1.9 hrs. The rate bias estimate RMS errors are shown in Fig. 5.26. Expectedly, the rate bias RMS trends follow
5.4. RENDEZVOUS NAVIGATION IN ELLIPTICAL ORBIT
96
the MRP attitude RMS error trends. The RMS errors of the reference orbit position estimates are shown in Fig. 5.27, and those for the orbit velocity estimates are shown in Fig. 5.28. These results follow similar trends observed in the relative position, velocity, and attitude estimates. Figure 5.29 shows a comparison of results for the adaptive filters investigated in this study. Figure 5.29(a) shows the RMS estimation error of the (1,1) component of the measurement noise covariance matrix, which corresponds to the range measurement from the lidar sensor. Here, the ADD2 exhibits the best performance, which is expected since the errors are purely Gaussian and since the DD2 filter has the benefits of capturing second–order terms in the state covariance estimates. The Huber–based estimates exhibit higher errors due to the reduced statistical efficiency of the projection statistics algorithm for purely Gaussian errors. Similarly, the RMS error of the (5,5) component of the measurement noise covariance matrix is shown in Fig. 5.29(b). This element corresponds to an inertial star tracker MRP measurement. The A-DD1 and A-DD2 estimates of this parameter are nearly identical, with both estimates being superior to the Huber–based estimates. Figure 5.29(c) shows the (1,1) component of the process noise covariance estimate. In this case differences between the various adaptive filters is not as obvious, thought the A-DD2 filter shows slightly better performance than the others. Figure 5.29(d) shows the results of estimating the contamination parameter in the Huber–based adaptive filters. Here, both filters AH-DD1 and AH-DD2 are able to reduce the error in the assumed contamination parameter. Finally, the closed-loop system performance results are shown in Fig. 5.30. These plots show the true position and attitude RMS error results in the left and right columns, respectively. The relative performance of the system is not significantly different between the various filters, although Gaussian filters DD1 and DD2 show slight improvement. This result is expected since the errors are purely Gaussian and the filters have perfect knowledge of the measurement and process noise covariance matrices. To summarize the results of the Gaussian simulation, the overall trends follow the expectation that the Gaussian DD1 and DD2 filters should have the best overall performance since the errors in the simulation are purely Gaussian and these filters have perfect knowledge of the measurement and process noise covariance matrices. However, the differences between the various filters is fairly small, implying that for the benign Gaussian case the navigation filters are almost identical in overall performance.
5.4. RENDEZVOUS NAVIGATION IN ELLIPTICAL ORBIT
97
600 550
1 500 450 θc [deg]
ρ [km]
0.8
c
0.6
400 350 300
0.4
250 200
0.2
150
0 0
0.5
1
1.5 2 Time [h]
2.5
100 0
3
0.5
1
1.5 2 Time [h]
(a) ρc
2.5
3
2.5
3
2.5
3
(b) θc
0.05
0.1
0
(d/dt) θc [deg/s]
(d/dt) ρc [m/s]
−0.05 −0.1 −0.15
0.05
0
−0.2 −0.25
0
0.5
1
1.5 2 Time [h]
2.5
−0.05 0
3
0.5
1
(d) θ˙c 0.01
20
0.008
15
0.006
10
0.004
(d2/dt2) θc [deg/s2]
25
5 0
2
2
2
(d /dt ) ρc [mm/s ]
(c) ρ˙ c
−5 −10
0.002 0 −0.002 −0.004 −0.006
−15 −20 0
1.5 2 Time [h]
−0.008
0.5
1
1.5 2 Time [h]
(e) ρ¨c
2.5
3
−0.01 0
0.5
1
1.5 2 Time [h]
(f) θ¨c
Figure 5.18: Translational Guidance Commands
5.4. RENDEZVOUS NAVIGATION IN ELLIPTICAL ORBIT
98
−4
5
1
x 10
0.8
4 0.6
(d/dt) σ2 [rad/s]
c
0.2
c
σ2 [rad]
0.4
0 −0.2
3
2
1
−0.4 −0.6
0
−0.8 −1 0
0.5
1
1.5 2 Time [h]
(a) σ2c
2.5
3
−1 0
0.5
1
1.5 2 Time [h]
(b) σ˙ 2c
Figure 5.19: Attitude Guidance Commands
2.5
3
5.4. RENDEZVOUS NAVIGATION IN ELLIPTICAL ORBIT
2
8
1.8
7
1.6 (d/dt) ρ RMS Error [m/s]
ρ RMS Error [km]
9
99
6 5 4 3 2
1.4 1.2 1 0.8 0.6 0.4
1
0.2
0 0
0.5
1
1.5 Time [h]
2
2.5
0 0
3
0.5
(a) ρ RMS Error
1
1.5 Time [h]
2
2.5
3
2
2.5
3
2
2.5
3
(b) ρ˙ RMSError
150
0.18
(d/dt) θ RMS Error [deg/s]
θ RMS Error [deg]
0.16
100
50
0.14 0.12 0.1 0.08 0.06 0.04 0.02
0 0
0.5
1
1.5 Time [h]
2
2.5
0 0
3
0.5
1
1.5 Time [h]
(d) θ˙ RMS Error
(c) θ RMS Error 30 0.045 0.04 (d/dt) φ RMS Error [deg/s]
φ RMS Error [deg]
25
20
15
10
0.035 0.03 0.025 0.02 0.015 0.01
5 0.005
0 0
0.5
1
1.5 Time [h]
(e) φ RMS Error
2
2.5
3
0 0
0.5
1
1.5 Time [h]
(f) φ˙ RMS Error
Figure 5.20: Pure Inertial Navigation Results: Position and Velocity
5.4. RENDEZVOUS NAVIGATION IN ELLIPTICAL ORBIT
100
−3
5.37
0.028
x 10
0.026 5.365 β1 RMS Error [mrad/s]
σ1 RMS Error [rad]
0.024 0.022 0.02 0.018 0.016
5.36
5.355
5.35 0.014 0.012 0
0.5
1
1.5 Time [h]
2
2.5
5.345 0
3
0.5
(a) σ1 RMS Error
1
1.5 Time [h]
2
2.5
3
2
2.5
3
2
2.5
3
(b) β1 RMS Error −3
0.036
6.9
x 10
6.895 0.034 β2 RMS Error [mrad/s]
σ2 RMS Error [rad]
6.89 0.032 0.03 0.028 0.026
6.885 6.88 6.875 6.87 6.865 6.86
0.024 6.855 0.022 0
0.5
1
1.5 Time [h]
2
2.5
3
0
0.5
(c) σ2 RMS Error
1
1.5 Time [h]
(d) β2 RMS Error −3
0.028
6
x 10
0.026 β3 RMS Error [mrad/s]
σ3 RMS Error [rad]
5.995 0.024 0.022 0.02 0.018
5.99
5.985
5.98 0.016 0.014 0
0.5
1
1.5 Time [h]
(e) σ3 RMS Error
2
2.5
3
5.975 0
0.5
1
1.5 Time [h]
(f) β3 RMS Error
Figure 5.21: Pure Inertial Navigation Results: Attitude and Rate Bias
0.7
1.2
0.6 (d/dt) r RMS Error [m/s]
1.4
1 0.8
0
0.6
0
r RMS Error [km]
5.4. RENDEZVOUS NAVIGATION IN ELLIPTICAL ORBIT
0.4 0.2
101
0.5 0.4 0.3 0.2 0.1
0 0
0.5
1
1.5 Time [h]
2
2.5
0 0
3
0.5
(a) r0 RMS Error
1
1.5 Time [h]
2
2.5
3
2
2.5
3
(b) r˙0 RMS Error −5
7
x 10
0.4
6 (d/dt) θ0 RMS Error [deg/s]
0.35
θ0 RMS Error [deg]
0.3 0.25 0.2 0.15 0.1
4 3 2 1
0.05 0 0
5
0.5
1
1.5 Time [h]
(c) θ0 RMS Error
2
2.5
3
0 0
0.5
1
1.5 Time [h]
(d) θ˙0 RMS Error
Figure 5.22: Pure Inertial Navigation Results: Orbit
5.4. RENDEZVOUS NAVIGATION IN ELLIPTICAL ORBIT
10
10
ρ RMS Error [cm]
8 7 6 5 4 3 2
9 ρ 1−σ Error Prediction [cm]
DD1 DD2 H−DD1 H−DD2 A−DD1 A−DD2 AH−DD1 AH−DD2
9
8 7 6 5 4 3 2 1
1 0 0
0.5
1
1.5 Time [h]
2
2.5
0 0
3
0.5
0.05
0.05
0.045
0.045
0.04
0.04
0.035 0.03 0.025 0.02 0.015 0.01 0.005 0 0
1.5 Time [h]
2
2.5
3
2.5
3
2.5
3
0.035 0.03 0.025 0.02 0.015 0.01 0.005
0.5
1
1.5 Time [h]
2
2.5
0 0
3
(c) θ RMS Error
0.5
1
1.5 Time [h]
2
(d) θ RMS Error Prediction 0.05
0.045
0.045
0.04
0.04
φ 1−σ Error Prediction [deg]
0.05
0.035 0.03 0.025 0.02 0.015 0.01 0.005 0 0
1
(b) ρ RMS Error Prediction
θ 1−σ Error Prediction [deg]
θ RMS Error [deg]
(a) ρ RMS Error
φ RMS Error [deg]
102
0.035 0.03 0.025 0.02 0.015 0.01 0.005
0.5
1
1.5 Time [h]
(e) φ RMS Error
2
2.5
3
0 0
0.5
1
1.5 Time [h]
2
(f) φ RMS Error Prediction
Figure 5.23: Gaussian Simulation Results: Position
20
20
18
18
(d/dt) ρ 1−σ Error Prediction [mm/s]
(d/dt) ρ RMS Error [mm/s]
5.4. RENDEZVOUS NAVIGATION IN ELLIPTICAL ORBIT
16 14 12 10 8 6 4 2 0 0
16 14 12 10
6 4 2
0.5
1
1.5 Time [h]
2
2.5
0 0
3
45
45
(d/dt) θ 1−σ Error Prediction [mdeg/s]
(d/dt) θ RMS Error [mdeg/s]
50
40 35 30 25 20 15 10 5 0.5
1
1.5 Time [h]
2
2.5
3
2.5
3
2.5
3
20 15 10 5 0 0
3
0.5
1
1.5 Time [h]
2
(d) θ˙ RMS Error Prediction
45
(d/dt) φ 1−σ Error Prediction [mdeg/s]
(d/dt) φ RMS Error [mdeg/s]
2.5
25
45 40 35 30 25 20 15 10 5
(e) φ˙ RMS Error
2
30
50
1.5 Time [h]
1.5 Time [h]
35
50
1
1
40
(c) θ˙ RMS Error
0.5
0.5
(b) ρ˙ RMS Error Prediction
50
0 0
DD1 DD2 H−DD1 H−DD2 A−DD1 A−DD2 AH−DD1 AH−DD2
8
(a) ρ˙ RMS Error
0 0
103
2
2.5
3
40 35 30 25 20 15 10 5 0 0
0.5
1
1.5 Time [h]
2
(f) φ˙ RMS Error Prediction
Figure 5.24: Gaussian Simulation Results: Velocity
5.4. RENDEZVOUS NAVIGATION IN ELLIPTICAL ORBIT
0.05
0.05
σ1 RMS Error [mrad]
0.04 0.035 0.03 0.025 0.02 0.015 0.01
0.045 σ1 1−σ Error Prediction [mrad]
DD1 DD2 H−DD1 H−DD2 A−DD1 A−DD2 AH−DD1 AH−DD2
0.045
0.04 0.035 0.03 0.025 0.02 0.015 0.01 0.005
0.005 0 0
0.5
1
1.5 Time [h]
2
2.5
0 0
3
(a) σ1 RMS Error
0.045
0.045 σ2 1−σ Error Prediction [mrad]
0.05
σ2 RMS Error [mrad]
0.04 0.035 0.03 0.025 0.02 0.015 0.01 0.005
1.5 Time [h]
2
2.5
3
2.5
3
2.5
3
0.04
0.03 0.025 0.02 0.015 0.01 0.005
0.5
1
1.5 Time [h]
2
2.5
0 0
3
0.5
1
1.5 Time [h]
2
(d) σ2 RMS Error Prediction 0.05
0.045
0.045 σ3 1−σ Error Prediction [mrad]
0.05
0.04 σ3 RMS Error [mrad]
1
0.035
(c) σ2 RMS Error
0.035 0.03 0.025 0.02 0.015 0.01 0.005 0 0
0.5
(b) σ1 RMS Error Prediction
0.05
0 0
104
0.04 0.035 0.03 0.025 0.02 0.015 0.01 0.005
0.5
1
1.5 Time [h]
(e) σ3 RMS Error
2
2.5
3
0 0
0.5
1
1.5 Time [h]
2
(f) σ3 RMS Error Prediction
Figure 5.25: Gaussian Simulation Results: Attitude
5.4. RENDEZVOUS NAVIGATION IN ELLIPTICAL ORBIT
0.1
0.1
1
β RMS Error [deg/hr]
0.08 0.07 0.06 0.05 0.04 0.03 0.02
0.09 β1 1−σ Error Prediction [deg/hr]
DD1 DD2 H−DD1 H−DD2 A−DD1 A−DD2 AH−DD1 AH−DD2
0.09
0.08 0.07 0.06 0.05 0.04 0.03 0.02 0.01
0.01 0 0
0.5
1
1.5 Time [h]
2
2.5
0 0
3
(a) β1 RMS Error
0.09
0.09 β2 1−σ Error Prediction[deg/hr]
0.1
β2 RMS Error [deg/hr]
0.08 0.07 0.06 0.05 0.04 0.03 0.02 0.01
1.5 Time [h]
2
2.5
3
2.5
3
2.5
3
0.07 0.06 0.05 0.04 0.03 0.02 0.01
0.5
1
1.5 Time [h]
2
2.5
0 0
3
0.5
1
1.5 Time [h]
2
(d) β2 RMS Error Prediction 0.1 0.09 β3 1−σ Error Prediction [deg/hr]
0.1 0.09 0.08 β3 RMS Error [deg/hr]
1
0.08
(c) β2 RMS Error
0.07 0.06 0.05 0.04 0.03 0.02 0.01 0 0
0.5
(b) β1 RMS Error Prediction
0.1
0 0
105
0.08 0.07 0.06 0.05 0.04 0.03 0.02 0.01
0.5
1
1.5 Time [h]
(e) β3 RMS Error
2
2.5
3
0 0
0.5
1
1.5 Time [h]
2
(f) β3 RMS Error Prediction
Figure 5.26: Gaussian Simulation Results: Rate Bias
5.4. RENDEZVOUS NAVIGATION IN ELLIPTICAL ORBIT
25 DD1 DD2 H−DD1 H−DD2 A−DD1 A−DD2 AH−DD1 AH−DD2
r0 RMS Error [cm]
20
15
10
5
0.5
1
1.5 Time [h]
2
2.5
r0 1−σ Error Prediction [cm]
25
0 0
20
15
10
5
0 0
3
(a) r0 RMS Error
9
9 θ0 1−σ Error Prediction [µ deg]
10
8
0
θ RMS Error [µ deg]
0.5
1
1.5 Time [h]
2
2.5
3
2.5
3
(b) r0 RMS Error Prediction
10
7 6 5 4 3 2 1 0 0
106
8 7 6 5 4 3 2 1
0.5
1
1.5 Time [h]
(c) θ0 RMS Error
2
2.5
3
0 0
0.5
1
1.5 Time [h]
2
(d) θ0 RMS Error Prediction
Figure 5.27: Gaussian Simulation Results: Orbit Position
5.4. RENDEZVOUS NAVIGATION IN ELLIPTICAL ORBIT
15 DD1 DD2 H−DD1 H−DD2 A−DD1 A−DD2 AH−DD1 AH−DD2
10
5
0 0
0.5
1
1.5 Time [h]
2
2.5
(d/dt) r0 1−σ Error Prediction [mm/s]
(d/dt) r0 RMS Error [mm/s]
15
10
5
0 0
3
(a) r˙0 RMS Error
1
1.5 Time [h]
2
2.5
3
2.5
3
ω0 1−σ Error Prediction [µ deg/s]
0.25
0.2
0.15
0.1
0.05
0 0
0.5
(b) r˙0 RMS Error Prediction
0.25
ω0 RMS Error [µ deg/s]
107
0.5
1
1.5 Time [h]
(c) θ˙0 RMS Error
2
2.5
3
0.2
0.15
0.1
0.05
0 0
0.5
1
1.5 Time [h]
2
(d) θ˙0 RMS Error Prediction
Figure 5.28: Gaussian Simulation Results: Orbit Velocity
5.4. RENDEZVOUS NAVIGATION IN ELLIPTICAL ORBIT
30
0.1 2
Rk(5,5) RMS Error [mrad ]
Rk(1,1) RMS Error [cm2]
0.12
A−DD1 A−DD2 AH−DD1 AH−DD2
25
108
20
15
10
5
0.08
0.06
0.04
0.02
0 0
0.5
1
1.5 Time [h]
2
2.5
0 0
3
0.5
(a) R11 RMS Error
1
1.5 Time [h]
2
2.5
3
2.5
3
(b) R55 RMS Error
−9
x 10
0.04 Contamination Parameter RMS Error
1.4
1 0.8 0.6 0.4
k
Q (1,1) RMS Error [cm2/sec]
1.2
0.2 0 0
0.5
1
1.5 Time [h]
2
(c) Q11 RMS Error
2.5
3
0.035 0.03 0.025 0.02 0.015 0.01 0.005 0 0
0.5
1
1.5 Time [h]
2
(d) eˆ RMS Error
Figure 5.29: Gaussian Simulation Results: Covariance and Contamination
5.4. RENDEZVOUS NAVIGATION IN ELLIPTICAL ORBIT
109
10 9 0.5 Tracking Error [mrad]
7 6 5 4
0.3
0.2
1
c
3
0.4
σ
ρc Tracking Error [cm]
8
DD1 DD2 H−DD1 H−DD2 A−DD1 A−DD2 AH−DD1 AH−DD2
2
0.1
1 0 0
0.5
1
1.5 Time [h]
2
2.5
0 0
3
0.5
(a) ρc RMS Error
1
1.5 Time [h]
2
2.5
3
2
2.5
3
2
2.5
3
(b) σ1c RMS Error
1 0.9 0.5 Tracking Error [mrad]
0.7 0.6 0.5 0.4
0.3
0.2
2
c
0.3
0.4
σ
θc Tracking Error [mrad]
0.8
0.2
0.1
0.1 0 0
0.5
1
1.5 Time [h]
2
2.5
0 0
3
0.5
(c) θc RMS Error
1
1.5 Time [h]
(d) σ2c RMS Error
1 0.9 0.5 Tracking Error [mrad]
0.7 0.6 0.5 0.4
0.3
0.2
3
c
0.3
0.4
σ
φc Tracking Error [mrad]
0.8
0.2
0.1
0.1 0 0
0.5
1
1.5 Time [h]
(e) φc RMS Error
2
2.5
3
0 0
0.5
1
1.5 Time [h]
(f) σ3c RMS Error
Figure 5.30: Gaussian Simulation Results: Closed–Loop System Performance
5.4. RENDEZVOUS NAVIGATION IN ELLIPTICAL ORBIT
5.4.3
110
Non-Gaussian Simulation
This section describes the results of Monte-Carlo simulations conducted for the same rendezvous scenario as described in the previous section, but with non-Gaussian noise components. In this case, the noise samples are drawn from a Gaussian mixture model with 15% contamination from the higher variance distribution. In an effort to stress the filters, the standard deviations of the primary Gaussian density of the mixture model were set to ten times the values provided in Table 5.9, with the contaminating densities an additional five times higher. Additionally, the true standard deviations are scaled according to a uniform distribution to be up to twice as high as the assumed standard deviations in the navigation filter, and uniform random correlation coefficients were assigned to the true errors on each run. The mean initial conditions of this simulation is the same as that given in Table 5.8, but the true random initial errors are generated according to a randomly correlated covariance matrix with standard deviations set to ten times the value in Table 5.8. The RMS errors of the position variables are shown in Fig. 5.31. As in the previous section, the actual RMS errors calculated from the Monte-Carlo simulation are shown in the left column whereas the mean predicted RMS errors based on the state covariance matrix are shown in the right column. In this non-Gaussian problem, the differences between the various filters becomes much more apparent. In particular the non-robust filters suffer greatly from the contamination present in this simulation. In the range variable ρ, the DD1 filters shows the worst overall performance, closely followed by the DD2 filter. Interestingly, the A-DD1 filters exhibits large errors over the first 0.5 hrs of the simulation before finally settling to the steady state error. The A-DD2 filter benefits from the inclusion of second-order terms in the system and measurement dynamics and as a result, does not exhibit the large initial errors. The A-DD2 shows similar performance to the the Huber-based filters, H-DD1 and H-DD2, which are nearly identical in this problem, with the differences between these two filters being comparable to the differences between the Gaussian DD1 and DD2 filters, though the RMS errors are smaller by roughly 25%. The best performing filters are the AH-DD1 and AH-DD2 filters, which are essentially identical in this variable. The predicted RMS errors show that the Gaussian filters DD1 and DD2 produce highly optimistic error estimates, having the smallest error predictions yet the largest actual RMS error. The non-adaptive Huber estimates, H-DD1 and H-DD2, correctly show slightly larger error estimates. The adaptive filter A-DD1 has large initial error estimates, which correctly reflect the large actual errors although the magnitudes are quite different, with the predicted error being much smaller in magnitude. The ADD2, AH-DD1, and AH-DD2 filters produce the most accurate error predictions in this particular variable. These same trends can be observed in the other position variables θ and φ, as shown in Fig. 5.31, as well as the velocity variables shown in Fig. 5.32. The MRP attitude RMS error components are shown in Fig. (5.33). Here the DD1 filter exhibits large attitude errors over the first hour of the simulation. The DD1 filter also has poor covariance performance in the sense that the actual attitude errors are large yet the predicted errors are the smallest of all the filters implemented for this example. The A-DD1 and A-DD2 filters also exhibit large errors but for the most part they are superior to the DD1 filter. The robust AH-DD2, AHDD1, H-DD2, and H-DD1 filters exhibit the best attitude estimation performance. The adaptive filters have higher covariance estimates which better match the actual filter performance. These same trends and relative performance comparisons are also evident in the rate bias estimation errors
5.4. RENDEZVOUS NAVIGATION IN ELLIPTICAL ORBIT
111
shown in Fig. (5.34). The reference orbit position estimates are shown in Fig. (5.35). Here the A-DD1 and DD1 filters exhibit the worst overall performance. The adaptive Huber–based filters AH-DD1 and AHDD2 filters perform the best. The nonadaptive Huber–based filters H-DD1 and H-DD2 have similar performance to the adaptive counterparts but with slightly higher errors. The H-DD2 and AH-DD2 filters reach their steady state errors much more rapidly than the other filters due to the inclusion of second–order terms in the filter. This behavior is even more apparent in the velocity components shown in Fig. (5.36). Results of the covariance and contamination estimation for the adaptive filters are shown in Fig. (5.37). The same covariance elements are chosen for comparison here as in the Gaussian simulation results shown in Fig. (5.29), namely the (1,1) and (5,5) element of the measurement covariance matrix, the (1,1) element of the process noise covariance matrix, and the contamination parameter estimate. The RMS errors in these plots indicate that the A-DD1 filter has relatively inaccurate covariance estimates over the first 0.5 hrs of simulation time for range measurement error and the range process noise. Once converged to its steady state error level the magnitudes remain higher than the A-DD2 filter, which is expected since the A-DD2 filter has the benefit of second-order terms in the process and measurement transformations. The AH-DD1 and AH-DD2 filters are nearly identical in performance with the AH-DD2 filter performing slightly better. The closed-loop system performance results are shown in Fig. (5.38). Here it can be seen that the DD1, DD2, A-DD1, and H-DD1 filter results have poor performance and essentially diverge in the presence of the non-Gaussian noise. The A-DD2 filter also gives erratic performance, which is more apparent in the attitude response. The H-DD2, AH-DD1, and AH-DD2 filters exhibit the best performance and are essentially able to successfully execute the rendezvous maneuver even in the presence of a high degree of non-Gaussian noise with uncertain statistics. This result is interesting since the H-DD2 filter is non-adaptive it is still better able to cope with the errors than the other filters investigated in this study.
5.4. RENDEZVOUS NAVIGATION IN ELLIPTICAL ORBIT
400
400
ρ RMS Error [cm]
300 250 200 150 100
350 ρ 1−σ Error Prediction [cm]
DD1 DD2 H−DD1 H−DD2 A−DD1 A−DD2 AH−DD1 AH−DD2
350
300 250 200 150 100 50
50 0 0
0.5
1
1.5 Time [h]
2
2.5
0 0
3
2
2
1.8
1.8
1.6
1.6
1.4 1.2 1 0.8 0.6 0.4 0.2
1.5 Time [h]
2
2.5
3
2.5
3
2.5
3
1.2 1 0.8 0.6 0.4 0.2
0.5
1
1.5 Time [h]
2
2.5
0 0
3
0.5
1
1.5 Time [h]
2
(d) θ RMS Error Prediction
2
2
1.8
1.8
1.6
1.6
φ 1−σ Error Prediction [deg]
φ RMS Error [deg]
1
1.4
(c) θ RMS Error
1.4 1.2 1 0.8 0.6 0.4 0.2 0 0
0.5
(b) ρ RMS Error Prediction
θ 1−σ Error Prediction [deg]
θ RMS Error [deg]
(a) ρ RMS Error
0 0
112
1.4 1.2 1 0.8 0.6 0.4 0.2
0.5
1
1.5 Time [h]
(e) φ RMS Error
2
2.5
3
0 0
0.5
1
1.5 Time [h]
2
(f) φ RMS Error Prediction
Figure 5.31: Non-Gaussian Simulation Results: Position
5.4. RENDEZVOUS NAVIGATION IN ELLIPTICAL ORBIT
50
45
45
(d/dt) ρ 1−σ Error Prediction [mm/s]
50
(d/dt) ρ RMS Error [cm/s]
40 35 30 25 20 15 10 5 0 0
DD1 DD2 H−DD1 H−DD2 A−DD1 A−DD2 AH−DD1 AH−DD2 0.5
40 35 30 25 20 15 10 5
1
1.5 Time [h]
2
2.5
0 0
3
1
1
0.9
0.9
0.8 0.7 0.6 0.5 0.4 0.3 0.2 0.1 0.5
1
1.5 Time [h]
2
2.5
2.5
3
2.5
3
0.3 0.2 0.1 0 0
3
0.5
1
1.5 Time [h]
2
(d) θ˙ RMS Error Prediction
(d/dt) φ 1−σ Error Prediction [mdeg/s]
(d/dt) φ RMS Error [mdeg/s]
3
0.4
0.9
0.8 0.7 0.6 0.5 0.4 0.3 0.2 0.1
(e) φ˙ RMS Error
2.5
0.5
0.9
1.5 Time [h]
2
0.6
1
1
1.5 Time [h]
0.7
1
0.5
1
0.8
(c) θ˙ RMS Error
0 0
0.5
(b) ρ˙ RMS Error Prediction
(d/dt) θ 1−σ Error Prediction [mdeg/s]
(d/dt) θ RMS Error [deg/s]
(a) ρ˙ RMS Error
0 0
113
2
2.5
3
0.8 0.7 0.6 0.5 0.4 0.3 0.2 0.1 0 0
0.5
1
1.5 Time [h]
2
(f) φ˙ RMS Error Prediction
Figure 5.32: Non-Gaussian Simulation Results: Velocity
5.4. RENDEZVOUS NAVIGATION IN ELLIPTICAL ORBIT
1.5
1
0.5
1
0.5
1
1
DD1 DD2 H−DD1 H−DD2 A−DD1 A−DD2 AH−DD1 AH−DD2
σ 1−σ Error Prediction [mrad]
1.5
σ RMS Error [mrad]
114
0 0
0.5
1
1.5 Time [h]
2
2.5
0 0
3
(a) σ1 RMS Error
1.5 Time [h]
2
2.5
3
2.5
3
2.5
3
1.5
σ 1−σ Error Prediction [mrad]
1
0.5
1
0.5
2
2
1
(b) σ1 RMS Error Prediction
1.5
σ RMS Error [mrad]
0.5
0 0
0.5
1
1.5 Time [h]
2
2.5
0 0
3
(c) σ2 RMS Error
1.5 Time [h]
2
1.5
σ 1−σ Error Prediction [mrad]
1
0.5
1
0.5
3
3
1
(d) σ2 RMS Error Prediction
1.5
σ RMS Error [mrad]
0.5
0 0
0.5
1
1.5 Time [h]
(e) σ3 RMS Error
2
2.5
3
0 0
0.5
1
1.5 Time [h]
2
(f) σ3 RMS Error Prediction
Figure 5.33: Non-Gaussian Simulation Results: Attitude
5.4. RENDEZVOUS NAVIGATION IN ELLIPTICAL ORBIT
5
5
1
β RMS Error [deg/hr]
4 3.5 3 2.5 2 1.5
1
1
4.5 β 1−σ Error Prediction [deg/hr]
DD1 DD2 H−DD1 H−DD2 A−DD1 A−DD2 AH−DD1 AH−DD2
4.5
4 3.5 3 2.5 2 1.5 1 0.5
0.5 0 0
0.5
1
1.5 Time [h]
2
2.5
0 0
3
(a) β1 RMS Error
4.5
4.5 β 1−σ Error Prediction[deg/hr]
5
2
β RMS Error [deg/hr]
4 3.5 3 2.5 2 1.5
2
1 0.5 0.5
1
1.5 Time [h]
2
2.5
2
2.5
3
2.5
3
2.5
3
3.5 3 2.5 2 1.5 1
0 0
3
0.5
1
1.5 Time [h]
2
(d) β2 RMS Error Prediction
5
5
4.5
4.5 β 1−σ Error Prediction [deg/hr]
3.5 3 2.5 2 1.5 1
3
3
1.5 Time [h]
0.5
4 β RMS Error [deg/hr]
1
4
(c) β2 RMS Error
0.5 0 0
0.5
(b) β1 RMS Error Prediction
5
0 0
115
4 3.5 3 2.5 2 1.5 1 0.5
0.5
1
1.5 Time [h]
(e) β3 RMS Error
2
2.5
3
0 0
0.5
1
1.5 Time [h]
2
(f) β3 RMS Error Prediction
Figure 5.34: Non-Gaussian Simulation Results: Rate Bias
20
4.5
18
4
16
r0 1−σ Error Prediction [m]
5
3.5 3 2.5 2
0
r RMS Error [m]
5.4. RENDEZVOUS NAVIGATION IN ELLIPTICAL ORBIT
1.5
12 10 8 6 4
0.5
2 0.5
1
1.5 Time [h]
2
2.5
DD1 DD2 H−DD1 H−DD2 A−DD1 A−DD2 AH−DD1 AH−DD2
14
1
0 0
0 0
3
(a) r0 RMS Error
0.45
0.45 θ0 1−σ Error Prediction [mdeg]
0.5
0.4 θ0 RMS Error [mdeg]
0.5
1
1.5 Time [h]
2
2.5
3
2.5
3
(b) r0 RMS Error Prediction
0.5
0.35 0.3 0.25 0.2 0.15 0.1 0.05 0 0
116
0.4 0.35 0.3 0.25 0.2 0.15 0.1 0.05
0.5
1
1.5 Time [h]
(c) θ0 RMS Error
2
2.5
3
0 0
0.5
1
1.5 Time [h]
2
(d) θ0 RMS Error Prediction
Figure 5.35: Non-Gaussian Simulation Results: Orbit Position
5.4. RENDEZVOUS NAVIGATION IN ELLIPTICAL ORBIT
10
10
(d/dt) r0 RMS Error [cm/s]
8 7 6
(d/dt) r0 1−σ Error Prediction [cm/s]
DD1 DD2 H−DD1 H−DD2 A−DD1 A−DD2 AH−DD1 AH−DD2
9
5 4 3 2
9 8 7 6 5 4 3 2 1
1 0 0
0.5
1
1.5 Time [h]
2
2.5
0 0
3
(a) r˙0 RMS Error
1.8
1.8 ω 1−σ Error Prediction [µ deg/s]
2
1.6 1.4 1.2 1 0.8 0.6 0.4
0
0
ω RMS Error [µ deg/s]
0.5
1
1.5 Time [h]
2
2.5
3
2.5
3
(b) r˙0 RMS Error Prediction
2
0.2 0 0
117
1.6 1.4 1.2 1 0.8 0.6 0.4 0.2
0.5
1
1.5 Time [h]
(c) θ˙0 RMS Error
2
2.5
3
0 0
0.5
1
1.5 Time [h]
2
(d) θ˙0 RMS Error Prediction
Figure 5.36: Non-Gaussian Simulation Results: Orbit Velocity
5.4. RENDEZVOUS NAVIGATION IN ELLIPTICAL ORBIT
100
2
Rk(1,1) RMS Error [m ]
80 70 60 50 40 30
1000 900 Rk(5,5) RMS Error [mrad2]
A−DD1 A−DD2 AH−DD1 AH−DD2
90
800 700 600 500 400 300
20
200
10
100
0 0
0.5
1
1.5 Time [h]
2
2.5
118
0 0
3
0.5
(a) R11 RMS Error
1
1.5 Time [h]
2
2.5
3
2
2.5
3
(b) R55 RMS Error
Contamination Parameter RMS Error
0.1
2
Qk(1,1) RMS Error [cm /sec]
0.09 0.08 0.07 0.06 0.05 0.04 0.03 0.02 0.01 0 0
0.5
1
1.5 Time [h]
(c) Q11 RMS Error
2
2.5
3
0.1
0.05
0 0
0.5
1
1.5 Time [h]
(d) eˆ RMS Error
Figure 5.37: Non-Gaussian Simulation Results: Covariance and Contamination
5.4. RENDEZVOUS NAVIGATION IN ELLIPTICAL ORBIT 25
400 350 σ1 Tracking Error [mrad]
20
15
10
300 250
DD1 DD2 H−DD1 H−DD2 A−DD1 A−DD2 AH−DD1 AH−DD2
200 150
c
ρc Tracking Error [km]
119
5
100 50
0 0
0.5
1
1.5 Time [h]
2
2.5
0 0
3
0.5
(a) ρc RMS Error
1
1.5 Time [h]
2
2.5
3
2
2.5
3
2
2.5
3
(b) σ1c RMS Error 400
1500
σ2 Tracking Error [mrad]
1000
500
300 250 200 150
c
θc Tracking Error [mrad]
350
100 50
0 0
0.5
1
1.5 Time [h]
2
2.5
0 0
3
0.5
1.5 Time [h]
(d) σ2c RMS Error
400
400
350
350
300
σ3 Tracking Error [mrad]
250 200 150
300 250 200 150
c
φc Tracking Error [mrad]
(c) θc RMS Error
1
100 50 0 0
100 50
0.5
1
1.5 Time [h]
(e) φc RMS Error
2
2.5
3
0 0
0.5
1
1.5 Time [h]
(f) σ3c RMS Error
Figure 5.38: Non-Gaussian Simulation Results: Closed–Loop System Performance
5.4. RENDEZVOUS NAVIGATION IN ELLIPTICAL ORBIT
120
Table 5.10: Computational Time Comparisons Filter EKF DD1 DD2 Kalman 1.000 1.938 2.124 Huber-Kalman 1.066 2.086 2.272 Adaptive-Kalman 1.526 2.302 2.526 Adaptive-Huber-Kalman 2.961 4.330 4.659
5.4.4
Computational Comparisons
The relative computational costs of the various filters is provided in Table 5.10. Here, the median computational time is computed for each filter and then normalized by the EKF median computational time to provide a relative cost comparison. The trends observed follow closely with those provided in previous sections. In particular, the DD1 and DD2 filters cost roughly twice that of the EKF. The DD2 filter costs only slightly more than the DD1 filter. The Huber-based filters each cost roughly 7% more than the standard Kalman implementations. In the adaptive case, the adaptive Huber filters cost roughly 80% more than the standard Myers-Tapley adaptive implementations.
5.4.5
Summary
In summary, this section provided numerical examples of the robust/adaptive filters applied to the elliptical orbit rendezvous problem for both Gaussian and non-Gaussian noise cases. In the Gaussian case, the performance of the robust filters was found to be nearly the same as that of the standard Kalman type implementations. For the non-Gaussian case, however, the robust filters performed considerably better than the Kalman implementations. The closed-loop system performance results indicate that the DD1, DD2, A-DD1, A-DD2, and H-DD1 filters produced poor rendezvous maneuvering results whereas the H-DD2, AH-DD1, and AH-DD2 filters were able to perform much more successfully. The performance of the H-DD2 filter is especially interesting since it is able to successfully navigate even with erroneous assumed values of the noise statistics and is able to do so with a lower computational cost. The adaptive-Huber filters do provide the extra capabilities to estimate the noise statistics and contamination levels which, aside from robustness considerations, are of interest for sensor performance evaluation and depending on the application the extra computational costs may be deemed worthwhile.
Chapter 6
Conclusions This dissertation discusses the development of an adaptive discrete-time robust filtering technique based on a recursive form of Huber’s mixed minimum `1 /`2 norm approach, which is robust with respect to deviations from the assumed Gaussian error probability distributions inherent to the Kalman filter. The recursive estimation procedures are developed by recasting the discrete-time filtering problem into the form of a linear regression between the state prediction and the observed quantity, to be solved at each measurement update. The robust estimation approach is developed and applied to both the standard Extended Kalman Filter as well to the First and Second–Order Divided Difference Filter framework, which is an example of a relatively new class of nonlinear filter called the Sigma-Point Kalman Filter. The research described in this dissertation marks the first instance of Huber’s robust estimation technique to nonlinear filters of this type. Additionally, adaptive schemes based on generalized covariance matching is introduced whereby the filter can estimate the process noise and measurement noise covariance matrices along with the state estimate and state estimate error covariance matrix using a buffer of stored residuals. The adaptation technique adopts a robust approach to estimating these covariances that can resist the effects of outliers, based on the use of projection statistics, which have been previously developed for robust outlier identification as generalizations of the classical Mahalanobis distance measures but have not been applied to the adaptive state estimation problem in such a manner before. The robust filters were applied to several benchmark problems, including the estimation of the trajectory of an entry body from discrete–time, noisy range measurement data provided by a radar tracking system and the Multiplicative Quaternion attitude estimation problem. The simulations are conducted using Monte–Carlo techniques with both Gaussian and non–Gaussian error distributions in order to asses the performance of the filtering techniques. The results show that the proposed adaptive Huber filer can achieve greater accuracies than the Kalman filter in situations where unexpected non–Gaussian contaminating noise is present. The amount of improvement depends on the ratio of contamination but for the case of the 10% contamination, the adaptive Huber technique can improve accuracies of the Kalman filter by 50% or better. Furthermore, the adaptive Huber-based filters can successfully estimate the noise covariances in the non-Gaussian case as well as the contamination ratio whereas the adaptive Kalman filter is not capable of doing so. Therefore, the adaptive Huber filter has better consistency and is self–tuning. Next, the hybrid robust/adaptive filtering approaches were applied to the 6 degree of freedom elliptical orbit rendezvous problem. In this problem, the navigation filters are used “real–time” 121
122
inside the control loop as state observers whereas the previous examples have considered only open loop estimation problems where the state estimator does not interact with the dynamics of the problem. The full nonlinear equations of relative motion are formulated in spherical coordinates centered on the target orbit. A relatively simple control law based on feedback linearization is used to track a desired rendezvous trajectory. The attitude dynamics are parameterized using Modified Rodrigues Parameters, which are advantageous for both control law development and estimation since they constitute a minimal 3-parameter attitude description. A switching technique which exploits the stereographic projection properties of the MRP coordinate is utilized to avoid singularities which inevitably arise in minimal attitude descriptions. This dissertation also introduces the proper covariance transformations associated with the singularity avoidance switching technique, which provides a novel means for globally non-singular attitude estimation with a minimal attitude description. An attitude control law based on backstepping is employed to track the target vehicle. A sensor suite consisting of a generic lidar or optical sensor, an Inertial Measurement Unit, consisting of accelerometers and gyroscopes, a star tracker, and a horizon sensor are utilized to provide measurement data to the navigation filters so that the chaser vehicle can estimate its relative state during the rendezvous maneuver. Several filters will be implemented for comparison, including the Extended Kalman Filter, First and Second–Order Divided Difference Filters and Huber–based generalizations of these filters that include adaptive techniques for estimating the noise covariances. Monte-Carlo simulations are presented which include both Gaussian and nonGaussian errors, including mismatches in the assumed noise covariances in the navigation filters in order to illustrate the benefits of the robust/adaptive nonlinear filters. Additionally, computational burdens of the various filters is compared. The results indicate that the robust filters give rise to essentially the same closed-loop performance as their non-robust counterparts for purely Gaussian noise simulations. However for the non-Gaussian problem, the results of the hybrid robust/adaptive filters is superior to the non-robust filters by a considerable margin. It is anticipated that the techniques introduced in this dissertation will be beneficial to a wide range of linear and non-linear filtering, estimation, navigation, and sensor fusion problems in order to reduce the sensitivity of the technique with respect to non-Gaussian noise components with uncertain statistics. Also the globally non-singular technique for attitude estimation using Modified Rodrigues Parameters is applicable to a variety of applications including spacecraft and aircraft attitude estimation.
Bibliography [1] Houbolt, J. C., “Problems and Potentialities of Space Rendezvous,” Astronautica Acta, Vol. 7, Nos. 5/6, 1961, pp. 406–429. [2] Polites, M. E., “Technology of Automated Rendezvous and Capture in Space,” Journal of Spacecraft and Rockets, Vol. 36, No. 2, 1999, pp. 280–291. [3] “NASA’s Exploration Systems Architecture Study,” NASA/TM–2005–214062, November 2005. [4] Ruoff, C., “Technologies for Mars Exploration and Sample Return,” American Institute of Aeronautics and Astronautics, AIAA Paper 1999–4447, September 1999. [5] Moses, R. W., Van Laak, J., Johnson, S. L., Chytka, T. M., Amundsen, R. M., Dorsey, J. T., Doggett, W. R., Reeves, J. D., Todd, B. K., Stambolian, D. B., and Moe, R. V., “Analysis of In–Space Assembly of Modular Systems,” American Institute of Aeronautics and Astronautics, AIAA Paper 2005–2504, January 2005. [6] Zimpfer, D., Kachmar, P., and Tuohy, S., “Autonomous Rendezvous, Capture, and In-Space Assembly: Past, Present, and Future,” American Institute of Aeronautics and Astronautics, AIAA Paper 2005-2523, January 2005. [7] Shen, H. and Tsiotras, P., “Peer-to-Peer Refuelling for Circular Satellite Constellations,” Journal of Guidance, Control, and Dynamics, Vol. 28, No. 6, 2005, pp. 1220–1230. [8] Machula, M. F. and Sandhoo, G. S., “Rendezvous and Docking for Space Exploration,” American Institute of Aeronautics and Astronautics, AIAA Paper 2005-2716, January 2005. [9] Rumford, T. E., “Demonstration of Autonomous Rendezvous Technology (DART) Project Summary,” Space Systems and Operations, Tchoryk, P. and Shoemaker, J., (Eds.), SPIE Proceedings, Vol. 5088, 2003, pp. 10–19. [10] “Overview of the DART Mishap Investigation Results,” NASA Marshall Space Flight Center, May 15, 2006. [11] Ruth, M. and Tracy, C., “Video–Guidance Design for the DART Rendezvous Mission,” Spacecraft Platforms and Infrastructure, SPIE Proceedings, Vol. 5419, 2004, pp. 92–106. [12] Clohessy, W. H. and Wiltshire, R. S., “Terminal Guidance System for Satellite Rendezvous,” Journal of the Aerospace Sciences, Vol. 27, No. 5, 1960, pp. 653–658, 674. [13] Kawano, I., Mokuno, M., Kasai, T., and Suzuki, T., “Result of Autonomous Rendezvous Docking Experiment of Engineering Test Satellite VII,” Journal of Spacecraft and Rockets, Vol. 38, No. 1, 2001, pp. 105–111. [14] Goodman, J., “Lessons Learned From Seven Space Shuttle Missions,” NASA/CR–2007– 213697, January 2007. [15] Kalman, R. E., “A New Approach to Linear Filtering and Prediction Problems,” Journal of
123
BIBLIOGRAPHY
[16] [17] [18] [19]
[20] [21] [22] [23] [24] [25] [26] [27] [28] [29] [30] [31] [32] [33] [34]
[35] [36] [37]
124
Basic Engineering, Vol. 82, No. 1, 1960, pp. 35–50. Swerling, P., “First–Order Error Propagation in a Stagewise Smoothing Procedure for Satellite Observations,” Journal of the Astronautical Sciences, Vol. 6, No. 3, 1959, pp. 46–52. Sorenson, H. W., “Least–Squares Estimation: From Gauss to Kalman,” IEEE Spectrum, Vol. 7, No. 7, 1970, pp. 63–68. Meinhold, R. J. and Singpurwalla, N. D., “Understanding the Kalman Filter,” American Statistician, Vol. 37, No. 2, 1983, pp. 123–127. Tukey, J. W., “A Survey of Sampling from Contaminated Distributions,” Contributions to Probability and Statistics, Olkin, I., Ghurye, S., Hoeffding, W., Madow, W., and Mann, H. (Eds.), Stanford University Press, Stanford, CA, 1960, pp. 448–485. Schick, I. C. and Mitter, S. K., “Robust Recursive Estimation in the Presence of Heavy-Tailed Observation Noise,” Annals of Statistics, Vol. 22, No. 2, 1994, pp. 1045–1080. Box, G. E. P., “Non–Normality and Tests on Variances,” Biometrika, Vol. 40, Nos. 3/4, 1953, pp. 318–335. Huber, P. J., Robust Statistics, Wiley, New York, 1981, pp. 43–106, 153–198. Hampel, F. R., Rousseeuw, P. J., Ronchetti, E., and Stahel, W. A., Robust Statistics: The Approach Based on Influence Functions, Wiley, New York, 1986, pp. 78–186. Rousseeuw, P. J. and Leroy, A. M., Robust Regression and Outlier Detection, John Wiley and Sons, New York, NY, 1987, pp. 158–174. Maronna, R. A., Martin, R. D., and Yohai, V. J., Robust Statistics: Theory and Methods, John Wiley & Sons, Ltd., West Sussex, England, 2006. Plackett, R. L., “The Discovery of the Method of Least Squares,” Biometrika, Vol. 59, No. 2, 1972, pp. 239–251. Stigler, S. M., “Gauss and the Invention of Least Squares,” Annals of Statistics, Vol. 9, No. 3, 1981, pp. 465–474. Stigler, S. M., “Mathematical Statistics in the Early States,” Annals of Statistics, Vol. 6, No. 2, 1978, pp. 239–265. Stigler, S. M., “Simon Newcomb, Percy Daniell, and the History of Robust Estimation 1885– 1920,” Journal of the American Statistical Association, Vol. 68, No. 344, 1973, pp. 872–879. Huber, P. J., “Robust Statistics: A Review,” Annals of Mathematical Statistics, Vol. 43, No. 4, 1972, pp. 1041–1067. Eisenhart, C., “Laws of Error II: The Gaussian Distribution,” Encyclopedia of Statistical Science, Kotz, S. and Johnson, N. L., (Eds.), Wiley, New York, NY, 1983, pp. 547–566. Stigler, S. M., “Laplace’s 1774 Memoir on Inverse Probability,” Statistical Science, Vol. 1, No. 3, 1986, pp. 359–363. Stigler, S. M., “Boscovich, Simpson, and 1760 Manuscript Note on Fitting a Linear Relation,” Biometrika, Vol. 71, No. 3, 1984, pp. 615–620. Portney, S. and Koenker, R., “The Gaussian Hare and the Laplacian Tortoise: Computability of Squared–Error versus Absolute–Error Estimators,” Statistical Science, Vol. 12, No. 4, 1997, pp. 279–296. Hampel, F., “Robust Statistics: A Brief Introduction and Overview,” Symposium on Robust Statistics and Fuzzy Techniques in Geodesy and GIS, ETH Zurich, March 2001. Beckman, R. J. and Cook, R. D., “Outliers,” Technometrics, Vol. 25, No. 2, 1983, pp. 119–149. Newcomb, S., “A Generalized Theory of the Combination of Observations so as to Obtain the
BIBLIOGRAPHY
[38] [39] [40] [41] [42]
[43] [44] [45]
[46] [47]
[48] [49]
[50] [51] [52] [53]
[54] [55] [56]
125
Best Result,” American Journal of Mathematics, Vol. 8, No. 4, 1886, pp. 343–366. Huber, P. J., “Robust Estimation of a Location Parameter,” Annals of Mathematical Statistics, Vol. 35, No. 2, 1964, pp. 73–101. Newcomb, S., “Researches on the Motion of the Moon, II,” Astronomical Papers, U.S. Nautical Almanac Office, Vol. 9, pp. 1–249, 1912. Huber, P. J., “Robust Regression: Asymptotics, Conjectures and Monte Carlo,” Annals of Statistics, Vol. 1, No. 5, 1973, pp. 799–821. Huber, P. J., “Minimax Aspects of Bounded–Influence Regression,” Journal of the American Statistical Association, Vol. 78, No. 381, 1983, pp. 66–72. Boncelet, C. G. and Dickinson, B. W., “An Approach to Robust Kalman Filtering,” 22nd IEEE Conference on Decision and Control, Institute of Electrical and Electronics Engineers, New York, NY, 1983, pp. 304–305. Kovacevic, B., Durovic, Z., and Glavaski, S., “On Robust Kalman Filtering,” International Journal of Control, Vol. 56, No. 3, 1992, pp. 547–562. El-Hawary, F. and Jing, Y., “Robust Regression-Based EKF for Tracking Underwater Targets,” IEEE Journal of Oceanic Engineering, Vol. 20, No. 1, 1995, pp. 31–41. Durgaprasad, G. and Thakur, S. S., “Robust Dynamic State Estimation of Power Systems Based on M-Estimation and Realistic Modeling of System Dynamics,” IEEE Transactions on Power Systems, Vol. 13, No. 4, 1998, pp. 1331–1336. Yang, T., Lee, J., Lee, K. Y., and Sung, K., “On Robust Kalman Filtering with Forgetting Factor for Sequential Speech Analysis,” Signal Processing, Vol. 63, No. 2, 1997, pp. 151–156. Ledoux, C., “Robust Speech Filtering in Impulsive Noise Environments,” M.S. Thesis, Department of Electrical and Computer Engineering, Virginia Polytechnic Institute and State University, Blacksburg, VA, December 1999. Karlgaard, C. D., “Robust Rendezvous Navigation in Elliptical Orbit,” Journal of Guidance, Control, and Dynamics, Vol. 29, No. 2, 2006, pp. 495–499. Ghandi, M. A. and Mili, L., “Robust Kalman Filter Based on a Generalized Maximum– Likelihood–Type Estimator,” IEEE Transactions on Signal Processing, Vol. 58, No. 5, 2010, pp. 2509–2520. Jeffreys, H., “An Alternative to the Rejection of Observations,” Proceedings of the Royal Society of London, Series A, Vol. 137, No. 831, 1932, pp. 78–87. Sorenson, H. W. and Alspach, D. L., “Recursive Bayesian Estimation Using Gaussian Sums,” Automatica, Vol. 7, No. 4, 1971, pp. 465–479. Alspach, D. L. and Sorenson, H. W., “Nonlinear Bayesian Estimation Using Gaussian Sum Approximations,” IEEE Transactions on Automatic Control, Vol. 17, No. 4, 1972, pp. 439–448. Tanaka, M. and Katayama, T., “Robust Kalman Filter for Linear Discrete–Time System with Gaussian Sum Noises,” International Journal of Systems Science, Vol. 18, No. 9, 1987, pp. 1721–1731. Plantaniotis, K. N., Androutsos, D., and Venetsanopoulos, A. N., “Nonlinear Filtering of NonGaussian Noise,” Journal of Intelligent and Robotic Systems, Vol. 19, No. 2, 1997, pp. 201–231. Tam, W. I., Plantaniotis, K. N., and Hatzinakos, D., “An Adaptive Gaussian Sum Algorithm for Radar Tracking,” Signal Processing, Vol. 77, No. 1, 1999, pp. 85–104. Kotecha, J. H. and Djuric, P. M., “Gaussian Particle Filtering,” IEEE Transactions on Signal Processing, Vol. 51, No. 10, 2003, pp. 2592–2601.
BIBLIOGRAPHY
126
[57] Kotecha,J. H. and Djuric, P. M., “Gaussian Sum Particle Filtering,” IEEE Transactions on Signal Processing, Vol. 51, No. 10, 2003, pp. 2602–2612. [58] Masreliez, C. J. and Martin, R. D., “Robust Bayesian Estimation for the Linear Model and Robustifying the Kalman Filter,” IEEE Transactions on Automatic Control, Vol. 22, No. 3, 1977, pp. 361–371. [59] Tsai, C. and Kurz, L., “An Adaptive Robustizing Approach to Kalman Filtering,” Automatica, Vol. 19, No. 3, 1983, pp. 279–288. [60] Hewer, G. A., Martin, R. D., and Yeh, J., “Robust Preprocessing for Kalman Filtering of Glint Noise,” IEEE Transactions on Aerospace and Electronic Systems, Vol. 23, No. 1, 1987, pp. 120–128. [61] Meinhold, R. J. and Singpurwalla, N. D., “Robustification of Kalman Filter Models,” Journal of the American Statistical Association, Vol. 84, No. 406, 1989, pp. 479–486. [62] Niehsen, W., “Robust Kalman Filtering with Generalized Gaussian Measurement Noise,” IEEE Transactions on Aerospace and Electronic Systems, Vol. 38, No. 4, 2002, pp. 1409–1412. [63] Fitzgerald, R. J., “Divergence of the Kalman Filter,” IEEE Transactions on Automatic Control, Vol. 16, No. 6, 1971, pp. 736–747. [64] Mehra, R. K., “Approaches to Adaptive Filtering,” IEEE Transactions on Automatic Control, Vol. 17, No. 5, 1972, pp. 693–698. [65] Tapley, B. D. and Born, G. H., “Sequential Estimation of the State and the Observation–Error Covariance Matrix,” AIAA Journal, Vol. 9, No. 2, 1971, pp. 212–217. [66] Myers, K. A. and Tapley, B.D., “Adaptive Sequential Estimation with Unknown Noise Statistics,” IEEE Transactions on Automatic Control, Vol. 21, No. 4, 1976, pp. 520–523. [67] Maybeck, P. S., Jensen, R. L., Harnly, D. A., “An Adaptive Extended Kalman Filter for Target Image Tracking,” IEEE Transactions on Aerospace and Electronic Systems, Vol. 17, No. 2, 1981, pp. 173–180. [68] Whitmore, S. A. and Leondes, C. T., “Formulation and Implementation of a Practical Algorithm for Non–Stationary Adaptive State Estimation,” International Journal of Control, Vol. 44, No. 3, 1986, pp. 767–775. [69] Hull, D. G., Speyer, J. L., and Greenwell, W .M., “Adaptive Noise Estimation for Homing Missiles,” Journal of Guidance, Control, and Dynamics, Vol. 7, No. 3, 1984, pp. 322–328. [70] Groutage, F. D., Jacqout, R. G., and Smith, D. E., “Adaptive State Variable Estimation Using Robust Smoothing,” Journal of Dynamic Systems, Measurement, and Control, Vol. 106, No. 4, 1984, pp. 335–341. [71] Kirlin, R. L. and Moghaddamjoo, A., “Robust Adaptive Kalman Filtering for Systems with Unknown Step Inputs and Non–Gaussian Measurement Errors,” IEEE Transactions on Acoustics, Speech, and Signal Processing, Vol. 24, No. 2, 1986, pp. 252–263. [72] Durovic, Z. M. and Kovacevic, B. D., “Robust Estimation with Unknown Noise Statistics,” IEEE Transactions on Automatic Control, Vol. 44, No. 6, 1999, pp. 1292–1296. [73] Zou, Y., Chan, S. C., and Ng, T. S., “Robust M–Estimate Adaptive Filtering,” IEE Proceedings of Vision, Image, and Signal Processing, Vol. 148, No. 4, 2001, pp. 289–294. [74] Psiaki, M. L., “Backward–Smoothing Extended Kalman Filter,” Journal of Guidance, Control, and Dynamics, Vol. 28, No. 5, 2005, pp. 885–894. [75] Haupt, G. T., Kasdin, N. J., Keiser, G. M., and Parkinson, B. W., “Optimal Recursive Iterative Algorithm for Discrete Nonlinear Least–Squares Estimation,” Journal of Guidance, Control,
BIBLIOGRAPHY
[76]
[77]
[78] [79]
[80] [81] [82]
[83] [84] [85] [86]
[87] [88] [89] [90] [91] [92] [93] [94]
127
and Dynamics, Vol. 19, No. 3, 1996, pp. 643–649. Kasdin, N. J. and Haupt, G. T., “Second–Order Correction and Numerical Considerations for the Two–Step Optimal Estimator,” Journal of Guidance, Control, and Dynamics, Vol. 20, No. 2, 1997, pp. 362–369. Garrison, J. L., Axelrad, P., and Kasdin, N. J., “Ill–Conditioned Covariance Matrices in the First–Order Two–Step Estimator,” Journal of Guidance, Control, and Dynamics, Vol. 21, No. 5, 1998, pp. 754–760. Kasdin, N. J., “New, Guaranteed Positive Time Update for the Two–Step Optimal Estimator,” Journal of Guidance, Control, and Dynamics, Vol. 23, No. 2, 2000, pp. 215–221. Nørgaard, M., Poulsen, N. K. and Ravn, O., “Advances in Derivative-Free State Estimation for Nonlinear Systems,” Technical Report IMM-REP-1998-15, Department of Mathematical Modelling, Technical University of Denmark, revised April 2000. Nørgaard, M., Poulsen, N. K. and Ravn, O., “New Developments in State Estimation for Nonlinear Systems,” Automatica, Vol. 36, No. 11, 2000, pp. 1627–1638. Schei, T. S., “A Finite–Difference Method for Linearization in Nonlinear Estimation Algorithms,” Automatica, Vol. 33, No. 11, 1997, pp. 2053–2058. Julier, S., Uhlmann, J., and Durrant–Whyte, H. F., “A New Method for the Nonlinear Transformation of Means and Covariances in Filters and Estimators,” IEEE Transactions on Automatic Control, Vol. 45, No. 3, 2000, pp. 477–482. Julier, S. J. and Uhlmann, J. K., “Unscented Filtering and Nonlinear Estimation,” Proceedings of the IEEE, Vol. 92, No. 3, 2004, pp. 401–422. Ito, K. and Xiong, K., “Gaussian Filters for Nonlinear Filtering Problems,” IEEE Transactions on Automatic Control, Vol. 45, No. 5, 2000, pp. 910–927. Quine, B. M., “A Derivative-Free Implementation of the Extended Kalman Filter,” Automatica, Vol. 42, No. 11, 2006, pp. 1927-1934. Li. W., Wei, P., and Xian, X., “An Adaptive Nonlinear Filter of Discrete–Time System with Uncertain Covariance Using Unscented Kalman Filter,” International Symposium on Communications and Information Technology, October 2005. Lefferts, E. J., Markley, F. L., and Shuster, M. D., “Kalman Filtering for Spacecraft Attitude Estimation,” Journal of Guidance, Control, and Dynamics, Vol. 5, No. 5, 1982, pp. 417–429. Crassidis, J. L., Markley, F. L., and Cheng, Y., “Survey of Nonlinear Attitude Estimation Methods,” Journal of Guidance, Control, and Dynamics, Vol. 30, No. 1, 2007, pp. 12–28. Zanetti, R. and Bishop, R., “Quaternion Estimation and Norm Constrained Kalman Filtering,” American Institute of Aeronautics and Astronautics, AIAA Paper 2006–6164, August 2006. Majji, M. and Mortari, D., “Quaternion Constrained Kalman Filter,” American Astronautical Society, AAS Paper 08–215, January 2008. Zanetti, R., Majji, M., Bishop, R. H., and Mortari, D., “Norm–Constrained Kalman Filtering,” Journal of Guidance, Control, and Dynamics, Vol. 32, No. 5, 2009, pp. 1458–1465. Schaub, H. and Junkins, J. L., Analytical Mechanics of Space Systems, American Institute of Aeronautics and Astronautics, AIAA Education Series, Reston, VA, 2003. Tsiotras, P. and Longuski, J. M., “A New Parameterization of the Attitude Kinematics,” Journal of the Astronautical Sciences, Vol. 43, No. 3, 1995, pp. 243–262. Schaub, H. and Junkins, J. L., “Stereographic Orientation Parameters for Attitude Dynamics: A Generalization of the Rodrigues Parameters,” Journal of the Astronautical Sciences, Vol. 44,
BIBLIOGRAPHY
128
No. 1, 1996, pp. 1–19. [95] Schaub, H., Robinett, R. D., and Junkins, J. L., “New Penalty Functions for Optimal Control Formulation for Spacecraft Attitude Control Problems,” Journal of Guidance, Control, and Dynamics, Vol. 20, No. 3, 1997, pp. 428–434. [96] Crassidis, J. L. and Markley, F. L., “Attitude Estimation Using Modified Rodrigues Parameters,” Proceedings of the Flight Mechanics/Estimation Theory Symposium, NASA-Goddard Space Flight Center, Greenbelt, MD, May 1996, pp. 71-83. [97] Markley, F. L., “Attitude Error Representations for Kalman Filtering,” Journal of Guidance, Control, and Dynamics, Vol. 26, No. 2, 2003, pp. 311–317. [98] Crassidis, J. L. and Markley, F. L., “Unscented Filtering for Spacecraft Attitude Estimation,” Journal of Guidance, Control, and Dynamics, Vol. 26, No. 4, 2003, pp. 536–542. [99] Cheng, Y. and Crassidis, J. L., “Particle Filtering for Sequential Spacecraft Attitude Estimation,” American Institute of Aeronautics and Astronautics, AIAA Paper 2004–5337, August 2004. [100] Chen, J., Yuan, J., and Fang, Q., “Flight Vehicle Attitude Determination Using the Modified Rodrigues Parameters,” Chinese Journal of Aeronautics, Vol. 21, No. 5, 2008, pp. 433–440. [101] Lee, D. and Alfriend, K. T., “Additive Divided Difference Filtering for Attitude Estimation Using Modified Rodrigues Parameters,” American Astronautical Society, AAS Paper 08-283, June 2008. [102] Aldrich, J., “R. A. Fisher and the Making of Maximum Likelihood, 1912-1922,” Statistical Science, Vol. 12, No. 3, 1997, pp. 162–176. [103] Kendall, M. G., “Daniel Bernoulli on Maximum Likelihood,” Biometrika, Vol. 48, Nos. 1/2, 1961, pp. 1–18. [104] Hald, A., “On the History of Maximum Likelihood in Relation to Inverse Probability and Least Squares,” Statistical Science, Vol. 14, No. 2, 1999, pp. 214–222. [105] Leon–Garcia, A., Probability and Random Processes for Electrical Engineering, Addison– Wesley, Reading, MA, 1994, pp. 207–231. [106] Sorenson, H. W., Parameter Estimation: Principles and Problems, Marcel Dekker, Inc., New York, 1980, pp. 183–198. [107] Huber, P. J., “The Behavior of Maximum–Likelihood Estimates Under Nonstandard Conditions,” Proceedings of the Fifth Berkeley Symposium on Mathematical Statistics and Probability, LeCam, L. M. and Neyman, J. (Eds.), University of California Press, Berkeley, CA, Vol. 1, 1967, pp. 221–233. [108] Hampel, F. R., “A General Qualitative Definition of Robustness,” Annals of Mathematical Statistics, Vol. 42, No. 6, 1971, pp. 1887–1896. [109] Hampel, F. R., “The Influence Curve and Its Role in Robust Estimation,” Journal of the American Statistical Association, Vol. 69, No. 346, 1974, pp. 383–393. [110] Holland, P. W. and Welsch, R. E., “Robust Regression Using Iteratively Reweighted Least Squares,” Communications in Statistics: Theory and Methods, Vol. 6, No. 9, 1977, pp. 813–827. [111] Beaton, A. E. and Tukey, J. W., “The Fitting of Power Series, Meaning Polynomials, Illustrated on Band–Spectroscopic Data,” Technometrics, Vol. 16, No. 2, 1974, pp. 147–185. [112] Bickel, P. J., “One-Step Huber Estimates in the Linear Model,” Journal of the American Statistical Association, Vol. 70, No. 350, 1975, pp. 428-434. [113] Andrews, D. F., Bickel, P. J., Hampel, F. R., Huber, P. J., Rogers, W. H., and Tukey, J. W.,
BIBLIOGRAPHY
129
Robust Estimates of Location: Survey and Advances, Princeton University Press, Princeton, NJ, 1972. [114] Mahalanobis, P.C., “On The Generalized Distance in Statistics,” Proceedings of the National Institute of India, Vol. 12, 1938, pp. 49–55. [115] Gasko, M. and Donoho, D. L., “Influential Observations in Data Analysis,” Proceedings of the Business and Economic Statistics Section, American Statistical Association, 1982, pp. 104-110. [116] Rousseeuw, P. J. and van Zomeren, B. C., “Unmasking Multivariate Outliers and Leverage Points,” Journal of the American Statistical Association, Vol. 85, No. 411, 1990, pp. 633–639. [117] Rousseeuw, P. J. and van Zomeren, B. C., “Robust Distances: Simulations and Cutoff Values,” In Stahel, W. and Weisberg, S. (Eds.), Directions in Robust Statistics and Diagnostics, Part II, Vol. 34, The IMA Volumes in Mathematics and its Applications, Springer-Verlag, New York, 1991, pp. 195–203. [118] Des Rosiers, A. P., Schoenig, G. N., and Mili, L., “Robust Space–Time Adaptive Processing Using Projection Statistics,” International Conference on Radar Systems, Toulouse, France, October 2004. [119] Mili, L., Cheniae, M. G., Vichare, N. S., and Rousseeuw, P. J., “Robust State Estimation Based on Projection Statistics,” IEEE Transactions on Power Systems, Vol. 11, No. 2, 1996, pp. 1118–1125. [120] Mallows, C. L., “On Some Topics in Robustness,” Technical Memorandum, Bell Telephone Laboratories, Murray Hill, NJ, 1975. [121] Mallows, C. L., “Some Theory of Nonlinear Smoothers,” Annals of Statistics, Vol. 8, No. 4, 1980, pp. 695–715. [122] Krasker, W. S. and Welsch, R. E., “Efficient Bounded–Influence Regression Estimation,” Journal of the American Statistical Association, Vol. 77, No. 379, 1982, pp. 595–604. [123] Petrus, P., “Robust Huber Adaptive Filter,” IEEE Transactions on Signal Processing, Vol. 47, No. 4, 1999, pp. 1129–1133. [124] Handschin, E., Schweppe, F. C., Kohlas, J., and Fiechter, A., “Bad Data Analysis for Power System State Estimation,” IEEE Transactions on Power Apparatus and Systems, Vol. 94, No. 2, 1975, pp. 329–337. [125] Coakley, C. W. and Hettmansperger, T. P., “A Bounded Influence, High Breakdown, Efficient Regression Estimator,” Journal of the American Statistical Association, Vol. 88, No. 423, 1993, pp. 872–880. [126] Ghandi, M. A., Ledoux, C., and Mili, L., “Robust Estimation Methods for Impulsive Noise Suppression in Speech,” IEEE International Symposium on Signal Processing and Information Technology, 2005, pp. 755–760. [127] Thomas, L. and Mili, L., “A Robust GM–Estimator for the Automated Detection of External Defects on Barked Hardwood Logs and Stems,” IEEE Transactions on Signal Processing, Vol. 55, No. 7, 2007, pp. 3568–3576. [128] Duncan, D. B. and Horn, S. D., “Linear Dynamic Recursive Estimation from the Viewpoint of Regression Analysis,” Journal of the American Statistical Association, Vol. 67, No. 340, 1972, pp. 815–821. [129] Burl, J. B., Linear Optimal Control, Addison–Wesley, Reading, MA, 1999, pp. 437. [130] Van Loan, C. F., “Computing Integrals Involving the Matrix Exponential,” IEEE Transacctions on Automatic Control, Vol. 23, No. 3, 1978, pp. 395–404.
BIBLIOGRAPHY
130
[131] Athans, M., Wishner, R. P. and Bertolini, A., “Suboptimal State Estimation for ContinuousTime Nonlinear Systems from Discrete Noisy Measurements,” IEEE Transactions on Automatic Control, Vol. 13, No. 5, 1968, pp. 504–514. [132] Wu, W., “Maximum Likelihood Identification of Glint Noise,” IEEE Transactions on Aerospace and Electronic Systems, Vol. 32, No. 1, 1996, pp. 41–51. [133] Schlee, F. H., Standish, C. J., and Toda, N. F., “Divergence in the Kalman Filter,” AIAA Journal, Vol. 5, No. 6, 1967, pp. 1114–1120. [134] Karlgaard, C. D. and Schaub, H., “Huber–Based Divided Difference Filtering,” Journal of Guidance, Control, and Dynamics, Vol. 30, No. 3, 2007, pp. 885–891. [135] Farrenkopf, R. L., “Analytic Steady–State Accuracy Solutions for Two Common Spacecraft Attitude Estimators,” Journal of Guidance and Control, Vol. 1, No. 4, 1978, pp. 282–284. [136] Kuhl, C. T. F., “Combined Earth–/Star Sensor for Attitude and Orbit Determination of Geostationary Satellites,” Ph.D. Dissertation, Institute fur Flugmechanik und Flugregelung, Universitat Stuttgart, March 2005. [137] Oshman, Y. and Carmi, A., “Attitude Estimation from Vector Observations Using GeneticAlgorithm Embedded Quaternion Particle Filter,” Journal of Guidance, Control, and Dynamics, Vol. 29, No. 4, 2006, pp. 879–891. [138] Lam, Q., Woodruff, C., Ashton, S., and Martin, D., “Noise Estimation for Star Tracker Calibration and Enhanced Precision Attitude Determination,” Proceedings of the Fifth International Conference on Information Fusion, Vol. 1, 2002, pp. 235–242. [139] Eggleston, J. M. and Dunning, R. S., “Analytical Evaluation of a Method of Midcourse Guidance for Rendezvous with Earth Satellites,” NASA TN D–883, June 1961. [140] Kane, T. R., “Solution of Kinematical Differential Equations for a Rigid Body,” Journal of Applied Mechanics, Vol. 40, No. 1, 1973, pp. 109–113. [141] Crassidis, J. L. and Junkins, J. L., Optimal Estimation of Dynamic Systems, Chapman & Hall/CRC, Boca Raton, FL, 2004. [142] Mohanty, N. C., “Autonomous Navigation for High Altitude Satellites,” Information Sciences, Vol. 30, No. 2, 1983, pp. 125–150. [143] Mokuno, M., Kawano, I., and Suzuki, T., “In–Orbit Demonstration of Rendezvous Laser Radar for Unmanned Autonomous Rendezvous Docking,” IEEE Transactions on Aerospace and Electronic Systems, Vol. 40, No. 2, 2004, pp. 617–626. [144] Mili, L., Phaniraj, V., and Rousseeuw, P. J., “Robust Estimation Theory For Bad Data Diagnostics in Electric Power Systems,” Control and Dynamic Systems, Vol. 37, 1990, pp. 271– 325. [145] Weiner, T. F., “Theoretical Analysis of Gimballess Inertial Reference Equipment Using DeltaModulated Instruments,” Sc.D. Thesis, Massachusetts Institute of Technology, March 1962. [146] Marandi, S. R. and Modi, V. J., “A Preferred Coordinate System and the Associated Orientation Representation in Attitude Dynamics,” Acta Astronautica, Vol. 15, No. 11, 1987, pp. 833–843. [147] Shuster, M. D., “A Survey of Attitude Representations,” Journal of the Astronautical Sciences, Vol. 41, No. 4, 1993, pp. 439–517. [148] Hurtado, J. E., “Interior Parameters, Exterior Parameters, and a Cayley–like Transform,” Journal of Guidance, Control, and Dynamics, Vol. 32, No. 2, 2009, pp. 653–657. [149] Tsiotras, P., Junkins, J. L., and Schaub, H., “Higher Order Cayley Transforms with Appli-
BIBLIOGRAPHY
131
cations to Attitude Representations,” Journal of Guidance, Control, and Dynamics, Vol. 20, No. 3, 1997, pp. 528–536. [150] Bruccoleri, C. and Mortari, D., “MRAD: Modified Rodrigues Vector Attitude Determination,” Journal of the Astronautical Sciences, Vol. 54, No. 3–4, 2006, pp. 383–390. [151] Setoodeh, P., Khayatian, A., and Farjah, E., “Attitude Estimation By Divided Difference Filter–Based Sensor Fusion,” Journal of Navigation, Vol. 60, No. 1, 2007, pp. 119–128. [152] Idan, M., “Estimation of Rodrigues Parameters from Vector Observations,” IEEE Transactions on Aerospace and Electronic Systems, Vol. 32, No. 2, 1996, pp. 578–586. [153] Savage, P. G., “Strapdown Inertial Navigation Integration Algorithm Design Part 1: Attitude Algorithms,” Journal of Guidance, Control, and Dynamics, Vol. 21, No. 1, 1998, pp. 19–28. [154] Savage, P. G., “Strapdown Inertial Navigation Integration Algorithm Design Part 2: Velocity and Position Algorithms,” Journal of Guidance, Control, and Dynamics, Vol. 21, No. 2, 1998, pp. 208–221. [155] Tsiotras, P., “Stabilization and Optimality Results for the Attitude Control Problem,” Journal of Guidance, Control, and Dynamics, Vol. 19, No. 4, 1996, pp. 772–779. [156] Gunnam, K. K., Hughes, D. C., Junkins, J. L., and Kehtarnavaz, N., “A Vision–Based DSP Embedded Navigation Sensor,” IEEE Sensors Journal, Vol. 2, No. 5, 2002, pp. 428–442. [157] Creamer, N. G., Gilbreath, G. C., Meehan, T. J., Vilcheck, M. J., Vasquez, J. A., Rabinovich, W. S., Goetz, P. G., and Mahon, R., “Interspacecraft Optical Communication and Navigation Using Modulating Retroreflectors,” Journal of Guidance, Control, and Dynamics, Vol. 27, No. 1, 2004, pp. 100–106. [158] Hintze, G. C., Cornett, K. G., Rahmatiour, M. H., Heaton, A. F., Newman, L. E., Fleischmann, K. D., and Hamby, B. J., “AVGS, AR&D for Satellites, ISS, the Moon, Mars and Beyond,” American Institute of Aeronautics and Astronautics, AIAA Paper 2007-2883, May 2007. [159] Monda, M. J. and Schaub, H., “Spacecraft Relative Motion Estimation using Visual Sensing Techniques,” American Institute of Aeronautics and Astronautics, AIAA Paper 2005-7116, September 2005. [160] Stadter, P. A., Duven, D. J., Kantsiper, B. L., Sharer, P. J., Finnegan, E. J., and Weaver, G. L., “A Weak-signal GPS Architecture for Lunar Navigation and Communication Systems,” IEEE Aerospace Conference, March 2008. [161] Hur-Diaz, S., Bamford, B., and Gaylor, D., “Autonomous Lunar Orbit Navigation Using Optical Sensors,” American Astronautical Society, AAS Paper 07-312, August 2007. [162] Singla, P., Subbarao, K., and Junkins, J. L., “Adaptive Output Feedback Control for Spacecraft Rendezvous and Docking Under Measurement Uncertainty,” Journal of Guidance, Control, and Dynamics, Vol. 29, No. 4, 2006, pp. 892–902. [163] Subbarao, K. and Welsh, S., “Nonlinear Control of Motion Synchronization for Satellite Proximity Operations,” Journal of Guidance, Control, and Dynamics, Vol. 31, No. 5, 2008, pp. 1284–1294. [164] Shen, H. and Karlgaard, C. D., “An Optimal Rendezvous and Docking Simulator for Elliptial Orbits,” American Astronautical Society, AAS Paper 07-210, January 2007. [165] Pearson, D. J., “The Glideslope Approach,” American Astronautical Society, AAS Paper 89-162, 1989. [166] Wang, P. K. C., “Non-Linear Guidance Laws for Autonomous Orbital Rendezvous,” Inter-
BIBLIOGRAPHY
132
national Journal of Control, Vol. 42, No. 3, 1985, pp. 651–670. [167] Khalil, H. K., Nonlinear Systems, Third Edition, Prentice–Hall, Upper Saddle River, NJ, 2002. [168] Kluever, C. A., “Feedback Control for Spacecraft Rendezvous and Docking,” Journal of Guidance, Control, and Dynamics, Vol. 22, No. 4, 1999, pp. 609–611. [169] Yoon, H. and Agrawal, B. N., “Novel Expressions of Equations of Relative Motion and Control in Keplerian Orbits,” Journal of Guidance, Control, and Dynamics, Vol. 32, No. 2, 2009, pp. 664–669. [170] Brody, A. R., “Evaluation of the ‘0.1% Rule’ for Docking Maneuvers,” Journal of Spacecraft and Rockets, Vol. 27, No. 1, 1990, pp. 7–8. [171] Simandl, M. and Dunik, J., “Derivative–Free Estimation Methods: New Results and Performance Analysis,” Automatica, Vol. 45, No. 7, 2009, pp. 1749–1757.