Robust and Low Complexity Algorithms for Seizure Detection Mojtaba Bandarabadi, César A. Teixeira, Theoden I. Netoff, Member, IEEE, Keshab K. Parhi, Fellow, IEEE, and António Dourado, Member, IEEE Abstract—This paper presents two low complexity and yet robust methods for automated seizure detection using a set of 2 intracranial Electroencephalogram (iEEG) recordings. Most current seizure detection methods suffer from high number of false alarms, even when designed to be subject-specific. In this study, the ratios of power between pairs of frequency bands are used as features to detect epileptic seizures. For comparison, these features are calculated from monopolar and bipolar iEEG recordings. Optimal thresholds are individually determined and used for each feature. Alarms are generated when the measure passes the threshold. The detector was applied to long-term continuous invasive recordings from 5 patients with refractory partial epilepsy, containing 54 seizures in 780 hours. On average, the results revealed 88.9% sensitivity, a very low false detection rate of 0.041 per hour (h-1) and detection latency of 9.4 seconds.
Index Terms – Seizure detection, bipolar analysis, power spectral density. I. INTRODUCTION High amplitude electrical activity with complex patterns is generated by the brain during epileptic seizures, lasting from seconds to minutes. Because the brain produces so many patterns of activity, distinguishing a seizure from normal electrical behavior in real-time is difficult. Epilepsy affects approximately 1% of the world population and affects people of all ages. Electroencephalography (EEG) recordings are commonly used to diagnose epilepsy and for pre-operative studies to identify the seizure focus. Continuous monitoring is also essential in clinical drug trials. Currently, the EEG data is typically analyzed by a neurologist with little aid from machine learning algorithms. However, data sets are becoming much larger and more common due to the availability of compact high volume storage devices on portable EEG recording instruments. Digitizing the signals has pushed sampling rates up to kHz range. Continuous long-term multichannel recordings produce huge amounts of data, sometimes up to several hundred megabytes for a single recording channel. The increasing size of the data necessitates the development and use of automated and intelligent algorithms for processing EEG signals. Automatic labeling of the seizure onsets can facilitate long term monitoring and diagnosis where researchers and neurologists can be referred to the labeled * This work was partially supported by EU FP7 211713 EPILEPSIAE Project and iCIS project (CENTRO-07-0224-FEDER-002003). MB would particularly like to acknowledge the Portuguese Foundation for Science and Technology (SFRH/BD/71497/2010). M. Bandarabadi, C.A. Teixeira, and A. Dourado are with CISUC, the Centre for Informatics and Systems of University of Coimbra, Portugal (email: [mojtaba, cteixei, dourado]@dei.uc.pt). T.I. Netoff and K.K. Parhi are with the University of Minnesota, Minneapolis, MN 55455, USA (email:
[email protected],
[email protected]).
978-1-4244-7929-0/14/$26.00 ©2014 IEEE
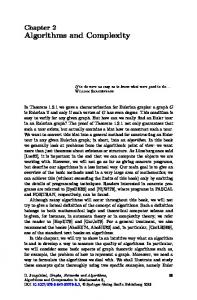
recordings. Furthermore, automated monitoring algorithms will enable real-time monitoring of EEG. This could eventually lead to closed-loop therapies for fast-acting injection devices, vagus nerve stimulation, or deep brain stimulation [1]. Such portable devices should be of low power budget and miniature in size, and designed using lowcost and fast algorithms for online processing of huge amounts of data [2]. There are many existing seizure detection algorithms. They usually seek to optimize one of two competing goals; (1) fast seizure onset detection: real-time detection of epileptic seizures with negligible delay from onset [3-6], and (2) accurate seizure event detection: the accurate labeling of the occurrence of seizures with high sensitivity and specificity [7-10]. The first approach is best suitable for closed-loop therapeutic as well as for patient care systems, where only onset detection delay times of few seconds can be tolerated. Second approach is more appropriate for offline labeling of recorded EEGs for further studies, and can tolerate longer detection lags. EEG patterns can change significantly according to the daily living conditions, such as the level of activity, awareness, sleep stage, and tiredness, increasing the complications of seizure detection problem. Also, the patterns of ictal activities usually vary from patient to patient, and even from seizure to seizure within the same patient. Meier et al. have developed a machine learning approach to detect seizures by categorizing morphological ictal rhythms into six categories based on the frequency of the dominant rhythm and then training a multiclass support vector machine (SVM) to detect different types of seizure onsets [4]. Shoeb et al. [5] proposed a patient-specific seizure onset detection using the energies of frequency bands selected from 0-25 Hz, extracted from each of N recording channels. The spectral and spatial relations between channels were captured simultaneously and fed to the SVM classifier. High number of false detections is the main drawback of most current approaches, which makes them unacceptable for clinical applications. Furthermore they have been applied mainly on short recordings, and have not been validated satisfactorily for long-term continuous recordings that are several weeks long, including extensive interictal periods. A. Approach Seizures are characterized by having highly synchronous activities starting in specific frequency range(s), which decrease as the seizure proceeds (Fig. 1). By visual analysis of time-frequency representation of seizures, it was apparent
4447
5
10
50
40
40
35
20
30
4
10
0
PSD
Hz
Ictal Interictal
60
45
25
3
10
-20
20
2
-40
15 10
10
-60
5
1
10
-80 10
20
30
40
50 60 70 Time (Seconds)
80
90
100
0
110
5
10
15
Frequency (Hz)
20
25
(a) Monopolar signal
(a) Monopolar signal 5
10
50
4
10
40
40 35
20
30
0
3
10
25
PSD
Hz
Ictal Interictal
60
45
-20
20
2
10
-40
15
1
10
10
-60
5
0
-80 10
20
30
40
50 60 70 Time (Seconds)
80
90
100
10
110
0
5
10
15
Frequency (Hz)
20
25
(b) Bipolar signal
(b) Bipolar signal
Fig. 1. Time-frequency representation iEEG signal of 2 minutes hippocampal iEEG for a studied seizure. Onset time is 30 th second.
Fig. 2. Power spectral density (PSD) for frequency range of 0.25-25 Hz, and for interictal and ictal iEEG recordings of a studied seizure.
that the spectral power in a single narrow band of iEEG signals, e.g., 13 Hz (Fig. 2), mostly increases. This phenomenon is the result of synchronous firings of neurons, highly affecting the electrical fields’ intensities. This synchronous activity for some seizures is observed in other frequency bands as well, usually recurring similarly at both higher and lower order harmonics. Therefore, in order to account for most of the seizures, and develop robust algorithms for unseen seizures, we have considered the frequency range of 9-18 Hz, covering synchronous activities from almost all studied epileptic seizures.
two adjacent invasive electrodes close to the focal area were selected for further processing. Patient characteristics are summarized in Table I. Table I. Information for the 5 studied patients ID
Sex
A B C D E
f f f f f
Patient age 29 32 11 32 18
Onset age 10 1 3 8 6
Localization of seizures* RMT, RLT LMT RMT RBF, LMT, RMT L-T, L-F
Recording time (h) 183 162.6 155 151.6 127.8
No. of seizures 9 9 14 9 13
Mean seizure duration [s] 82.3 121.9 122.7 122.5 86.5
Mean 24.4 5.6 780 54 107.1 Localization of seizures: RMT/LMT (right/left mesial temporal lobe), RLT (right lateral temporal lobe), RBF (right basal frontal lobe), L-T (left temporal lobe), L-F (left frontal lobe). *
This paper makes two contributions. First, it proposes two generalized seizure detection methods using relative spectral power features extracted from monopolar and space differential (bipolar) recordings to improve the parameters of sensitivity and specificity. The spectral power features are computationally very efficient [11], and suitable for lowpower implantable devices. Second, it evaluates the efficiency of proposed features on long-term continuous iEEG recordings that are longer than 1 month.
B. Feature extraction The power spectral densities (PSD) of monopolar and bipolar windowed iEEG signals were estimated using the Welch's method [13]. The PSD is a measure of the power at each frequency within a signal. The absolute values of spectral power features were calculated by (1), (1)
∑
II. METHODOLOGY A. Subjects Long-term continuous multichannel iEEG recordings of five patients with refractory partial epilepsy from the European Epilepsy Database [12] were used. All patients were monitored through intracranial electrodes with sampling rate of 1 KHz. Onset times, and their initialization and propagation on the electrodes were marked by epileptologists by visual inspection of iEEG recordings and using video recordings of patients during their stay in hospital. Information of both electroencephalographic and clinical onsets/offsets is available in the database, and electroencephalographic onsets were considered for this study. Among tens of recording electrodes available in the database for each patient, the iEEG signals recorded from
where is the spectral power of i-th frequency sub-band, and x is the windowed iEEG signal. The PSD was calculated in 4 second windows with a 75% overlap leading to a classification every second. From the PSD, ratio of power between different frequency bands was calculated. B.1. Relative monopolar spectral power Beside an increase in the spectral power of Alpha band, the spectral power of low frequency Delta waves (0.5-3 Hz) also would be reduced by initiating the seizure. Therefore the spectral power within 9-15 Hz was divided by the spectral power of Delta band, to highlight the changes (2), ∑
∑
(2)
where prm is the relative monopolar spectral power feature.
4448
∑
(3)
It is expected that this measure increases either too much throughout the whole seizure onset, or at least by a significant amount in some part of seizure propagation. C. Preprocessing of features The synchronous epileptic neuronal activities last for several seconds, thus applying smoothing (rectangular moving average window of 4 consecutive samples) decreases the likelihood of short synchronous events that are not ictal from reaching threshold. This preprocessing leads to an increase in the detection latency by about 2 seconds but greatly reduces the number of false alarms. D. Alarm generation and evaluation A threshold based classifier is subsequently applied on the preprocessed features. An alarm is generated when the features exceed a threshold; the alarm generation is then blocked for 4 minutes. The average of each feature for the first 30 minutes of recordings and for each patient was calculated, and k-times that average value was used as a threshold. As the optimum threshold values vary for each patient, therefore k values were chosen individually. Sensitivity (SS), false detection rate (FDR), and average detection latency (DL) of the raised alarms were used to evaluate the methods. Sensitivity is the fraction of correctly detected seizures within the total seizures, the FDR value is the number of false detections per time unit (hour), and the DL is the average time interval (in second) between seizure onsets and true alarms raised for a patient.
III. EXPERIMENTAL RESULTS The ratio of spectral power calculated from monopolar and bipolar iEEG recordings were evaluated on recordings from 5 patients from the European Epilepsy Database. The total data set contained 54 seizures over 780 hours of continuous multichannel recordings. Table II summarizes the sensitivity, false detection rate, and average detection latency of alarms for using the monopolar spectral power, monopolar relative power and bipolar relative power. On average, monopolar spectral power between 9-15 Hz frequency detected 75.9% of the seizures (41 of the 54 seizures), with a FDR of 0.155h-1 (121 false alarms in 780h), and an average detection latency of 24.4s. The power spectral ratio from the monopolar recordings detected the presence of epileptic seizure onsets with sensitivity of 85.2% (47 out of 54 onsets) with a FDR of 0.027h-1 (21 false alarms in 780h), and an average detection latency of 15s. The power spectral ratio from the bipolar recordings had slightly higher sensitivity of 88.9% (48 out of 54 onsets), but a slightly worse FDR of 0.041h-1 (32 false alarms in 780h), with a better detection latency of 9.4s. Fig. 4 presents proposed relative measures obtained for one of the seizure onsets. The presented sensitivities were achieved by a tradeoff between SS and FDR. However the higher sensitivities could be reached by setting lower threshold values, which lead to higher number of false alarms. There are few false alarms that could not be avoided even by optimizing the threshold value. After visual inspection of related iEEG recordings of these false alarms, we found that almost all of them Amplitude of feature
∑
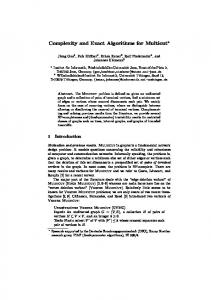
each patient. The optimal threshold should be selected so that this distance is minimized. Normalized FDR and DL values were used instead of the actual FDR and DL ones in order to limit their effect on the selection of proper threshold. Fig. 3 illustrates the results of bipolar measure for one of the studied patients.
60
40
20
0 0
20
40
60
80
100
120
140
160
180
Time (hour) Fig. 3. Relative bipolar spectral power feature for entire recording from patient A. Black line is power ratio, the red dotted lines, seizure onsets. 15
Amplitude
B.2. Relative bipolar spectral power EEG recordings are technically bipolar by nature, since they are recorded with reference to a fixed electrode. By tradition, however, these channels are called monopolar, and the difference of two monopolar channels, selected physically in close proximity is known as bipolar. In contrast to the conventional EEG, the bipolar approach is less susceptible to artifacts [14]. Bipolar processing can remove common mode interferences mounted evenly on two adjacent electrodes. These common mode interferences may include power line noise (50 or 60Hz and their harmonics) and muscle artifacts (EMG). Moreover, topographical variations invisible to monopolar recordings can be identified using bipolar schemes [15]. Bipolar channels were derived by computing difference of two immediately adjacent monopolar electrodes on the focal area, in order to capture synchronization in a small part of the brain. By examining ratios of different spectral powers extracted from bipolar signals for several patients, we considered the spectral power within 12-18 Hz divided by spectral power of 0.5-3 Hz as a measure to detect the presence of epileptic seizures (Fig. 1, Fig. 2).
The Euclidean distance between the resulting point (SS, normalized FDR, normalized DL) and the optimal performance point (SS=100, FPR=0, DL=0) of the raised alarm, was used to find the proper threshold value (k) for
4449
Relative measure Relative bipolar measure
10 5 0 0
20
40
60
80
100
Time (sec)
120
140
160
180
Fig. 4. Relative monopolar/bipolar spectral power features for a studied seizure. Seizure onset is 60th second (vertical dotted red line). The horizontal dotted lines indicate threshold values of each measure.
Table II. Results of spectral power features for 5 studied patients Patient ID A B C D E Mean
Relative monopolar spectral power SS% FDR(h-1) DL(s) Thresh.(k) 88.9 0.011 18.5 70 88.9 0.006 24.7 60 92.9 0.065 6.3 30 55.6 0.013 20 25 100 0.047 13.8 25 87.04 0.027 15.04 42
Relative bipolar spectral power SS% FDR(h-1) DL(s) 100 0.016 7 100 0.049 19 85.7 0.097 4.8 55.6 0.013 23.6 100 0.031 3.1 88.9 0.041 9.37
presented ictal-like activities, and we assume that they are probably subclinical seizures not marked in the database as epileptic seizure onsets. The FDR was significantly improved by using the bipolar features as compared to unipolar. Furthermore, the parameters of SS and average detection lag were improved notably. A. Comparing with mean phase coherence (MPC) We have recently developed a seizure detection method using sub-band mean phase coherence (sub-band MPC) [16]. The raw iEEG data of two adjacent electrodes was first band-pass filtered using forward-backward method to obtain desired frequency bands. Subsequently, the mean phase coherence (MPC) measure of each sub-band was calculated. In the present study the same data (patients, channels) were used. Table III compares the results of the proposed methods here with sub-band MPC method in terms of SS and FDR. On average, the sub-band MPC method could provide a sensitivity of 79% with a low false detection rate of 0.05h -1. The relative bipolar spectral power could improve both parameters of SS and FDR, while requiring significantly less computational cost than the sub-band MPC. Table III. Comparing the results of proposed method and sub-band MPC Relative bipolar spectral power Sub-band MPC ID SS% FDR(h-1) Freq. band SS% FDR(h-1) Freq. band A 100 0.016 12-18 / 0.5-3 78 0.06 12-18 Hz B 100 0.049 12-18 / 0.5-3 78 0.05 4-8 Hz C 85.7 0.097 12-18 / 0.5-3 71 0.09 12-18 Hz D 55.6 0.013 12-18 / 0.5-3 66 0.02 12-18 Hz E 100 0.031 12-18 / 0.5-3 100 0.04 12-18 Hz M. 88.9 0.041 79 0.05
IV. CONCLUSION Very low complexity and yet robust epileptic seizure detection methods are proposed. These methods can achieve high detection sensitivity and a very low FDR. The methods use the PSD of iEEG signal, which requires very low computational cost. The proposed methods are suitable for clinical applications and can be implemented in portable low-power budget devices for real-time monitoring of patients. The detection lag of the bipolar method is less than the unipolar method, while providing almost similar sensitivities and FDRs. Future work may be directed at applying the bipolar method for epileptic focus localization. By comparing the features extracted from paired channels of different brain regions, it may be possible to detect channels at the seizure focus that have greater variations during the seizure initiation.
Thresh.(k) 30 40 20 25 5 24
Monopolar spectral power SS% FDR(h-1) DL(s) 55.6 0.251 62.8 88.9 0.012 22 85.7 0.032 12.3 55.6 0.118 35 84.6 0.391 17.1 75.93 0.155 24.4
Thresh.(k) 50 250 45 25 90 92
REFERENCES [1] [2] [3] [4]
[5]
[6]
[7] [8] [9]
[10]
[11] [12]
[13]
[14] [15]
[16]
4450
A. Shoeb, T. Pang, J. V. Guttag, and S. C. Schachter, "Vagus Nerve Stimulation Triggered by Machine Learning Based Seizure Detection," in Epilepsy, ed: CRC Press, 2011, pp. 385-395. M. Bandarabadi, C. A. Teixeira, J. Rasekhi, and A. Dourado, "Epileptic Seizure Prediction Using Relative Spectral Power Features," Clinical Neurophysiology, 2014. M. E. Saab and J. Gotman, "A system to detect the onset of epileptic seizures in scalp EEG," Clinical Neurophysiology, vol. 116, pp. 427442, 2// 2005. R. Meier, H. Dittrich, A. Schulze-Bonhage, and A. Aertsen, "Detecting epileptic seizures in long-term human EEG: a new approach to automatic online and real-time detection and classification of polymorphic seizure patterns," Journal of Clinical Neurophysiology, vol. 25, pp. 119-31, Jun 2008. A. Shoeb, A. Kharbouch, J. Soegaard, S. Schachter, and J. Guttag, "A machine-learning algorithm for detecting seizure termination in scalp EEG," Epilepsy & Behavior, vol. 22, Supplement 1, pp. S36-S43, 12// 2011. Y. S. Park, T. I. Netoff, Y. Xiaofeng, and K. K. Parhi, "Seizure detection on/off system using rats' ECoG," in Engineering in Medicine and Biology Society (EMBC), 2012 Annual International Conference of the IEEE, 2012, pp. 4688-4691. J. Gotman, "Automatic recognition of epileptic seizures in the EEG," Electroencephalography and Clinical Neurophysiology, vol. 54, pp. 530-540, 11// 1982. S. B. Wilson, "Algorithm architectures for patient dependent seizure detection," Clinical Neurophysiology, vol. 117, pp. 1204-1216, 6// 2006. H. Hassanpour, M. Mesbah, and B. Boashash, "Time-Frequency Feature Extraction of Newborn EEG Seizure Using SVD-Based Techniques," EURASIP Journal on Advances in Signal Processing, vol. 2004, p. 898124, 2004. G. I. Varghese, M. J. Purcaro, J. E. Motelow, M. Enev, K. A. McNally, A. R. Levin, et al., "Clinical use of ictal SPECT in secondarily generalized tonic–clonic seizures," Brain, vol. 132, pp. 2102-2113, 2009. K. K. Parhi and M. Ayinala, "Low-Complexity Welch Power Spectral Density Computation," IEEE Transactions on Circuits and Systems— I: Regular Papers, vol. 61, pp. 172-182, Jan 2014. J. Klatt, H. Feldwisch-Drentrup, M. Ihle, V. Navarro, M. Neufang, C. Teixeira, et al., "The EPILEPSIAE database: An extensive electroencephalography database of epilepsy patients," Epilepsia, vol. 53, pp. 1669-1676, 2012. P. D. Welch, "The Use of Fast Fourier Transform for the Estimation of Power Spectra: A Method Based on Time Averaging Over Short, Modified Periodograms," IEEE Transactions on Audio and Electroacoustics, vol. 15, pp. 70-73, 1967. A. Aarabi, R. Grebe, and F. Wallois, "A multistage knowledge-based system for EEG seizure detection in newborn infants," Clinical Neurophysiology, vol. 118, pp. 2781-2797, 12// 2007. I. N. Baranov-Krylov and V. T. Shuvaev, "Effects of selective visual attention in the parietal and temporal areas of the human cortex using evoked potential data," Neuroscience and Behavioral Physiology, vol. 35, pp. 159-164, 2005/02/01 2005. M. Bandarabadi, J. Rasekhi, C. A. Teixeira, and A. Dourado, "Subband Mean Phase Coherence for Automated Epileptic Seizure Detection," in The International Conference on Health Informatics. vol. 42, Y.-T. Zhang, Ed., ed: Springer International Publishing, 2014, pp. 319-322.