September 4-6, 2002. 67. Robust Classification of Subcellular Location. Patterns in Fluorescence Microscope Images. Robert F. Murphy, Meel Velliste, and ...
Proceedings of the 2002 IEEE International Workshop on Neural Networks for Signal Processing, September 4-6, 2002
Robust Classification of Subcellular Location Patterns in Fluorescence Microscope Images Robert F. Murphy, Meel Velliste, and Gregory Porreca Departments of Biological Sciences and Biomedical Engineering, Carnegie Mellon University, 4400 Fifth Avenue, Pittsburgh, PA 15213/U.S.A.
The ongoing biotechnology revolution promises a complete understanding of the mechanisms by which cells and tissues carry out their functions. Central to that goal is the determination of the function of each protein that is present in a given cell type, and determining a protein's location within cells is critical to understanding its function. As large amounts of data become available from genome-wide determination of protein subcellular location, automated approaches to categorizing and comparing location patterns are urgently needed. Since subcellular location is most often determined using fluorescence microscopy, we have developed automated systems for interpreting the resulting images. We report here improved numeric features for describing such images that are fairly robust to image intensity binning and spatial resolution. We validate these features by using them to train neural networks that accurately recognize all major subcellular patterns with an accuracy higher than previously reported. Having validated the features by using them for classification, we also demonstrate using them to create Subcellular Location Trees that group similar proteins and provide a systematic framework for describing subcellular location.
INTRODUCTION Animal and plant cells have a number of subcompartments (each of which has a different biochemical environment) and subcellular structures (such as the cytoskeleton) which play an essential role in cell functions. When characterizing a protein, determining its location within cells is critical to understanding its function. A comprehensive, systematic approach to determining, describing and/or predicting the subcellular location of proteins has not been taken. A number of factors have limited progress in this area in the past. The first is ambiguity in the words used to describe subcellular locations. Different investigators use different terms to describe the same pattern and the same term is often used to describe the patterns of proteins whose patterns are known not to be identical. Second, there have been no reliable, automated methods to map between images depicting patterns and words describing them. Third, comprehensive knowledge of all possible locations (and combinations of locations) that proteins may exhibit does not exist. Restated, what is missing is a grouping of all proteins such that the proteins in each group show an identical
67
Proceedings of the 2002 IEEE International Workshop on Neural Networks for Signal Processing, September 4-6, 2002
distribution in cells (and thus the unique identifier of that group can be assigned to each of the members). This is necessary if location information is to be satisfactorily included in biological databases, as has been done for protein sequence and structure families. Fourth, while methods for comparing protein and nucleotide sequences (and structures) are well established and can be used directly from database entries, comparing protein locations from database entries is not yet possible. The concepts of hierarchical organization and distance have not yet been developed for location analysis. Recently, progress has been made towards overcoming these limitations. Laudable efforts towards addressing the first problem have been made by the Gene Ontology Consortium. However, words do not currently exist to describe the full complexity of subcellular location. Our group has addressed the second problem by developing automated methods for determining subcellular location from fluorescence microscope images. Fluorescence microscopy is the most commonly used method for analyzing subcellular location, and it is well-suited to high throughput automation. We began by developing sets of numerical features that describe protein patterns in fluorescence microscope images. We validated these descriptors by using them to develop automated classifiers capable of determining subcellular location from previously unseen images [1-4]. In this paper, we describe improved sets of features that are robust to differences between images in intensity and spatial resolution. We also use these features to begin to address the third and fourth problems by presenting the first systematic framework for capturing complexity and similarity in protein subcellular location.
SOURCES OF DATA ON SUBCELLULAR LOCATION With the development of automated, digital fluorescence microscopes over the past 15 years, it is possible to collect the large numbers of fluorescent images for diverse proteins that are required in order to develop, test and use automated interpretation methods. We have created three image datasets to this end (summarized in Table 1). The 2D HeLa dataset has been our primary reference point for developing features and testing methods. It covers all major subcellular structures and organelles and was generated using fluorescent probes that bind to molecules known to be located in those structures: a probe that binds to DNA to label the nucleus, a probe that binds to microfilaments to label the actin cytoskeleton, and antibodies against proteins located in the endoplasmic reticulum, the Golgi apparatus, lysosomes, endosomes, mitochondria, nucleoli and microtubules. In addition to these datasets, a major National Cancer Institute-funded project led by Jonathan W. Jarvik, Peter B. Berget and Robert F. Murphy is beginning to provide images of the subcellular location of randomly-tagged proteins in 3T3 cells. Preliminary wide-field 2D images (40X, pixel size 0.475 microns) have been acquired for approximately 100 clones produced by random CD-tagging [5-6]. By sequencing DNA adjacent to the tag, the tagged gene has been identified (if it is present in current sequence databases). A high resolution
68
Proceedings of the 2002 IEEE International Workshop on Neural Networks for Signal Processing, September 4-6, 2002
Dataset
Number of classes
Microscopy method
Objective
2D CHO 2D HeLa
5
Deconvolution
100X
10
Deconvolution
100X
3D HeLa
11
Confocal
100X
Size of pixel region in original field 0.23 mm 0.23 mm 0.0488 mm
Reference
Boland et al [2] Boland and Murphy [4] Velliste and Murphy, in preparation
Table 1. Image sources for development of methods for analysis of protein subcellular location.
3D image database for these clones is currently being acquired by spinning disk confocal microscopy. Other approaches to random-tagging of genes have also been described [7-9] and thus we can anticipate increased availability of detailed information on protein location over the next few years.
SUBCELLULAR LOCATION FEATURES We have designed a number of sets of numerical features – which we term SLF for Subcellular Location Features – to describe protein subcellular distributions [4]. The types of feature used include Haralick texture features, Zernike moment features, features derived from morphological image processing, and, in some cases, features derived from comparison with a reference image of the DNA distribution in the same cell. The feature sets have been used with several classification methods (linear classifiers, decision trees, k-nearest neighbor classifiers, and one- and two-hidden-layer backpropagation neural networks or BPNNs) and two-hidden-layer BPNNs were found to produce the best results for the 2D HeLa dataset [3] (although the improvement over one-hidden layer networks was within the estimated error). A BPNN with 30 nodes in both hidden layers achieved an average correct classification accuracy of 84% using a set of 37 features (termed SLF5) that was selected by stepwise discriminant analysis [10] from a larger set of 84 features (SLF4) that includes all four types of features.
69
Proceedings of the 2002 IEEE International Workshop on Neural Networks for Signal Processing, September 4-6, 2002
This represents the best accuracy so far achieved for single 2D images of all major organelle patterns. By analyzing sets of images taken from the same slide, the accuracy for these classes was improved to 98% [3,4]. It is important to note that this classification approach can distinguish two Golgi proteins with very similar patterns that cannot be distinguished by human observers. Recently, exciting confirmation that protein subcellular location patterns can be distinguished by automated classifiers with high accuracy has been reported by Danckaert et al. [11]. They employed a Modular Neural Network classifier (MNN, a topological variation on the back-propagation network), to classify 2D images from confocal microscope stacks representing six different subcellular location classes. Instead of using features, the input to the MNN was composed of raw pixel values from a downsampled version of the original image. Each module covered a specific area of the organelle image. They found that the trained classifier can recognize individual 2D images from previously unseen 3D image stacks with 84% accuracy. It is worth noting that the image set of Danckaert et al. consisted of images from four different cell types. We have also observed that classifiers can be trained to recognize images from two cell types and two modes of microscopy [12].
IMPROVING THE SUBCELLULAR LOCATION FEATURES The classification accuracy achieved when using the previously described SLF features is already high considering the amount of within-class variability of patterns and the similarity between some pairs of classes. However, when creating a systematics of all proteins in a cell type where thousands of proteins have to be placed within an overall hierarchy, it is desirable to have the best possible representation of the location patterns. We have therefore developed an improved version of our previously developed SLF3 features [4] in combination with six new features described below. SLF3 includes 13 Haralick texture features that we have subsequently found to be overly sensitive to image pixel resolution and number of gray levels. We therefore characterized the contribution of Haralick features to overall classification accuracy after resampling in various ways (Table 2). To do this, we started with the 34 (out of 37) features from SLF5 that did not require a parallel DNA image and determined average classification accuracy using a BPNN with a single hidden layer of 20 nodes. We did this for only eight of the ten classes in the 2D HeLa dataset, since we found that the original images of the two Golgi classes (giantin and gpp130) are sufficiently different in intensity scale that the original Haralick features can artificially discriminate them on that basis alone. The result was 86.4%. We then determined average accuracy using a set in which the values of the Haralick features were scrambled between images so that the number of features used was still the same (34) but any information in the Haralick features was lost. The result was 81.4%. Thus, the 12 Haralick features included in SLF5 provided a net benefit of 5.0%. Average accuracies for sets containing Haralick features calculated on downsampled images were also found and converted to net
70
Proceedings of the 2002 IEEE International Workshop on Neural Networks for Signal Processing, September 4-6, 2002
Pixel size (mm) 0.23 0.69 0.92 1.15
Number of gray-levels 256 5.0 5.4 5.8 6.2
32 4.4 3.1 3.1 3.6
16 3.8 2.9 2.9 3.5
Table 2. Relative percent benefit of Haralick features calculated on of downsampled and rebinned 2D HeLa images (excluding the giantin and gpp130 classes). At the original resolution of 0.23 mm/pixel and 256 gray-levels the classification accuracy was 86.4%. After scrambling the Haralick features the accuracy decreased to 81.4%, giving a relative benefit of 5.0% (shaded). A similar comparison was made after reducing the resolution (using bi-linear interpolation) and/or the number of gray levels (by division and integer rounding).
benefit. (Note that in all cases the non-Haralick features were calculated using the original images.) We found that Haralick features at a resolution of 1.15 mm/pixel and 32 gray levels were nearly as informative as those calculated on images of higher resolution. Perhaps surprisingly, rebinning to 1.15 mm/pixel but keeping 256 gray levels had a net benefit greater than that of the original features. The Haralick features calculated this way have the advantage of being essentially insensitive to the original spatial resolution of an image, because fluorescence microscope images generally come at a resolution higher than 1.15 mm/pixel and therefore can always be down-sampled to this “standard” pixel size. In addition, these features are essentially insensitive to the original intensity resolution of an image because images are expected to have more than 256 graylevels, and can therefore be re-quantized to the “standard” 256 levels. Even if an original image at high (e.g., 0.23 mm/pixel) spatial resolution only had gray-level values in the range of 0 to 17 (the lowest observed in the 2D HeLa dataset), the down-sampled version will be expected to have more than 256 gray levels since the gray level counts of around 25 pixels would be summed in the course of spatial downsampling. We therefore chose to define a new feature set, SLF7, incorporating the 78 features of SLF3 but with Haralick features from images downsampled to 1.15 mm/pixel and 256 gray levels. We also added six new features: SLF7.79: The fraction of cellular fluorescence not included in objects SLF7.80: The average length of the morphological skeleton of objects SLF7.81: The ratio of object skeleton length to the area of the convex hull of the skeleton, averaged over all objects SLF7.82: The fraction of object pixels contained within the skeleton SLF7.83: The fraction of object fluorescence contained within the skeleton
71
Proceedings of the 2002 IEEE International Workshop on Neural Networks for Signal Processing, September 4-6, 2002
SLF7.84: The ratio of the number of branch points in the skeleton to the length of skeleton SLF7.79 was added to measure the amount of fluorescence that is not contained in discrete objects. An object in SLF3 is defined as a contiguous region of above threshold pixels. The relatively dim fluorescence from small vesicles or other structures dispersed throughout the cytoplasm is excluded from objects. The new feature is expected to provide an important distinction between proteins that localize mainly to the same organelle but have different amounts in the cytoplasm. Features SLF7.80 through 7.84 were defined based on the morphological skeleton of objects obtained by thinning using a homotopic interval. We validated these features (for all ten classes) using the 2D HeLa dataset by selecting a subset (termed SLF8) via stepwise discriminant analysis and then training and testing using a one-hidden layer BPNN. The 32 features selected were SLF1.3, SLF3.74, SLF3.19, SLF7.79, SLF3.71, SLF3.76, SLF3.23, SLF1.9, SLF1.2, SLF1.6, SLF3.68, SLF3.59, SLF1.8, SLF1.11, SLF3.47, SLF3.70, SLF7.82, SLF1.1, SLF3.24, SLF3.66, SLF7.80, SLF3.69, SLF3.50, SLF1.5, SLF7.84, SLF3.77, SLF1.10, SLF3.73, SLF3.26, SLF3.78, SLF3.72, and SLF1.7. The results (Table 3) indicate a modest gain in performance over our previous best, but, more importantly, demonstrate (1) that this performance can be obtained with fewer, more robust features that are suitable for images from different image sources, and (2) that this performance can be achieved without requiring a reference DNA image. If features derived from a DNA image are included, stepwise discriminate analysis yields a set of 31 features that gives an average accuracy of 88% (data not shown). We also determined that if rebinning to only
True Class
DNA ER
Output of the Classifier Gia GPP LAM Mit Nuc
Act
TfR
Tub
DNA 98% 2% 0% 0% 0% 0% 0% 0% 0% 0% ER 0% 87% 0% 0% 3% 5% 0% 0% 1% 3% Giantin 0% 0% 73% 25% 0% 0% 0% 0% 1% 0% GPP130 1% 0% 26% 70% 0% 0% 1% 0% 1% 0% LAMP2 0% 3% 0% 0% 84% 1% 0% 0% 12% 0% Mitochondria 0% 4% 0% 0% 2% 88% 0% 0% 4% 2% Nucleolin 2% 0% 2% 0% 3% 1% 93% 0% 0% 0% Actin 0% 0% 0% 0% 0% 0% 0% 99% 0% 1% TfR 0% 3% 1% 0% 14% 5% 0% 0% 74% 3% Tubulin 0% 2% 0% 1% 0% 1% 0% 1% 3% 93% Table 3. Confusion matrix for classification of images from the 2D HeLa dataset using SLF8 with a BPNN with a single layer of 20 hidden units over 10 cross-validation trials. The average correct classification rate was 86%.
72
Proceedings of the 2002 IEEE International Workshop on Neural Networks for Signal Processing, September 4-6, 2002
32 gray levels is used (without DNA features), the average accuracy is still 85% (using 27 selected features).
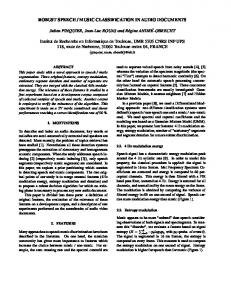
AN EXAMPLE SUBCELLULAR LOCATION TREE The demonstration that the SLF features can adequately describe the major organelle patterns (and also distinguish closely related patterns) allows them to be used to create a systematic framework for protein location. Just as comparison of DNA sequences can be used to create phylogenetic trees that group similar sequences, the SLF features can be used to create "subcellular location trees" that group similar location patterns. To create such trees, we need a measure of the degree of similarity between each pair of classes. For this purpose, we have used the new feature set SLF8. We calculated a covariance matrix for all of the images combined and mean feature vector for each class. We then calculated the Mahalanobis distance between each pair of classes, which is the multivariate distance between the mean feature vectors weighted by the overall covariance matrix. These distances were used to create a dendrogram or hierarchical tree (Figure 1), in which the distance between adjacent nodes is proportional to the Mahalanobis distance between them. As expected, the two Golgi proteins giantin and gpp130 were grouped together, as were the similar patterns of LAMP2 (lysosomes) and transferrin
Figure 1. Example Subcellular Location Tree for the 2D HeLa dataset.
73
Proceedings of the 2002 IEEE International Workshop on Neural Networks for Signal Processing, September 4-6, 2002
receptor (endosomes). Further examination of Figure 1 confirms that it is consistent with biological knowledge about the major organelle patterns. For example, the compartments that have a diffuse distribution throughout the cytoplasm (lysosomes and endosomes) that is thought to involve traffic along microtubules are grouped together with tubulin. While Figure 1 only reflects ten subcellular patterns and we cannot realistically imagine that the arrangement of branches will remain unchanged as more classes are added, it illustrates the utility of generating subcellular location trees (SLT) to organize information about protein location.
CONCLUSIONS We have shown previously that protein subcellular locations can be determined automatically from fluorescence microscope images based on numeric descriptors. We report some improvements in reliability of classification of 2D images, primarily by making features less sensitive to image spatial and intensity resolution and adding new skeleton features. These improvements represent an important step towards generalizing the approaches we have described to other cell types and image sources. Since the SLF features have been validated by using them to achieve good classification accuracy for subcellular location patterns, it is possible to use them as a basis for building trees to systematize protein subcellular location. We have presented an example Subcellular Location Tree that is consistent with current biological knowledge. We anticipate that our introduction of the concepts of pattern hierarchy and distance measurements to subcellular location will enable new directions in proteomics. Distance measures could, for example, be used to create "location neighbors" in databases. Location distance measures could also be combined with quantitative measures of sequence similarity as part of efforts to understand the sequence motifs that determine subcellular locations. It should also be noted that it is possible to use the SLF features for other automated analyses of fluorescence microscope images, such as for automated selection of representative images from a set [13], rigorously comparing two sets of images [14], and finding and interpreting fluorescence microscope images in journal articles or web pages [12]. The confluence of genomics, protein tagging methods, automated microscopy and pattern interpretation methods is opening a new frontier in computational biology.
ACKNOWLEDGEMENTS This work was supported in part by NIH grant R33 CA83219. We thank M. Dannie Durand for helpful comments on the manuscript.
74
Proceedings of the 2002 IEEE International Workshop on Neural Networks for Signal Processing, September 4-6, 2002
REFERENCES [1] M.V. Boland, M.K. Markey, and R.F. Murphy, "Classification of Protein Localization Patterns Obtained via Fluorescence Light Microscopy," in Proceedings of the 19th Annuual International Conference of the IEEE Engineering in Medicine and Biology Society, 1997, pp. 594597. [2] M.V. Boland, M.K. Markey, and R.F. Murphy, "Automated recognition of patterns characteristic of subcellular structures in fluorescence microscopy images," Cytometry, vol. 33, no 3, pp. 366-375, November 1998. [3] R.F. Murphy, M.V. Boland, and M. Velliste, "Towards a Systematics for Protein Subcellular Location: Quantitative Description of Protein Localization Patterns and Automated Analysis of Fluorescence Microscope Images," in Proceedings of the 8th International Conference on Intelligent Systems for Molecular Biology, 2000, pp. 251-259. [4] M.V. Boland and R.F. Murphy, "A Neural Network Classifier Capable of Recognizing the Patterns of all Major Subcellular Structures in Fluorescence Microscope Images of HeLa Cells," Bioinformatics, vol. 17, no 12, pp. 1213-1223, December 2001. [5] J.W. Jarvik, S.A. Adler, C.A. Telmer, V. Subramaniam, and A.J. Lopez, "CDTagging: A new approach to gene and protein discovery and analysis," Biotechniques, vol. 20, no 5, pp. 896-904, May 1996. [6] C.A. Telmer, P.B. Berget, B. Ballou, R.F. Murphy, and J.W. Jarvik, "Epitope Tagging Genomic DNA Using a CD-Tagging Tn10 Minitransposon," Biotechniques, vol. 32, no 2, pp. 422-430, February 2002. [7] M.M. Rolls, P.A. Stein, S.S. Taylor, E. Ha, F. McKeon, and T.A. Rapoport, "A visual screen of a GFP-fusion library identifies a new type of nuclear envelope membrane protein," Journal of Cell Biology, vol. 146, no 1, pp. 29-44, July 1999. [8] A. Kumar, K.-H. Cheung, P. Ross-Macdonald, P.S.R. Coelho, P. Miller, and M. Snyder, "TRIPLES: a database of gene function in Saccharomyces cerevisiae," Nucleic Acids Research, vol. 28, no 1, pp. 81-84, January 2000. [9] G. Habeler, K. Natter, G.G. Thallinger, M.E. Crawford, S.D. Kohlwein, and Z. Trajanoski, "YPL.db: the Yeast Protein Localization database," Nucleic Acids Research, vol. 30, no 1, pp. 80-83, January 2002. [10] R.I. Jennrich, "Stepwise discriminant analysis," in K. Enslein, A. Ralston, and H. S. Wilf (eds.), Statistical Methods for Digital Computers, Vol. 3, NY: John Wiley & Sons, 1977, pp. 77-95. [11] A. Danckaert, E. Gonzalez-Couto, L. Bollondi, N. Thompson, and B. Hayes, "Automated Recognition of Intracellular Organelles in Confocal Microscope Images,"Traffic, vol. 3, no 1, pp. 66-73, January 2002. [12] R.F. Murphy, M. Velliste, J. Yao, and G. Porreca, "Searching Online Journals for Fluorescence Microscope Images Depicting Protein Subcellular
75
Proceedings of the 2002 IEEE International Workshop on Neural Networks for Signal Processing, September 4-6, 2002
Locations," in Proceedings of the 2nd IEEE International Symposium on Bio-Informatics and Biomedical Engineering, 2001, pp. 119-128. [13] M.K. Markey, M.V. Boland, and R.F. Murphy, "Towards objective selection of representative microscope images," Biophysical Journal., vol. 76, no 4, pp. 2230-2237, April 1999. [14] E.J.S. Roques and R.F. Murphy, "Objective Evaluation of Differences in Protein Subellular Distribution," Traffic , vol. 3, no 1, pp. 61-65, January 2002.
76