Robust Location Estimators for the X Control Chart MARIT SCHOONHOVEN Institute for Business and Industrial Statistics of the University of Amsterdam (IBIS UvA), Plantage Muidergracht 12, 1018 TV Amsterdam, The Netherlands
HAFIZ Z. NAZIR Department of Statistics, University of Sargodha, Sargodha, Pakistan
MUHAMMAD RIAZ King Fahad University of Petroleum and Minerals, Dhahran 31261, Saudi Arabia Department of Statistics, Quad-i-Azam University, 45320 Islamabad 44000, Pakistan
RONALD J. M. M. DOES IBIS UvA, Plantage Muidergracht 12, 1018 TV, Amsterdam, The Netherlands This article studies estimation methods for the location parameter. We consider several robust location estimators as well as several estimation methods based on a phase I analysis, i.e., the use of a control chart to study a historical dataset retrospectively to identify disturbances. In addition, we propose a new type of phase I analysis. The estimation methods are evaluated in terms of their mean-squared errors and their e↵ect on the X control charts used for real-time process monitoring (phase II). It turns out that the phase I control chart based on the trimmed trimean far outperforms the existing estimation methods. This method has therefore proven to be very suitable for determining X phase II control chart limits. Key Words: Estimation; Mean; Phase I; Phase II; Robust; Shewhart Control Chart; Statistical Process Control; Trimean.
ters, and an optimal performance requires that any change in these parameters should be detected as soon as possible. To monitor a process with respect to these parameters, Shewhart introduced the idea of control charts in the 1920s. The present paper focuses on phase I location-estimation methods for constructing the location control chart.
Introduction of a process depends on the T stability of its location and dispersion parameHE PERFORMANCE
Ms. Schoonhoven is a Consultant in Statistics at IBIS UvA. She is working on her PhD, focusing on control-charting techniques. Her email address is
[email protected].
Let Yij , i = 1, 2, 3, . . . and j = 1, 2, . . . , n, denote phase II samples of size n taken in sequence of the process variable to be monitored. We assume the Yij ’s to be independent and N (µ + , 2 ) distributed, where is a constant. When = 0, the mean of the process is in control; otherwise, Pn the process mean has changed. Let Y i = (1/n) j=1 Yij be an estimate of µ + based on the ith sample Yij , j = 1, 2, . . . , n. When the in-control µ and are known, the process mean can be monitored by plotting Y¯i on a control chart with respective upper and
Mr. Nazir is a Lecturer of Statistics at the University of Sargodha. His email address is
[email protected]. Dr. Riaz is an Assistant Professor in the Department of Mathematics and Statistics of King Fahad University of Petroleum and Minerals. His email address is riaz76qau@ yahoo.com. Dr. Does is Professor in Industrial Statistics at the University of Amsterdam, Managing Director of IBIS UvA, and fellow of ASQ. His email address is
[email protected].
Vol. 43, No. 4, October 2011
363
www.asq.org
364
MARIT SCHOONHOVEN ET AL.
lower control limits UCL = µ + Cn LCL = µ Cn
p / n, p / n,
(1)
where Cn is the factor such that, for a chosen type I error probability p, we have P (LCL Y¯i UCL) = 1
p.
When Y¯i falls within the control limits, the process is deemed to be in control. We define Ei as the event that Y¯i falls beyond the limits, P (Ei ) as the probability that sample i falls beyond the limits and RL as the run length, i.e., the number of samples until the first Y¯i falls beyond the limits. When µ and are known, the events Ei are independent, and therefore RL is geometrically distributed with parameter p = P (Ei ). It follows that the average run length (ARL) is given by 1/p and that the standard p deviation of the run length (SDRL) is given by 1 p/p. In practice, the process parameters µ and are usually unknown. Therefore, they must be estimated from samples taken when the process is assumed to be largely in control. This stage in the control charting process is denoted as phase I (cf., Woodall and Montgomery (1999), Vining (2009)). The resulting estimates determine the control limits that are used to monitor the location of the process in phase II. Define µ ˆ and ˆ as unbiased estimates of µ and , respectively, based on k phase I samples of size n, which are denoted by Xij , i = 1, 2, . . . , k and j = 1, 2, . . . , n. The control limits can be estimated by p d =µ UCL ˆ + Cn ˆ / n, p d =µ LCL ˆ Cn ˆ / n. (2) d or Let Fi denote the event that Y¯i is above UCL d below LCL. We define P (Fi | µ ˆ, ˆ ) as the probability that sample i generates a signal given µ ˆ and ˆ , i.e.,
d or Y¯i > UCL d |µ P (Fi | µ ˆ, ˆ ) = P (Y¯i < LCL ˆ, ˆ ). (3) Given µ ˆ and ˆ , the distribution of the run length is geometric with parameter P (Fi | µ ˆ, ˆ ). Consequently, the conditional ARL is given by E(RL | µ ˆ, ˆ ) =
1 . P (Fi | µ ˆ, ˆ )
(4)
In contrast with the conditional RL distribution, the unconditional RL distribution takes into account the random variability introduced into the charting procedure through parameter estimation. It can be
Journal of Quality Technology
obtained by averaging the conditional RL distribution over all possible values of the parameter estimates. The unconditional p is p = E(P (Fi | µ ˆ, ˆ )),
and the unconditional average run length is ✓ ◆ 1 ARL = E . P (Fi | µ ˆ, ˆ )
(5)
(6)
Quesenberry (1993) showed, for the X control chart, that the unconditional in-control and out-of-control ARL values are higher than in the case where the process parameters are known. Furthermore, a higher in-control ARL is not necessarily better because the RL distribution will reflect an increased number of short RLs as well as an increased number of long RLs. He concluded that, if limits are to behave like known limits, the number of samples in phase I should be at least 400/(n 1). Jensen et al. (2006) conducted a literature survey of the e↵ects of parameter estimation on controlchart properties and identified some issues for future research. One of their main recommendations is to study robust or alternative estimators for µ and (e.g., Rocke (1989, 1992), Tatum (1997), Vargas (2003), Davis and Adams (2005)). The e↵ect of using these robust estimators on phase II should also be assessed (Jensen et al. (2006, p. 360)). These recommendations are the subject of the present paper, i.e., we will examine alternative location-estimation methods as well as the impact of these estimators on the phase II performance of the X control chart. So far the literature has proposed several alternative robust location estimators. Rocke (1989) proposed the 25% trimmed mean of the sample means, the median of the sample means, and the mean of the sample medians. Rocke (1992) gave the practical details for the construction of the charts based on these estimators. Alloway and Raghavachari (1991) constructed a control chart based on the Hodges– Lehmann estimator. Tukey (1997) and Wang et al. (2007) developed the trimean estimator, which is defined as the weighted average of the median and the two other quartiles. Finally, Jones-Farmer et al. (2009) proposed a rank-based phase I control chart. Based on this phase I control chart, they define the in-control state of a process and identify an in-control reference sample. The resultant reference sample can be used to estimate the location parameter. In this article, we compare existing and new methods for estimating the in-control µ. The collection of
Vol. 43, No. 4, October 2011
ROBUST LOCATION ESTIMATOR FOR THE X CONTROL CHART
365
methods includes robust sample statistics for location and estimation methods based on phase I control charts (cf., Jones-Farmer et al. (2009)). The methods are evaluated in terms of their mean-squared errors (MSE) and their e↵ect on the X phase II controlchart performance. We consider situations where the phase I data are uncontaminated and normally distributed, as well as various types of contaminated phase I situations.
We also consider three robust estimators proposed earlier by Rocke (1989): the median of the sample means,
The remainder of the paper is structured as follows. First, we present several phase I sample statistics for the process location and assess the MSE of the estimators. Then we describe some existing phase I control charts and present a new algorithm for phase I analysis. Following that, we present the design schemes for the X phase II control chart and derive the control limits. Next, we describe the simulation procedure and present the e↵ect of the proposed methods on the phase II performance. The final section o↵ers some recommendations.
with Mi the median of sample i; and the trimmed mean of the sample means, 2 3 k dk↵e X 1 X↵ = ⇥4 X (v) 5 , (10) k 2dk↵e
Proposed Location Estimators To understand the behavior of the estimators it is useful to distinguish two groups of disturbances, namely, di↵use and localized (cf., Tatum (1997)). Diffuse disturbances are outliers that are spread over all of the samples whereas localized disturbances a↵ect all observations in one sample. We include various types of estimators (both robust estimators and several estimation methods based on the principle of control charting) and compare them under various types of disturbances. The first subsection introduces the estimators, while the second subsection presents the MSE of the estimators. Location Estimators Recall that Xij , i = 1, 2, . . . , k and j = 1, 2, . . . , n, denote the phase I data. The Xij ’s are assumed to be independent and largely N (µ, 2 ) distributed. We denote by Xi,(v) , v = 1, 2, . . . , n, the vth order statistic in sample i. The first estimator that we consider is the mean of the sample means, 0 1 k k n X X X 1 1 @1 X= X i= Xij A . (7) k i=1 k i=1 n j=1 This estimator is included to provide a basis for comparison, as it is the most efficient estimator for normally distributed data. However, it is well known that this estimator is not robust against outliers.
Vol. 43, No. 4, October 2011
M (X) = median(X 1 , X 2 , . . . , X k );
(8)
the mean of the sample medians, M=
k 1X Mi , k i=1
(9)
v=dk↵e+1
where ↵ denotes the percentage of samples to be trimmed, dze denotes the ceiling function, i.e., the smallest integer not less than z, and X (v) denotes the vth ordered value of the sample means. In our study, we consider the 20% trimmed mean, which trims the six smallest and the six largest sample means when k = 30. Of course, other trimming percentages could have been used. In fact, we have also used 10% and 25%, but the results with 20% are representative for this estimator.
Furthermore, our analysis includes the Hodges– Lehmann estimator (Hodges and Lehmann (1963)), an estimator based on the so-called Walsh averages. The h (= n(n + 1)/2) Walsh averages of sample i are Wi,k,l = (Xi,k + Xi,l )/2, for k = 1, 2, . . . , n, l = 1, 2, . . . , n, and k l. The Hodges–Lehmann estimate for sample i, denoted by HLi , is defined as the median of the Walsh averages. Alloway and Raghavachari (1991) conducted a Monte Carlo simulation to determine whether the mean or the median of the sample Hodges–Lehmann estimates should be used to determine the final location estimate. They concluded that the mean of the sample values should be used, HL =
k 1X HLi , k i=1
(11)
and that the resulting estimate is unbiased. In this study, we also include the trimean statistic. The trimean of sample i is the weighted average of the sample median and the two other quartiles, TMi = (Qi,1 + 2Qi,2 + Qi,3 )/4, where Qi,q is the qth quartile of sample i, q = 1, 2, 3 (cf., Tukey (1997), Wang et al. (2007)). It also
www.asq.org
366
MARIT SCHOONHOVEN ET AL.
equals the average of the median and the midhinge (1/2)[Qi,2 + (Qi,1 + Qi,3 )/2] (cf., Weisberg (1992)). We use the following definitions for the quartiles: Qi,1 = Xi,(a) and Qi,3 = Xi,(b) with a = dn/4e and b = n a + 1. This means that Qi,1 and Qi,3 are defined as the second smallest and the second largest observations, respectively, for 4 n 7, and as the third smallest and the third largest values, respectively, for 8 n 11. Like the median and the midhinge, but unlike the sample mean, the trimean is a statistically resistant L-estimator (a linear combination of order statistics), with a breakdown point of 25% (see Wang et al. (2007)). According to Tukey (1977), using the trimean instead of the median gives a more useful assessment of location or centering. According to Weisberg (1992), the “statistical resistance” benefit of the trimean as a measure of the center of a distribution is that it combines the median’s emphasis on center values with the midhinge’s attention to the extremes. The trimean is almost as resistant to extreme scores as the median and is less subject to sampling fluctuations than the arithmetic mean in extremely skewed distributions. Asymptotic distributional results of the trimean can be found in Wang et al. (2007). The location estimate analyzed below is the mean of the sample trimeans, i.e., TM =
k 1X TMi . k i=1
(12)
Finally, we consider a statistic that is expected to be robust against both di↵use and localized disturbances, namely, the trimmed mean of the sample trimeans, defined by 2 3 k dk↵e X 1 TM↵ = ⇥4 TM(v) 5 , (13) k 2dk↵e v=dk↵e+1
where TM(v) denotes the vth ordered value of the TABLE 1. Proposed Location Estimators
Estimator
Notation
Mean of sample means Median of sample means Mean of sample medians
X M (X) M
20% trimmed mean of sample means Mean of sample Hodges-Lehmann Mean of sample trimeans 20% trimmed mean of sample trimeans
X 20 HL TM TM20
Journal of Quality Technology
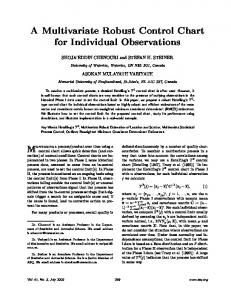
sample trimeans. We consider the 20% trimmed trimean, which trims the six smallest and the six largest sample trimeans when k = 30. The estimators outlined above are summarized in Table 1. Efficiency of the Proposed Estimators The efficiency of control-charting procedures is often evaluated by comparing the variance of the respective location estimators. We use a procedure similar to what was adopted by Tatum (1997) and consider the MSE of the estimators. The MSE will be estimated as ◆2 N ✓ i 1 X µ ˆ µ MSE = , N i=1 where µ ˆi is the value of the unbiased estimate in the ith simulation run and N is the number of simulation runs. We include the uncontaminated case, i.e., the situation where all Xij are from the N (0, 1) distribution, as well as five types of disturbances (cf., Tatum (1997)): 1. A model for di↵use symmetric variance disturbances in which each observation has a 95% probability of being drawn from the N (0, 1) distribution and a 5% probability of being drawn from the N (0, a) distribution, with a = 1.5, 2.0, . . . , 5.5, 6.0. 2. A model for di↵use asymmetric variance disturbances in which each observation is drawn from the N (0, 1) distribution and has a 5% probability of having a multiple of a 21 variable added to it, with the multiplier equal to 0.5, 1.0, . . . , 4.5, 5.0. 3. A model for localized variance disturbances in which observations in 3 out of 30 samples are drawn from the N (0, a) distribution, with a = 1.5, 2.0, . . . , 5.5, 6.0. 4. A model for di↵use mean disturbances in which each observation has a 95% probability of being drawn from the N (0, 1) distribution and a 5% probability of being drawn from the N (b, 1) distribution, with b = 0.5, 1.0, . . . , 9.0, 9.5. 5. A model for localized mean disturbances in which observations in 3 out of 30 samples are drawn from the N (a, 1) distribution, with a = 0.5, 1.0, . . . , 5.5, 6.0. The y-axis intercept in Figures 1–5 represents the
Vol. 43, No. 4, October 2011
ROBUST LOCATION ESTIMATOR FOR THE X CONTROL CHART
367
FIGURE 1. MSE of Estimators when Symmetric Di↵use Variance Disturbances Are Present for k = 30. (a) n = 5, (b) n = 9.
situation where no contaminations are present. The figures show that, in this situation, the most efficient estimator is X, as was to be expected. The estimators HL, X 20 , and TM are slightly less efficient, followed by TM20 , M , and M (X), the reason being that they use less information. When di↵use symmetric variance disturbances are present (Figure 1), the best performing estimators are HL and TM. The reason why TM performs well in this situation is that it filters out the extreme high and low values in each sample. HL also performs well because it obtains the sample statistic using the median of the Walsh averages, which is not sensitive
to outliers. M and TM20 are as efficient in the contaminated situation as in the uncontaminated situation, but they are outperformed by HL and TM because the latter estimators use more information. It is worth noting that the traditional estimator X shows relatively bad results despite the symmetric character of the outliers. M (X) and X 20 do not perform very well because these estimators focus on extreme samples whereas, in the present situation, the outliers are spread over all of the samples so that the nontrimmed samples are also infected. When asymmetric variance disturbances are present (Figure 2), the most efficient estimators are TM,
FIGURE 2. MSE of Estimators when Asymmetric Di↵use Variance Disturbances Are Present for k = 30. (a) n = 5, (b) n = 9.
Vol. 43, No. 4, October 2011
www.asq.org
368
MARIT SCHOONHOVEN ET AL.
FIGURE 3. MSE of Estimators when Localized Variance Disturbances Are Present for k = 30. (a) n = 5, (b) n = 9.
TM20 , HL, and M , performing particularly well relative to the other estimators for larger sample sizes. As for the symmetric di↵use case, the estimators that include a method to trim observations within a sample perform better than the methods that focus on sample trimming.
When di↵use mean disturbances are present (Figure 4), the results are comparable with the situation where there are di↵use asymmetric variance disturbances: M , TM20 , and TM perform best, followed by HL. Note that, in this situation, X, M (X), and X 20 perform badly.
In the case of localized variance disturbances (Figure 3), the estimators based on the principle of trimming sample means rather than withinsample observations—X 20 , TM20 , and M (X)—have the lowest MSE . The estimators X, HL, TM and, in particular, M are less successful because these statistics only perform well if no more than a few observations in a sample are infected rather than all observations, as is the case here.
When localized mean disturbances are present (Figure 5), the results are comparable with the situation where there are localized variance disturbances: the estimators based on the principle of trimming sample means, namely X 20 , M (X), and TM20 , perform best. To summarize, M , TM, and TM20 have the lowest MSE when there are di↵use disturbances. M and TM
FIGURE 4. MSE of Estimators when Di↵use Mean Disturbances Are Present for k = 30. (a) n = 5, (b) n = 9.
Journal of Quality Technology
Vol. 43, No. 4, October 2011
ROBUST LOCATION ESTIMATOR FOR THE X CONTROL CHART
369
FIGURE 5. MSE of Estimators when Localized Mean Disturbances Are Present for k = 30. (a) n = 5, (b) n = 9.
lose their efficiency advantage when contaminations take the form of localized mean or variance disturbances. In such situations, M (X), X 20 , and TM20 , which involve trimming the sample means, perform relatively well. It is worth noting that TM20 has the best performance overall because it is reasonably robust against all types of contaminations.
Proposed Phase I Control Chart Location Estimators In-control process parameters can be obtained not only via robust statistics but also via phase I control charting. In the latter case, control charts are used retrospectively to study a historical dataset and determine samples that are deemed out of control. Estimates of the process parameters are then based on the in-control samples. In this section, we consider several phase I analyses based on the principle of control charting in order to generate robust estimates of process location. We study the phase I control chart based on the commonly used estimator X and a phase I control chart based on the mean rank proposed by Jones-Farmer et al. (2009). Moreover, we propose two new types of phase I analyses. The next section presents the various phase I control charts and the following section shows the MSE of the proposed estimation methods. Phase I Control Charts The standard procedure in practice is to use the estimator X for constructing the X phase I controlchart limits. The respective upper and lower control d limits of the phase I chart are given by UCL = X
Vol. 43, No. 4, October 2011
p p d X + 3ˆ / n and LCL = X 3ˆ / n, where we X estimate by the robust standard-deviation estimator proposed by Tatum (1997), using the corrected normalizing constants presented in Schoonhoven et al. (2011). The samples for which X i falls above d X¯ or below LCL d X¯ are eliminated from the phase UCL I dataset. The final location estimate is the mean of the sample means of the remaining samples: 0
X =
1 X X i ⇥ILd ¯ i UCL d (X i ), CL X k0 X X
(14)
i✏K
with K the set of samples that are not excluded, k0 the number of nonexcluded samples, and I the indicator function. In the following, this adaptive trimmed mean estimator is denoted by ATM . X
We also consider a phase I analysis that is based on the mean rank proposed by Jones-Farmer et al. (2009). It is a nonparametric estimation method, in which the observations from the k mutually exclusive samples of size n are treated as a single sample of N = n ⇥ k observations. Let Rij = 1, 2, . . . , N denote the integer rank of observationPXij in the ¯ i = ( n Rij )/n pooled sample of size N . Let R j=1 be the mean of the ranks in sample i. If the process is in control, the ranks should be distributed evenly throughout the samples. For an in-control process, ¯ i are the mean and variance of R ¯i) = E(R and ¯i) = Var(R
(N
N +1 2 n)(N + 1) . 12n www.asq.org
370
MARIT SCHOONHOVEN ET AL.
According to the central limit theorem, the random variable ¯ i E(R ¯i) R Zi = p ¯i) var(R
follows approximately a standard normal distribution for large values of n. A control chart for these Zi ’s can be constructed with center line equal to 0, upper control limit 3, and lower control limit 3. The samples with Zi outside the phase I control limits are considered to be out of control and are excluded from the dataset. The location estimate is based on the mean of the remaining sample means, ⇤ 1 X X = ⇤ X i ⇥I 3Zi 3 (Zi ), (15) k ⇤ i✏K
with K the set of samples that are not excluded and k⇤ the number of nonexcluded samples. This estimation method is denoted by ATMM R . ⇤
We now present two new phase I analyses based on the principle of control charting. For the first method, we build a phase I control chart using a robust estimator. The advantage of a robust estimator over a sensitive estimator like X is that the phase I control limits are not a↵ected by any disturbances so that the correct out-of-control observations are filtered out in phase I. An estimator shown to be very robust by the MSE study in the previous section is TM20 . A disadvantage is that the estimator is not very efficient under normality. To address this, we use TM20 to construct the phase I limits with which we screen X i for disturbances, but then use the efficient estimator X to obtain the location estimate from the remaining samples. The phase I conp d trol limits are given by UCL TM20 = TM20 + 3ˆ / n p d and LCL = TM20 3ˆ / n, where we estimate TM20
by Tatum’s estimator. We then plot the X i ’s on the phase I control chart. The samples for which X i falls outside the limits are regarded as out of control and removed from the dataset. The remaining samples are used to determine the grand sample mean, # 1 X X = # X i ⇥ILd ¯ i UCL d TM20 (X i ), CLTM X k 20 i✏K #
(16) with K # the set of samples that are not excluded and k# the number of nonexcluded samples. The resulting estimator is denoted by ATMTM20 . The fourth type of phase I control chart resembles
Journal of Quality Technology
the chart presented above but employs a di↵erent method to screen for disturbances. The procedure consists of two steps. In the first step, we construct the control chart with limits as we did just before. Note that, for the sake of practical applicability, we use the same factor, namely 3, to derive the X and TM charts. We then plot the TMi ’s of the phase I samples on the control chart. Charting the TMi ’s instead of the X i ’s ensures that localized disturbances are identified and samples that contain only one single outlier are retained. A location estimate that is expected to be robust against localized mean disturbances is the mean of the sample trimeans of the samples that fall between the control limits 1 X 0 TM = ^ TMi ⇥ILd d TM20(TMi ), CLTM TMi UCL k 20 i✏K ^
with K the set of samples that are not excluded and k^ the number of nonexcluded samples. ^
Although the remaining phase I samples are expected to be free from localized mean disturbances, they could still contain di↵use disturbances. To eliminate such disturbances, the second step is to screen the individual observations using a phase I individual control chart with respective upper and lower 0 d 0 = TM + 3ˆ and control limits given by UCL TM 0 d 0 LCL = TM 3ˆ , where is estimated by TM Tatum’s estimator. The observations Xij that fall d d 0 or below LCL 0 are considered out above UCL TM TM of control and removed from the phase I dataset. The final estimate is the mean of the sample means and is calculated from the observations deemed to be in control, 00 1 X 1 X X = 00 Xij ⇥ILd d TM0(Xij ), CLTM0 Xij UCL k n0 i✏K 00
i j✏N 0 i
(17) with K 00 the set of samples that are not excluded, k00 the number of nonexcluded samples, Ni0 the set of observations that are not excluded in sample i, and n0i the number of nonexcluded observations in sample i. Note that we could also have used the double sum, divided by the sum of the n0i . The advantage of the applied procedure is that, when a sample is infected by a localized disturbance, the disturbance will have a lower impact on the final location estimate when it is not detected. This estimation method is denoted by ATMTM0 .
Vol. 43, No. 4, October 2011
ROBUST LOCATION ESTIMATOR FOR THE X CONTROL CHART TABLE 2. Proposed Phase I Analyses
Phase I analyses
Notation
X control chart with screening Mean rank control chart with screening TM20 control chart with screening
ATM X ATMM R ATMTM20
0
TM control chart with screening
ATMTM0
The proposed phase I analyses are summarized in Table 2. Efficiency of the Proposed Phase I Control Charts To determine the efficiency of the proposed phase I control charts, we consider the five types of contaminations defined in our MSE study of the statistics presented in the previous section. The MSE results for the phase I control charts are given in Figures 6– 10. To facilitate comparison, we have also included the MSE of the estimators X and TM20 . The figures show that the standard phase I analysis method, ATM , performs almost as well as X X under normality when no contaminations are present and seems to be robust against localized variance disturbances. However, the method loses efficiency in the other situations. Because X, the initial estimate of µ, is highly sensitive to disturbances, the phase I limits are biased and fail to identify the correct outof-control samples.
371
The mean rank method, denoted by ATMM R , performs well under normality and when there are localized mean disturbances. The reason is that this estimator screens for samples with a mean rank significantly higher than that of the other samples. On the other hand, ATMM R performs badly when diffuse outliers are present. The mean rank is not influenced by extreme occasional outliers so that samples containing only one outlier are not filtered out and hence are included in the calculation of the grand sample mean. The third method, ATMTM20 , which uses the robust estimator TM20 to construct a phase I control chart, seems to be more efficient under normality than TM20 itself. The gain in efficiency can be explained by the use of an efficient estimator to obtain the final location estimate once screening is complete. Thus, an efficient phase I analysis does not require the use of an efficient estimator to construct the phase I control chart. The final method, ATMTM0 , which first screens for localized disturbances and then for occasional outliers, far outperforms all estimation methods. The method is particularly powerful in the presence of di↵use disturbances because its use of an individual control chart in phase I to identify single outliers increases the probability that such disturbances will be detected. For example, Figure 9 represents the situation where di↵use mean disturbances are present. The efficiency of the estimator improves for high b values because the disturbances are more likely to
FIGURE 6. MSE of Estimators when Symmetric Di↵use Variance Disturbances Are Present for k = 30. (a) n = 5, (b) n = 9.
Vol. 43, No. 4, October 2011
www.asq.org
372
MARIT SCHOONHOVEN ET AL.
FIGURE 7. MSE of Estimators when Asymmetric Di↵use Variance Disturbances Are Present for k = 30. (a) n = 5, (b) n = 9.
fall outside the control limits and are therefore more likely to be detected.
Derivation of the Phase II Control Limits We now turn to the e↵ect of the proposed location estimators on the X control-chart performance in phase II. The formulas for the X control limits with estimated limits are given by Equation (2). For the phase II control limits, we only estimate the incontrol mean µ; we treat the in-control standard deviation as known because we want to isolate the e↵ect of estimating the location parameter. The fac-
tor Cn that is used to obtain accurate control limits when the process parameters are estimated is derived such that the probability of a false signal equals the desired probability of a false signal. Except for the estimator X, Cn cannot be obtained easily in analytic form and is therefore obtained by means of simulation. The factors are chosen such that p from Equation (5) is equal to 0.0027 under normality. Fifty thousand simulation runs are used. For k = 30, n = 5, and n = 9, the resulting factors are equal to 3.05 for X, ATM , ATMTM20 , and ATMTM0 ; 3.06 X
for X 20 and TM and 3.07 for M (X), M , HL, TM20 and ATMM R .
FIGURE 8. MSE of Estimators when Localized Variance Disturbances Are Present for k = 30. (a) n = 5, (b) n = 9.
Journal of Quality Technology
Vol. 43, No. 4, October 2011
ROBUST LOCATION ESTIMATOR FOR THE X CONTROL CHART
373
FIGURE 9. MSE of Estimators when Di↵use Mean Disturbances Are Present for k = 30. (a) n = 5, (b) n = 9.
Control-Chart Performance In this section we evaluate the e↵ect on X phase II performance of the proposed location statistics and estimation methods based on phase I control charting. We consider the same phase I situations as those used to assess the MSE with a, b and the multiplier equal to 4 to simulate the contaminated case (cf. the section entitled Efficiency of Proposed Estimators). Following Jensen et al. (2006), we use the unconditional run- length distribution to assess performance. Specifically, we look at several characteristics of that distribution, namely the average run length (ARL) and the standard deviation of the run length (SDRL). In addition, we also give the probability that one sample gives a signal (p). We compute
these characteristics in an in-control and several outof-control situations. We consider di↵erent shifts of size in the mean, setting equal to 0, 0.5, 1, and 2. The performance characteristics are obtained by simulation. The next section describes the simulation method, followed by the results for the control charts constructed in the uncontaminated situation and various contaminated situations. Simulation Procedure The performance characteristics p and ARL for estimated control limits are determined by averaging the conditional characteristics, i.e., the characteristics for a given set of estimated control limits, over all possible values of the control limits. Recall the definitions of P (Fi | µ ˆ, ˆ ) from Equation (3),
FIGURE 10. MSE of Estimators when Localized Mean Disturbances Are Present for k = 30. (a) n = 5, (b) n = 9.
Vol. 43, No. 4, October 2011
www.asq.org
374
MARIT SCHOONHOVEN ET AL. TABLE 3. p, ARL, and (in Parentheses) SDRL of Corrected Limits Under Normality and when Symmetric Variance Disturbances Are Present for k = 30
ARL and SDRL
p n µ ˆ N (0, 1)
5 X M (X) M X 20 HL TM TM20 ATM X ATMM R ATMTM20 ATMTM0 9 X M (X) M X 20 HL TM TM20 ATM X ATMM R ATMTM20 ATMTM0
N (0, 1) & N (0, 4) (symm occ)
5 X M (X) M X 20 HL TM TM20 ATM X ATMM R ATMTM20 ATMTM0
Journal of Quality Technology
=0
= 0.5
=1
=2
=0
= 0.5
=1
=2
0.0027 0.0027 0.0027
0.029 0.028 0.028
0.21 0.21 0.21
0.92 0.91 0.91
384 (392) 41.7 (49.4) 5.03 (4.90) 1.09 (0.32) 390 (406) 46.2 (59.9) 5.31 (5.43) 1.10 (0.33) 392 (407) 45.9 (59.0) 5.29 (5.37) 1.10 (0.33)
0.0027 0.0027 0.0027 0.0027 0.0027 0.0027 0.0027 0.0027
0.028 0.029 0.028 0.028 0.029 0.029 0.029 0.029
0.21 0.21 0.21 0.21 0.21 0.21 0.21 0.21
0.92 0.92 0.92 0.92 0.92 0.92 0.92 0.92
391 380 390 396 383 383 382 381
0.0027 0.0027 0.0027
0.064 0.063 0.063
0.48 0.47 0.47
1.00 1.00 1.00
384 (393) 17.9 (20.0) 2.13 (1.62) 1.00 (0.043) 390 (405) 19.5 (23.5) 2.19 (1.74) 1.00 (0.046) 390 (405) 19.5 (23.6) 2.19 (1.74) 1.00 (0.046)
0.0027 0.0027 0.0027 0.0027 0.0027 0.0027 0.0027 0.0027
0.063 0.064 0.063 0.062 0.064 0.064 0.064 0.064
0.48 0.48 0.48 0.47 0.48 0.48 0.48 0.48
1.00 1.00 1.00 1.00 1.00 1.00 1.00 1.00
391 380 390 395 382 382 382 380
0.0030 0.0029 0.0028
0.030 0.029 0.029
0.21 0.21 0.21
0.92 0.91 0.91
358 (375) 45.0 (60.9) 5.21 (5.44) 1.09 (0.33) 375 (395) 48.4 (67.7) 5.41 (5.77) 1.10 (0.34) 387 (403) 46.5 (61.5) 5.34 (5.52) 1.10 (0.33)
0.0028 0.0029 0.0027 0.0027 0.0030 0.0030 0.0029 0.0028
0.029 0.029 0.029 0.028 0.030 0.030 0.030 0.029
0.21 0.21 0.21 0.21 0.21 0.21 0.21 0.21
0.92 0.92 0.92 0.91 0.92 0.92 0.92 0.92
376 370 384 390 362 357 364 375
(401) (389) (400) (410) (392) (391) (391) (390)
(401) (389) (400) (409) (391) (391) (391) (390)
(392) (383) (396) (405) (378) (374) (379) (386)
43.3 42.0 43.4 45.3 41.8 41.5 41.8 42.0
18.5 18.0 18.6 19.3 17.9 17.9 18.0 18.0
45.1 43.2 44.2 46.0 44.4 45.1 44.3 42.7
(52.4) (50.4) (53.0) (56.9) (49.6) (49.1) (49.9) (50.3)
(21.1) (20.4) (21.4) (22.7) (20.1) (20.1) (20.2) (20.5)
(58.8) (54.5) (55.6) (59.2) (58.8) (61.6) (58.3) (52.8)
5.14 5.05 5.14 5.26 5.04 5.04 5.04 5.06
2.15 2.13 2.16 2.18 2.13 2.13 2.13 2.13
5.23 5.13 5.19 5.29 5.18 5.21 5.18 5.09
(5.08) (4.94) (5.09) (5.29) (4.92) (4.89) (4.92) (4.96)
(1.66) (1.63) (1.67) (1.71) (1.63) (1.63) (1.63) (1.64)
(5.35) (5.15) (5.21) (5.38) (5.33) (5.44) (5.31) (5.06)
1.09 1.09 1.09 1.09 1.09 1.09 1.09 1.09
1.00 1.00 1.00 1.00 1.00 1.00 1.00 1.00
1.09 1.09 1.09 1.10 1.09 1.09 1.09 1.09
(0.32) (0.32) (0.32) (0.33) (0.32) (0.32) (0.32) (0.32)
(0.044) (0.043) (0.045) (0.046) (0.043) (0.043) (0.043) (0.043)
(0.33) (0.32) (0.32) (0.33) (0.32) (0.33) (0.32) (0.32)
Vol. 43, No. 4, October 2011
ROBUST LOCATION ESTIMATOR FOR THE X CONTROL CHART
375
TABLE 3. Continued
ARL and SDRL
p n µ ˆ N (0, 1) & N (0, 4) (symm occ)
9 X M (X) M X 20 HL TM TM20 ATM X ATMM R ATMTM20 ATMTM0
=0
= 0.5
=1
=2
= 0.5
=1
=2
0.0030 0.0030 0.0028
0.066 0.065 0.063
0.48 0.47 0.47
1.00 1.00 1.00
358 (375) 19.1 (24.0) 2.17 (1.73) 1.00 (0.045) 371 (393) 20.6 (27.5) 2.23 (1.83) 1.00 (0.048) 386 (403) 19.8 (24.5) 2.20 (1.75) 1.00 (0.047)
0.0029 0.0028 0.0027 0.0027 0.0030 0.0031 0.0030 0.0028
0.064 0.064 0.063 0.063 0.066 0.066 0.066 0.064
0.48 0.48 0.48 0.47 0.48 0.48 0.48 0.48
1.00 1.00 1.00 1.00 1.00 1.00 1.00 1.00
373 373 384 391 358 356 360 375
E(RL | µ ˆ, ˆ ) from (4), p = E(P (Fi | µ ˆ, ˆ )) from Equation (5), and ARL = E((1/P (Fi | µ ˆ, ˆ ))) from Equation (6). These expectations will be obtained by simulation: numerous datasets are generated and, for each dataset, P (Fi | µ ˆ) and E(RL | µ ˆ) are computed. Note that we take ˆ = . By averaging these values, we obtain the unconditional values. The unconditional standard deviation is determined by SDRL p = Var(RL) p = E(Var(RL | µ ˆ)) + Var(E(RL | µ ˆ)) ✓ ◆2 ✓ ◆2 1 1 = 2E E P (Fi | µ ˆ) P (Fi | µ ˆ) !1/2 1 E . P (Fi | µ ˆ) Enough replications of the above procedure were performed to obtain sufficiently small relative estimated standard errors for p and ARL. The relative estimated standard error is the estimated standard error of the estimate relative to the estimate. The relative standard error of the estimates is never higher than 0.60%. Results First, we consider the situation where the process follows a normal distribution and the phase I data are not contaminated. We investigate the impact of
Vol. 43, No. 4, October 2011
=0
(389) (385) (397) (406) (375) (374) (376) (386)
19.4 18.4 18.8 19.4 19.2 19.1 19.0 18.3
(24.1) (21.5) (22.1) (23.3) (24.0) (24.1) (23.5) (21.3)
2.18 2.14 2.16 2.19 2.17 2.17 2.16 2.14
(1.74) (1.66) (1.69) (1.74) (1.73) (1.73) (1.71) (1.65)
1.00 1.00 1.00 1.00 1.00 1.00 1.00 1.00
(0.046) (0.044) (0.045) (0.046) (0.046) (0.046) (0.046) (0.044)
the estimator used to estimate µ in phase I. Table 3 presents the probability of one sample showing a signal (p) and the average run length (ARL) when the process mean equals µ + . When = 0, the process is in control, so we want p to be as low as possible and ARL to be as high as possible. When 6= 0, i.e., in the out-of-control situation, we want to achieve the opposite. We can see that, in the absence of any contamination (first part of Table 3), the efficiency of the estimators is very similar. We can therefore conclude that using a more robust location estimator does not have a substantial impact on the control-chart performance in the uncontaminated situation. The phase II control charts based on the estimation methods M (X), X 20 , TM20 , ATM , and X ATMM R perform relatively well when localized disturbances are present, while the charts based on M , HL, TM, and TM20 perform relatively well when diffuse disturbances are present (cf., Tables 3–5). The phase II chart based on ATMTM0 performs best: this chart is as efficient as X in the uncontaminated normal situation and its performance does not change much when contaminations come into play. Moreover, the chart outperforms the other methods in all situations because it successfully filters out both di↵use and localized disturbances. In the presence of asymmetric disturbances, in particular, the added value of this estimation method is substantial.
www.asq.org
376
MARIT SCHOONHOVEN ET AL. TABLE 4. p, ARL and (in Parentheses) SDRL of Corrected Limits when Asymmetric Variance or Localized Variance Disturbances Are Present for k = 30
ARL and SDRL
p n µ ˆ N (0, 1) & N (0, 4) (asymm occ)
5 X M (X) M X 20 HL TM TM20 ATM X ATMM R ATMTM20 ATMTM0 9 X M (X) M X 20 HL TM TM20 ATM X ATMM R ATMTM20 ATMTM0
N (0, 1) & N (0, 4) (localized)
5 X M (X) M X 20 HL TM TM20 ATM X ATMM R ATMTM20 ATMTM0
Journal of Quality Technology
=0
= 0.5
=1
=2
=0
= 0.5
=1
=2
0.0076 0.0034 0.0029
0.012 0.019 0.022
0.12 0.16 0.18
0.82 0.88 0.90
233 (295) 143 (210) 12.8 (24.0) 1.23 (0.60) 347 (378) 77.0 (110) 7.34 (8.26) 1.14 (0.41) 374 (395) 61.6 (82.4) 6.32 (6.73) 1.12 (0.37)
0.0034 0.0033 0.0030 0.0029 0.0034 0.0076 0.0032 0.0028
0.018 0.020 0.021 0.022 0.020 0.012 0.021 0.025
0.16 0.17 0.17 0.18 0.17 0.12 0.17 0.20
0.88 0.89 0.89 0.90 0.89 0.82 0.89 0.91
337 340 365 379 334 232 347 373
0.011 0.0044 0.0031
0.020 0.035 0.048
0.27 0.36 0.42
0.99 0.99 1.00
175 (239) 89.5 (148) 4.58 (6.42) 1.01 (0.12) 299 (346) 42.1 (63.4) 3.04 (2.89) 1.01 (0.077) 366 (389) 26.8 (34.1) 2.51 (2.12) 1.00 (0.058)
0.0047 0.0033 0.0031 0.0030 0.0046 0.011 0.0039 0.0028
0.033 0.044 0.046 0.047 0.035 0.021 0.039 0.055
0.35 0.41 0.42 0.42 0.36 0.27 0.38 0.45
0.99 1.00 1.00 1.00 0.99 0.99 1.00 1.00
280 336 356 368 282 175 307 370
0.0034 0.0028 0.0037
0.032 0.029 0.033
0.22 0.21 0.22
0.91 0.91 0.91
337 (361) 48.7 (73.0) 5.42 (6.09) 1.10 (0.34) 382 (400) 47.4 (64.2) 5.40 (5.66) 1.10 (0.33) 335 (372) 57.2 (98.5) 5.90 (7.45) 1.11 (0.36)
0.0028 0.0035 0.0035 0.0028 0.0028 0.0033 0.0028 0.0028
0.029 0.032 0.032 0.029 0.029 0.031 0.029 0.029
0.21 0.22 0.22 0.21 0.21 0.22 0.21 0.21
0.92 0.91 0.91 0.91 0.92 0.92 0.92 0.92
382 332 338 387 371 342 371 372
(366) (363) (384) (398) (359) (294) (367) (385)
(324) (358) (378) (391) (322) (240) (339) (383)
(395) (358) (368) (403) (382) (364) (384) (384)
75.9 (103) 67.3 (90.4) 61.2 (69.2) 60.4 (78.7) 70.0 (95.0) 143 (209) 62.9 (82.9) 48.9 (60.2)
42.7 (61.0) 27.9 (33.9) 26.4 (31.9) 26.8 (33.2) 39.6 (57.4) 89.3 (148) 33.3 (44.1) 21.4 (24.9)
44.3 50.0 52.3 46.6 43.1 47.7 42.9 43.0
(55.8) (76.8) (83.4) (61.7) (53.7) (69.5) (53.8) (53.7)
7.22 6.73 6.33 6.26 6.86 13.0 6.46 5.53
3.09 2.57 2.51 2.52 2.98 4.58 2.77 2.30
5.21 5.46 5.62 5.36 5.12 5.34 5.12 5.11
(7.91) (7.36) (6.61) (6.56) (7.51) (26.7) (6.84) (5.55)
(2.89) (2.15) (2.08) (2.11) (2.76) (6.41) (2.44) (1.83)
(5.25) (6.22) (6.63) (5.55) (5.13) (5.83) (5.13) (5.10)
1.14 1.13 1.12 1.12 1.13 1.24 1.12 1.10
1.01 1.00 1.00 1.00 1.01 1.01 1.00 1.00
1.09 1.10 1.10 1.10 1.09 1.10 1.09 1.09
(0.41) (0.39) (0.37) (0.37) (0.39) (0.61) (0.38) (0.34)
(0.078) (0.059) (0.057) (0.058) (0.074) (0.12) (0.066) (0.050)
(0.32) (0.34) (0.35) (0.33) (0.32) (0.33) (0.32) (0.32)
Vol. 43, No. 4, October 2011
ROBUST LOCATION ESTIMATOR FOR THE X CONTROL CHART
377
TABLE 4. Continued
ARL and SDRL
p n µ ˆ N (0, 1) & N (0, 4) (localized)
9
=0
= 0.5
=1
=2
=0
= 0.5
=1
=2
X M (X) M
0.0034 0.0028 0.0038
0.068 0.064 0.069
0.48 0.47 0.47
1.00 1.00 1.00
337 (362) 20.4 (28.6) 2.21 (1.84) 1.00 (0.048) 381 (400) 19.9 (25.0) 2.21 (1.78) 1.00 (0.047) 332 (370) 24.0 (40.4) 2.32 (2.12) 1.00 (0.054)
X 20 HL TM TM20 ATM X ATMM R ATMTM20 ATMTM0
0.0028 0.0035 0.0035 0.0028 0.0028 0.0033 0.0028 0.0029
0.064 0.069 0.068 0.063 0.065 0.068 0.065 0.065
0.48 0.48 0.48 0.47 0.48 0.48 0.48 0.48
1.00 1.00 1.00 1.00 1.00 1.00 1.00 1.00
382 333 338 385 372 342 372 368
When localized mean disturbances are present, we see a strange phenomenon for the X, M , HL, and TM charts: the in-control ARL is lower than the outof-control ARL for = 0.5. In other words, these charts are more likely to give a signal in the in-control situation than in the out-of-control situation for = 0.5 and hence, in the presence of disturbances, are highly ARL-biased (cf., Jensen et al. (2006)).
Concluding Remarks In this article, we have considered several phase I estimators of the location parameter for use in establishing phase II control limits of X charts. The collection includes robust estimators proposed in the existing literature as well as several phase I analyses, which apply a control chart retrospectively to study a historical dataset. The MSE of the estimators has been assessed under various circumstances: the uncontaminated situation and various situations contaminated with di↵use symmetric and asymmetric variance disturbances, localized variance disturbances, di↵use mean disturbances, and localized mean disturbances. Moreover, we have investigated the e↵ect of the location estimator on the X phase II control-chart performance when the methods are used to determine the phase II limits. The standard methods su↵er from a number of problems. Estimators that are based on the principle of trimming individual observations (e.g., M and TM) perform reasonably well when there are di↵use
Vol. 43, No. 4, October 2011
(395) (359) (368) (402) (384) (364) (384) (381)
18.9 20.8 21.8 19.7 18.4 20.0 18.4 18.6
(22.3) (30.1) (32.7) (24.2) (21.6) (27.2) (21.7) (22.2)
2.17 2.22 2.25 2.20 2.15 2.20 2.15 2.15
(1.69) (1.88) (1.94) (1.76) (1.67) (1.81) (1.67) (1.68)
1.00 1.00 1.00 1.00 1.00 1.00 1.00 1.00
(0.045) (0.049) (0.051) (0.047) (0.044) (0.048) (0.044) (0.045)
disturbances but not when localized disturbances are present. In the latter situation, estimators that are based on the principle of trimming samples (e.g., M (X) and X 20 ) are efficient. All of these methods are biased when there are asymmetric disturbances, as the trimming principle does not take into account the asymmetry of the disturbance. A phase I analysis, using a control chart to study a historical dataset retrospectively and trim the data adaptively, does take into account the distribution of the disturbance and is therefore very suitable for use during the estimation of µ. However, the standard method based on the X phase I control chart has certain limitations. First, the initial estimate, X, is very sensitive to outliers so that the phase I limits are biased. As a consequence, the wrong data samples are often filtered out. Second, the sample mean is usually plotted on the phase I control chart, which makes it difficult to detect outliers in individual observations. Moreover, deleting the entire sample instead of the single outlier reduces efficiency. In this article, we have proposed a new type of phase I analysis that addresses the problems encountered in the standard phase I analysis. The initial estimate of µ for the phase I control chart is based on a trimmed version of the trimean, namely, TM20 , and a subsequent procedure for both sample screening and outlier screening (resulting in ATMTM0 ). The proposed method is efficient under normality and far outperforms the existing methods when disturbances
www.asq.org
378
MARIT SCHOONHOVEN ET AL. TABLE 5. p, ARL and (in Parentheses) SDRL of Corrected Limits when Di↵use Mean or Localized Mean Disturbances Are Present for k = 30
ARL and SDRL
p n µ ˆ N (0, 1) & N (4, 1) (asymm occ)
5 X M (X) M X 20 HL TM TM20 ATM X ATMM R ATMTM20 ATMTM0 9 X M (X) M X 20 HL TM TM20 ATM X ATMM R ATMTM20 ATMTM0
N (0, 1) & N (4, 1) (localized)
5 X M (X) M X 20 HL TM TM20 ATM X ATMM R ATMTM20 ATMTM0
Journal of Quality Technology
=0
= 0.5
=1
=2
=0
= 0.5
=1
=2
0.0061 0.0048 0.0033
0.011 0.014 0.019
0.11 0.13 0.16
0.83 0.85 0.88
224 (271) 289 (340) 351 (380)
137 (182) 10.9 (12.9) 1.22 (0.53) 115 (168) 9.57 (12.2) 1.19 (0.49) 74.6 (103) 7.12 (7.89) 1.14 (0.41)
0.0049 0.0042 0.0035 0.0032 0.0055 0.0061 0.0052 0.0031
0.013 0.015 0.017 0.019 0.012 0.011 0.013 0.024
0.13 0.14 0.15 0.16 0.12 0.11 0.12 0.19
0.85 0.86 0.88 0.88 0.84 0.83 0.85 0.90
271 290 333 356 245 224 257 356
115 (158) 93.0 (126) 77.8 (103) 72.5 (97.0) 123 (167) 136 (182) 116 (159) 57.0 (78.1)
0.0089 0.0074 0.0035
0.018 0.023 0.041
0.26 0.29 0.39
0.99 0.99 1.00
161 (208) 212 (274) 339 (371)
77.3 (107) 4.17 (4.16) 1.01 (0.11) 71.7 (111) 3.96 (4.17) 1.01 (0.10) 32.4 (42.7) 2.72 (2.39) 1.00 (0.065)
0.0075 0.0046 0.0037 0.0035 0.0081 0.0089 0.0074 0.0031
0.021 0.033 0.038 0.039 0.020 0.019 0.022 0.051
0.28 0.35 0.38 0.38 0.28 0.26 0.29 0.43
0.99 0.99 1.00 1.00 0.99 0.99 0.99 1.00
193 272 317 336 177 162 193 352
68.9 (98.5) 39.6 (51.4) 33.6 (42.7) 32.9 (42.0) 71.0 (99.9) 77.8 (108) 64.9 (91.2) 24.5 (30.7)
0.017 0.0031 0.017
0.0034 0.021 0.0033
0.046 0.70 0.17 0.89 0.045 0.69
72.3 (87.5) 329 (351) 25.0 (28.8) 1.45 (0.83) 366 (389) 66.0 (89.3) 6.62 (7.15) 1.13 (0.38) 80.1 (105) 343 (372) 27.3 (33.6) 1.47 (0.86)
0.0030 0.017 0.017 0.0031 0.0028 0.0028 0.0028 0.0028
0.020 0.0034 0.0033 0.019 0.026 0.029 0.029 0.029
0.17 0.047 0.046 0.16 0.20 0.21 0.21 0.21
360 72.8 75.6 360 373 378 378 375
0.89 0.70 0.69 0.89 0.91 0.92 0.92 0.92
(316) (326) (361) (383) (392) (272) (302) (374)
(246) (310) (349) (368) (227) (209) (242) (371)
(379) (89.3) (94.4) (385) (385) (388) (388) (386)
64.8 327 337 70.4 47.5 42.1 42.8 43.4
(81.8) (350) (362) (92.0) (49.1) (50.9) (52.1) (53.4)
9.52 8.22 7.33 7.00 10.0 10.9 9.58 6.01
3.91 3.00 2.79 2.75 3.98 4.16 3.80 2.42
6.57 25.2 26.0 6.89 5.44 5.08 5.12 5.14
(11.2) (9.18) (7.95) (7.57) (12.0) (12.9) (11.2) (6.39)
(3.90) (2.69) (2.43) (2.40) (3.96) (4.15) (3.73) (2.00)
(6.81) (29.2) (30.7) (7.32) (5.47) (4.99) (5.07) (5.11)
1.19 1.16 1.14 1.13 1.20 1.21 1.19 1.11
1.01 1.01 1.00 1.00 1.01 1.01 1.00 1.00
1.13 1.45 1.46 1.13 1.10 1.09 1.09 1.09
(0.49) (0.45) (0.41) (0.40) (0.51) (0.53) (0.49) (0.36)
(0.10) (0.074) (0.067) (0.066) (0.10) (0.11) (0.098) (0.054)
(0.38) (0.83) (0.84) (0.40) (0.33) (0.32) (0.32) (0.32)
Vol. 43, No. 4, October 2011
ROBUST LOCATION ESTIMATOR FOR THE X CONTROL CHART
379
TABLE 5. Continued
ARL and SDRL
p n µ ˆ N (0, 1) & N (4, 1) (localized)
9 X M (X) M X 20 HL TM TM20 ATM X ATMM R ATMTM20 ATMTM0
=0
= 0.5
=1
=2
0.035 0.0031 0.034
0.0039 0.048 0.0039
0.11 0.42 0.11
0.96 1.00 0.95
34.3 (30.7) 293 (321) 10.1 (10.7) 1.04 (0.22) 366 (389) 26.8 (34.3) 2.51 (2.12) 1.00 (0.058) 37.9 (48.5) 308 (346) 10.8 (12.3) 1.05 (0.23)
0.0030 0.035 0.034 0.0031 0.0029 0.0028 0.0028 0.0028
0.046 0.0039 0.0039 0.044 0.055 0.064 0.063 0.063
0.41 0.11 0.11 0.41 0.45 0.48 0.48 0.48
1.00 0.96 0.96 1.00 1.00 1.00 1.00 1.00
359 34.5 35.7 361 366 377 378 376
are present. Consequently, ATMTM0 is a very e↵ective method for estimating µ for the X phase II chart limits.
=0
(379) (40.8) (43.1) (385) (380) (387) (388) (386)
= 0.5
26.3 293 301 28.4 21.7 18.2 18.4 18.6
(31.5) (322) (333) (35.4) (25.9) (20.9) (21.1) (21.5)
=1
2.51 10.1 10.4 2.58 2.30 2.14 2.15 2.16
(2.07) (10.9) (11.4) (2.18) (1.85) (1.64) (1.66) (1.67)
=2
1.00 1.05 1.05 1.00 1.00 1.00 1.00 1.00
(0.057) (0.22) (0.22) (0.060) (0.050) (0.044) (0.044) (0.044)
Estimated Limits for X and X Control Charts”. Journal of Quality Technology 25, pp. 237–247. Rocke, D. M. (1989). “Robust Control Charts”. Technometrics 31, pp. 173–184. Rocke, D. M. (1992). “X Q and RQ Charts: Robust Control Charts”. The Statistician 41, pp. 97–104. Schoonhoven, M.; Riaz, M.; and Does, R. J. M. M. (2011). “Design and Analysis of Control Charts for Standard Deviation with Estimated Parameters”. Journal of Quality Technology 43, pp. 307–333. Tatum, L. G. (1997). “Robust Estimation of the Process Standard Deviation for Control Charts”. Technometrics 39, pp. 127–141. Tukey, J. W. (1997). Exploratory Data Analysis. Reading, MA: Addison-Wesley. Vargas, J. A. (2003). “Robust Estimation in Multivariate Control Charts for Individual Observations”. Journal of Quality Technology 35, pp. 367–376. Vining, G. (2009). “Technical Advice: Phase I and Phase II Control Charts”. Quality Engineering 21, pp. 478–479. Wang, T.; Li, Y.; and Cui, H. (2007). “On Weighted Randomly Trimmed Means”. Journal of Systems Science and Complexity 20, pp. 47–65. Weisberg, H. F. (1992). Central Tendency and Variability. Sage University Paper Series on Quantitative Application in Social Sciences, series no. 07-038, pp. 7–83. Newbury Park, CA. Woodall, W. H. and Montgomery, D. C. (1999). “Research Issues and Ideas in Statistical Process Control”. Journal of Quality Technology 31, pp. 376–386.
Acknowledgments The authors thank the Editor and two Referees for their comments and suggestions. It has improved the paper substantially.
References Alloway, J. A., Jr. and Raghavachari, M. (1991). “Control Chart Based on the Hodges–Lehmann Estimator”. Journal of Quality Technology 23, pp. 336–347. Davis, C. M. and Adams, B. M. (2005). “Robust Monitoring of Contaminated Data”. Journal of Quality Technology 37, pp. 163–174. Hodges, J. L. and Lehmann, E. L. (1963). “Estimates of Location Based on Rank Tests”. The Annals of Mathematical Statistics 34, pp. 598–611. Jensen, W. A.; Jones-Farmer, L. A.; Champ, C. W.; and Woodall, W. H. (2006). “E↵ects of Parameter Estimation on Control Chart Properties: A Literature Review”. Journal of Quality Technology 38, pp. 349–364. Jones-Farmer, L. A.; Jordan, V.; and Champ, C. W. (2009). “Distribution-Free Phase I Control Charts for Subgroup Location”. Journal of Quality Technology 41, pp. 304– 316. Quesenberry, C. P. (1993). “The E↵ect of Sample Size on
s
Vol. 43, No. 4, October 2011
www.asq.org


![Design schemes for the [Xmacr] control chart - Semantic Scholar](https://m.moam.info/img/260x300/design-schemes-for-the-xmacr-control-chart-semanti_5b94e5f9097c4751058b45a9.jpg)


