In this work, we design two lossy joint source-channel coding (JSCC) schemes that .... 1; memoryless Gaussian source- Decrease increase method (5 times). . 49 ..... Yj at time j is affected via the additive noise Zj, which is assumed to be independent ...... result, the COVQ is expected to be more robust to noisy channels, in ...
Robust Lossy Source Coding for Correlated Fading Channels
by
Shervin Shahidi
A thesis submitted to the Department of Electrical and Computer Engineering in conformity with the requirements for the degree of Master of Applied Science
Queen’s University Kingston, Ontario, Canada September 2011
c Shervin Shahidi, 2011 Copyright
Abstract Most of the conventional communication systems use channel interleaving as well as hard decision decoding in their designs, which lead to discarding channel memory and soft-decision information. This simplification is usually done since the complexity of handling the memory or soft-decision information is rather high. In this work, we design two lossy joint source-channel coding (JSCC) schemes that do not use explicit algebraic channel coding for a recently introduced channel model, in order to take advantage of both channel memory and soft-decision information. The channel model, called the non-binary noise discrete channel with queue based noise (NBNDC-QB), obtains closed form expressions for the channel transition distribution, correlation coefficient, and many other channel properties. The channel has binary input and 2q -ary output and the noise is a 2q -ary Markovian stationary ergodic process, based on a finite queue, where q is the output’s soft-decision resolution. We also numerically show that the NBNDC-QB model can effectively approximate correlated Rayleigh fading channels without losing its analytical tractability. The first JSCC scheme is the so called channel optimized vector quantizer (COVQ) and the second scheme consists of a scalar quantizer, a proper index assignment, and a sequence maximum a posteriori (MAP) decoder, designed to harness the redundancy left in the quantizer’s indices, the channel’s soft-decision output, and noise i
time correlation. We also find necessary and sufficient condition when the sequence MAP decoder is reduced to an instantaneous symbol-by-symbol decoder, i.e., a simple instantaneous mapping.
ii
Acknowledgments First of all, I would like to express my sincere gratitude to my supervisors, Professor Fady Alajaji and Professor Tam´as Linder, for their constant support and precious comments. I will be always indebted to them for their guidance and motivation during this thesis, which will accompany me throughout my future life. I would also like to thank my parents, my sister, and my brother-in-low who have always encouraged me; without their unconditional support and patience, I would have never been able to complete this thesis. Last but not least, I am grateful of my dear friends for their help, kind support and understanding during this period. Specifically, I would like to thank my friend Saeed for all of our discussions and his useful comments during these two years, my close friends Behnam and Ali for all the fun we had together, and my friends Navid and Parisa who, although lived far away from me, were always there when I needed someone to talk to.
iii
Table of Contents
Abstract
i
Acknowledgments
iii
Table of Contents
iv
List of Tables
vi
List of Figures
xi
List of Acronyms
xii
Chapter 1: Introduction . . . . . . . . . . . . . . . . . . . . . . . . . .
1
1.1
Literature Review . . . . . . . . . . . . . . . . . . . . . . . . . . . . .
1
1.2
Thesis Contribution . . . . . . . . . . . . . . . . . . . . . . . . . . . .
2
1.3
Thesis Overview . . . . . . . . . . . . . . . . . . . . . . . . . . . . . .
4
Chapter 2: Preliminaries . . . . . . . . . . . . . . . . . . . . . . . . . .
5
2.1
Communication Channel Models . . . . . . . . . . . . . . . . . . . . .
5
2.2
Source Coding and Quantization . . . . . . . . . . . . . . . . . . . . .
17
iv
Chapter 3: Exploiting Channel Memory and Soft-Decision Information in COVQ Design . . . . . . . . . . . . . . . . . . . . . 3.1
3.2
27
Channel Optimized Vector Quantization (COVQ) . . . . . . . . . . . . . . . . . . . . . . . . . . . . . . . . . .
28
Numerical Results . . . . . . . . . . . . . . . . . . . . . . . . . . . . .
37
Chapter 4: Joint Source-Channel MAP Decoding of the NBNDC-QB 55 4.1
Sequence MAP decoding . . . . . . . . . . . . . . . . . . . . . . . . .
57
4.2
Numerical Results . . . . . . . . . . . . . . . . . . . . . . . . . . . . .
80
Chapter 5: Conclusions and Future Work . . . . . . . . . . . . . . . .
92
Bibliography . . . . . . . . . . . . . . . . . . . . . . . . . . . . . . . . . .
95
v
List of Tables 3.1
Simulated annealing parameters. . . . . . . . . . . . . . . . . . . . . .
3.2
COVQ Training SDR results (in dB) for the memoryless NBNDC-QB
37
and the highly correlated NBNDC-QB with parameters α = 1.0, M = 1; memoryless Gaussian source. . . . . . . . . . . . . . . . . . . . . . 3.3
42
COVQ Training SDR results (in dB) for the NBNDC-QB with parameters α = 1.0, M = 1 and channel correlations 0.5, 0.7 ; memoryless Gaussian source. . . . . . . . . . . . . . . . . . . . . . . . . . . . . .
3.4
43
COVQ Training SDR results (in dB) for the memoryless NBNDC-QB and the highly correlated NBNDC-QB with parameters α = 1.0, M = 1; Gauss-Markov source with correlation parameter φ = 0.9. . . . . .
3.5
44
COVQ Training SDR results (in dB) for the memoryless NBNDC-QB and the highly correlated NBNDC-QB with parameters α = 1.0, M = 1; memoryless Laplacian source. . . . . . . . . . . . . . . . . . . . . .
3.6
45
COVQ Training SDR results (in dB) for the memoryless NBNDC-QB and the highly correlated NBNDC-QB with parameters α = 0.5, M = 5; memoryless Gaussian source. . . . . . . . . . . . . . . . . . . . . .
3.7
46
COVQ Training SDR results (in dB) for the memoryless NBNDC-QB and the highly correlated NBNDC-QB with parameters α = 1.0, M = 5; memoryless Gaussian source. . . . . . . . . . . . . . . . . . . . . . vi
47
3.8
COVQ Training SDR results (in dB) for the memoryless NBNDC-QB and the highly correlated NBNDC-QB with parameters α = 2.0, M = 5; memoryless Gaussian source. . . . . . . . . . . . . . . . . . . . . .
3.9
48
COVQ Training SDR results (in dB) for the memoryless NBNDC-QB and the highly correlated NBNDC-QB with parameters α = 1.0, M = 1; memoryless Gaussian source- Decrease increase method (5 times). .
49
3.10 NBNDC parameters for fitting the Rayleigh DFC with q = 2. . . . . .
50
3.11 COVQ training results (for DFC-fitted NBNDC-QB) and simulation results (for the Rayleigh DFC) in terms of SDR (dB); memoryless Laplacian source. fD T = 0.01. . . . . . . . . . . . . . . . . . . . . . .
51
3.12 COVQ training results (for DFC-fitted NBNDC-QB) and simulation results (for the Rayleigh DFC) in terms of SDR (dB); memoryless Gaussian source. fD T = 0.005. . . . . . . . . . . . . . . . . . . . . . .
52
3.13 COVQ training results (for DFC-fitted NBNDC-QB) and simulation results (for the Rayleigh DFC) in terms of SDR (dB); Gauss-Markov source with correlation factor φ = 0.9. fD T = 0.005. . . . . . . . . . .
53
3.14 The ρ and δ values for the NBNDC-QB for soft-decision resolutions q = 1, 2, 3. . . . . . . . . . . . . . . . . . . . . . . . . . . . . . . . . . 4.1
54
Symbol error rate (in%) for MAP decoding and instantaneous mapping θ∗ for symmetric binary Markov sources with p00 = 0.5 (i.i.d. source). The channel model is the NBNDC-QB, with M = 1, Cor = 0, 0.9, and q = 1, 2, 3. The values C are calculated from (4.20).
vii
. . . . . . . . .
76
4.2
Symbol error rate (in%) for MAP decoding and instantaneous mapping θ∗ for symmetric binary Markov sources with p00 = 0.6 (symmetric Markov source). The channel model is the NBNDC-QB, with M = 1, Cor = 0, 0.9, and q = 1, 2, 3. The values C are calculated from (4.20).
4.3
77
Symbol error rate (in%) for MAP decoding and instantaneous mapping θ∗ for symmetric binary Markov sources with p00 = 0.7 (symmetric Markov source). The channel model is the NBNDC-QB, with M = 1, Cor = 0, 0.9, and q = 1, 2, 3. The values C are calculated from (4.20).
4.4
78
Symbol error rate (in%) for MAP decoding and instantaneous mapping θ∗ for symmetric binary Markov sources with p00 = 0.9 (symmetric Markov source). The channel model is the NBNDC-QB, with M = 1, Cor = 0, 0.9, and q = 1, 2, 3. The values C are calculated from (4.20).
4.5
79
SQ-MAP Training SDR results (in dB) for the memoryless NBNDCQB and the highly correlated NBNDC-QB with parameters M = 1, α = 1; memoryless Gaussian source. . . . . . . . . . . . . . . . . .
4.6
84
SQ-MAP Training SDR results (in dB) for the NBNDC-QB with parameters M = 1, α = 1, and correlations 0.5, 0.7; memoryless Gaussian source. . . . . . . . . . . . . . . . . . . . . . . . . . . . . . . . . . . .
4.7
84
SQ-MAP Training SDR results (in dB) for the memoryless NBNDCQB and the highly correlated NBNDC-QB with parameters M = 1, α = 1; Gauss-Markov source with correlation factor φ = 0.9. . . . .
4.8
85
SQ-MAP Training SDR results (in dB) for the memoryless NBNDCQB and the highly correlated NBNDC-QB with parameters M = 1, α = 1; memoryless Laplacian source. . . . . . . . . . . . . . . . . .
viii
85
4.9
SQ-MAP Training SDR results (in dB) for the memoryless NBNDCQB and the highly correlated NBNDC-QB with parameters M = 5, α = 0.5; memoryless Gaussian source. . . . . . . . . . . . . . . . .
86
4.10 SQ-MAP Training SDR results (in dB) for the memoryless NBNDCQB and the highly correlated NBNDC-QB with parameters M = 5, α = 1; memoryless Gaussian source. . . . . . . . . . . . . . . . . .
86
4.11 SQ-MAP Training SDR results (in dB) for the memoryless NBNDCQB and the highly correlated NBNDC-QB with parameters M = 5, α = 2; memoryless Gaussian source. . . . . . . . . . . . . . . . . .
87
4.12 SQ with instantaneous mapping- Training SDR results (in dB) for the memoryless NBNDC-QB and the highly correlated NBNDC-QB with parameters M = 1, α = 1; memoryless Gaussian source.
. . . . . . .
87
4.13 SQ with instantaneous mapping- Training SDR results (in dB) for the memoryless NBNDC-QB and the highly correlated NBNDC-QB with parameters M = 1, α = 1; Gauss-Markov source with correlation factor φ = 0.9. . . . . . . . . . . . . . . . . . . . . . . . . . . . . . . .
88
4.14 SQ-MAP simulation SDR results (in dB) for the DFC-fitted NBNDCQB and the DFC; memoryless Gaussian source, q = 2. . . . . . . . .
88
4.15 SQ-MAP simulation SDR results (in dB) for the DFC-fitted NBNDCQB and the DFC; Gauss-Markov source with correlation factor φ = 0.9, q = 2. . . . . . . . . . . . . . . . . . . . . . . . . . . . . . . . . . . .
89
4.16 SQ-MAP simulation SDR results (in dB) for the DFC-fitted NBNDCQB and the DFC; memoryless Laplacian source, q = 2. . . . . . . . .
ix
89
4.17 SQ-MAP simulation results in symbol error rate(%), for the DFC-fitted NBNDC-QB and the DFC; memoryless Gaussian source, q = 2. . . .
90
4.18 SQ-MAP simulation results in symbol error rate(%), for the DFC-fitted NBNDC-QB and the DFC; Gauss-Markov source with correlation factor φ = 0.9, q = 2.
. . . . . . . . . . . . . . . . . . . . . . . . . . . .
90
4.19 SQ-MAP simulation results in symbol error rate(%), for the DFC-fitted NBNDC-QB and the DFC; memoryless Laplacian source, q = 2. . . .
91
4.20 P (x) for different source distributions and SQ coding rates. . . . . . .
91
x
List of Figures 1.1
Block diagram of a separate (tandem) source and channel coding system and a joint source-channel coding system. . . . . . . . . . . . . .
2
2.1
Block diagram of a digital communication system. . . . . . . . . . . .
6
2.2
Binary symmetric channel. . . . . . . . . . . . . . . . . . . . . . . . .
8
2.3
The additive white Gaussian noise model. . . . . . . . . . . . . . . .
9
2.4
The Gilbert-Elliot channel model. . . . . . . . . . . . . . . . . . . . .
10
2.5
A queue of length M . . . . . . . . . . . . . . . . . . . . . . . . . . . .
12
2.6
An urn of numbered balls with 2q different numbers.
. . . . . . . . .
12
2.7
Rayleigh discrete fading channel, with BPSK modulation. . . . . . . .
15
2.8
Block diagram of a vector quantizer in a communication system. . . .
25
3.1
Block diagram of a COVQ system. . . . . . . . . . . . . . . . . . . .
29
4.1
Block diagram of an SQ-MAP system. . . . . . . . . . . . . . . . . .
57
4.2
FBC and NBC index assignments for an hypothetical source distribution and its quantization regions; MSB is the rightmost bit. . . . . . .
xi
58
List of Acronyms AWGN Additive White Gaussian Noise BER Bit-Error Rate BPSK Binary Phase-Shift Keying BSC Binary Symmetric Channel CC Centroid Condition COVQ Channel Optimized Vector Quantizer DFC Discrete Fading Channel DMC Discrete Memoryless Channel DMS Discrete Memoryless Source FBC Folded Binary Code GEC Gilbert-Elliott Channel i.i.d. independent and identically distributed LBG-VQ Linde-Buzo-Gray Vector Quantizer xii
MAP Maximum A Posteriori MMSE Minimum Mean Square Error MSE Mean Square Error NBC Natural Binary Code NBNDC Non-Binary Noise Discrete Channel NBNDC-QB Non-Binary Noise Discrete Channel with Queue Based noise NNC Nearest Neighbor Condition QBC Queue Based Channel SDR Signal-to-Distortion Ratio SA Simulated Annealing SNR Signal-to-Distortion Ratio SQ Scalar Quantizer VQ Vector Quantizer
xiii
Chapter 1 Introduction Looking at the recent ever increasing demands for communication systems, it is obvious that in order to meet the present needs, modern communication systems are required to become faster, more reliable, and more suitable for wireless and mobile communications. As a result, the need arises for designing systems with less delay and complexity without sacrificing reliability in wireless mobile environments. In order to design such systems, some improvements can be proposed to enhance the performance of conventional systems.
1.1
Literature Review
It is well known that the separate treatment of source and channel coding, as in Shannon’s source-channel coding theorem [31, 32], is not optimal in the presence of complexity and delay constraints. A variety of different joint-source channel coding schemes have been proposed to address this problem, such as [5, 20, 23, 26, 34] and
1
CHAPTER 1. INTRODUCTION
2
Figure 1.1: Block diagram of a separate (tandem) source and channel coding system and a joint source-channel coding system.
many others for the case of lossy coding. It is also known that the capacity of a wellbehaved (ergodic) channel with memory is strictly greater than the capacity of its memoryless counterpart channel (with identical one-dimensional transition distribution) realized by ideal (infinite) interleaving [10,37]. Consequently, given the memory statistics, a communication system can be designed to take advantage of the channel’s memory and outperform systems that discard memory information via interleaving. Furthermore, it has been shown that the channel’s soft-decision information can improve capacity and system performance over hard-decision decoded schemes (e.g., see [4, 6, 25, 33, 35].
1.2
Thesis Contribution
In this thesis we design a joint source channel-coding scheme, known as channel optimized vector quantizer (COVQ), and a joint source-channel decoding scheme, which
CHAPTER 1. INTRODUCTION
3
consists of a scalar quantizer (SQ) with a maximum a posteriori (MAP) decoder. Both systems are source centric joint source-channel coding schemes (JSCC) and have less complexity than the conventional tandem source-channel coding systems in which the problem of source coding and channel coding are dealt with separately (Figure 1.1). There are other methods of JSCC such as channel centric approaches (that use explicit channel coding) or unequal error protection approaches. Both system performances are studied for the non-binary noise discrete channel (NBNDC) and the correlated Rayleigh fading channel used with soft-decoding demodulation. The NBNDC is a channel model recently introduced in [28], where the channel has binary input and 2q -ary output, making it possible to model softquantized output channels with memory. We use the NBNDC channel with the queue-based noise, introduced in [28], as the noise process in the NBNDC model to provide closed form expressions for the channel transition distribution, and then use the obtained model as an alternative representation of a correlated Rayleigh discrete fading channel (DFC). Note that in contrast to the NBNDC with queue-based noise model (which we refer to as NBNDC-QB), for the Rayleigh DFC no closed form transition distribution expression are known for block lengths of greater than 3, so the distribution must be determined via numerical methods. We test the system designed for the NBNDC model over the equivalent correlated Rayleigh DFC to simulate its performance in wireless communications. We also obtain necessary and sufficient condition for the sequence MAP detector in the SQ-MAP system over the NBNDC-QB to reduce to an instantaneous symbolby-symbol mapping with the same sequence error probability of decoding. We show numerically that both systems can successfully exploit the channel’s
CHAPTER 1. INTRODUCTION
4
memory and soft-decision information in order to gain better signal-to-distortion ratio (SDR) performance, in contrast with systems that use interleaving and hard quantization, hence disregarding the channel’s memory and soft-decision information. We also validate numerically that the NBNDC-QB can effectively approximate the Rayleigh DFC while in spite of the Rayleigh DFC, the NBNDC-QB maintains its analytical tractability.
1.3
Thesis Overview
The organization of the thesis is as follows. In Chapter 2, we describe an overview of digital communication channel models and source coding theory. The design and study of the COVQ system is explained in Chapter 3 and the study of the SQ-MAP system is presented in Chapter 4. Chapter 5 is devoted to conclusions and future works.
Chapter 2 Preliminaries 2.1
Communication Channel Models
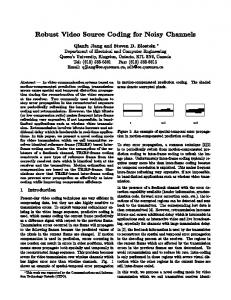
A communication channel whose input and output each have a finite alphabet is called a discrete channel. In a discrete (digital) channel model, the transmitted message is modeled as a digital signal. In contrast, in an analog channel model, the transmitted message is modeled as an analog (continuous) signal. The physical transmission of signals over a transmission medium always takes place via analog signals. As a result, in order to transmit a digital signal on a physical medium, a digital to analog conversion must take place. Similarly, an analog to digital conversion is done at the receiver to retrieve the transmitted digital data. Consider Figure 2.1 as a generic point-to-point digital communication system. As can be seen, the data symbols are discrete before they are sent through the modulator, as well as the data symbols after the demodulator. Therefore, the whole modulation process, analog channel model, and demodulation process can be considered as a black-box, performing as a digital input, digital output channel. Hence, a discrete channel can 5
CHAPTER 2. PRELIMINARIES
6
Figure 2.1: Block diagram of a digital communication system.
model an equivalent analog channel model, which uses a specific modulation scheme. From another point of view, different channel models can be classified into two large classes: memoryless channels and dynamic channels (channels with memory). A channel is said to be memoryless if the probability distribution of the output depends only on the input at that time and is conditionally independent of previous and future channel inputs or outputs [9]. For a channel which is not memoryless, we consider the case where the statistical properties of the output signal at time t depend only on the present and past transmitted signal. In the following, we review some of the well-known channel models, as well as some recently introduced channel models which are relevant to this thesis.
CHAPTER 2. PRELIMINARIES
2.1.1
7
Memoryless channels
Discrete Memoryless Channels The discrete memoryless channel (DMC) is a discrete channel with finite input alphabet X and finite output alphabet Y. Its transition probabilities, PY n |X n (y n |xn ), for any input n-tuple xn = (x1 , x2 , . . . , xn ) and received n-tuple y n = (y1 , y2 , . . . , yn ), satisfies n
n
PY n |X n (y |x ) =
n Y
PYi |Xi (yi |xi ),
(2.1)
i=1
for every n = 1, 2, . . .. A DMC is uniquely determined by the channel transition matrix Q = [P (y|x)]. Condition (2.1) is actually equivalent to the following two sets of conditions: P n
Yn |X ,Y n−1 (yn |x
n
, y n−1 ) = PY |X (yn |xn ),
∀n = 1, 2, . . . , xn , y n ;
PY n−1 |X n (y n−1 |xn ) = PY n−1 |X n−1 (y n−1 |xn−1 ), ∀n = 1, 2, . . . , xn , y n−1 . P
Yn |X n ,Y n−1 (yn |x
n
, y n−1 ) = PY |X (yn |xn ),
∀n = 1, 2, . . . , xn , y n ;
PXn |Y n−1 ,X n−1 (xn |y n−1 , xn−1 ) = PXn |X n−1 (xn |xn−1 ), ∀n = 1, 2, . . . , xn , y n−1 . These conditions imply that the current output Yn only depends on the current input Xn , but not on the past inputs X n−1 and outputs Y n−1 . Also, given the current input, the past outputs Y n−1 do not depend on the current input Xn . The current input Xn is also independent of past outputs Y n−1 given the past inputs X n−1 . A simple example for a DMC is the binary symmetric channel (BSC) depicted in Figure 2.2, which has binary input and output alphabets, and is described by the
CHAPTER 2. PRELIMINARIES
0
1
8
1−ε Q Q
ε QQ
� �
ε�
Q Q
� �
� Q �Q �
1−ε
3 ��
0
QQ s -
1
Figure 2.2: Binary symmetric channel.
transition matrix
ε 1−ε Q= . ε 1−ε It can be seen that the BSC can be described by a single parameter ε, referred to as the crossover probability.
Additive White Gaussian Noise The additive white Gaussian noise (AWGN) channel model is a well-known example of analog memoryless channels. The model is discrete in time and continuous in amplitude, with input and output alphabets X = Y = R. The output Yt at sample time t is the sum of the input Xt and the noise Zt (Figure 2.3) Yt = Xt + Zt ,
Zt ∼ N (0, N0 /2)
where the noise is white (has a constant spectral density). Thus the noise random variables, Zt , t = 1, 2, . . . , are independent and identically distributed (i.i.d.) each having a Gaussian distribution, which we assume to have zero-mean and variance N0 /2. This channel provides tractable mathematical model which is very useful in some
CHAPTER 2. PRELIMINARIES
9
Figure 2.3: The additive white Gaussian noise model.
simplified real world applications, such as single user wireline communications, but cannot model phenomena such as fading, interference, and dispersion.
2.1.2
Channels With Memory
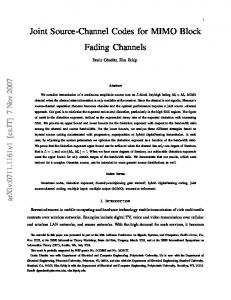
Discrete channels with memory are studied in detail in [16, p. 97-111]. A simple model, used extensively in the literature, is the Gilbert-Elliott Channel (GEC). The GEC is a varying binary symmetric channel, the crossover probabilities of which are determined by the current state of a discrete stationary binary Markov process (Figure 2.4) [24]. According to this model, the channel has two states known as the good state (with low crossover probability) and the bad state (with high crossover probability). Since the state of the channel cannot be determined from the observations, the channel is a so-called hidden Markov model. A more explicit channel with memory is the binary Markov channel, in which the channel memory is represented by an additive Markovian noise process. The output Yj at time j is affected via the additive noise Zj , which is assumed to be independent
CHAPTER 2. PRELIMINARIES
10
Figure 2.4: The Gilbert-Elliot channel model.
of the input of the channel Xj , Yj = Xj ⊕ Zj ,
j = 1, 2, 3, . . . ,
where the ⊕ represents modulo 2 addition. The noise process {Zj }∞ j=1 is a binary stationary ergodic Markov process with memory order M , generated by the finitememory contagion urn model described in [1]. More precisely, according to this model, the noise transition probabilities are given by � � P r{Zj = 1|Zj−1 = zj−1 , . . . , Z1 = z1 } = P r Zj = 1 Zj−1 = zj−1 , . . . , Zj−M = zj−M = P r{Zj = 1|
j−1 X
Zi =
i=j−M
�+ =
�P
j−1 i=j−M
1 + Mδ
j−1 X
zi }
i=j−M
� zi δ ,
where zi ∈ {0, 1}, � is the channel bit-error rate (BER), and δ determines the noise correlation via Cor = δ/(δ +1). It can be seen that letting δ = 0, the channel is equivalent to a BSC with crossover probability �. This channel can be fully characterized by the parameters δ, �, and memory order M .
CHAPTER 2. PRELIMINARIES
11
Non-Binary Noise Discrete Channel The Non-Binary Noise Discrete Channel (NBNDC) [28] is a binary-input and 2q ary-output channel model. The input data bits Xj are affected by noise Zj via the relation Yj = (2q − 1)Xj + (−1)Xj Zj ,
(2.2)
where Yj , Zj ∈ {0, 1, . . . , 2q − 1} for j = 1, 2, . . ., with {Yj } denoting the channel output process, and {Xj } denoting the channel input binary process. Also, {Zj } is the noise process assumed to be independent of {Xj }. According to (2.2), Zj can also be written in terms of input and output symbols, Zj =
Yj − (2q − 1)Xj , (−1)Xj
j = 1, 2, . . . .
(2.3)
We will extensively use this channel model in this thesis, since we are interested in taking advantage of the soft-decision information for improving the system’s performance, which is feasible using the NBNDC because it has a non-binary output. Furthermore, the number of the NBNDC’s parameters, and hence the model’s complexity, is independent of the channel noise memory order M , so that noise models with arbitrarily large memory orders can be implemented with no extra complexity. On the other hand, the complexity is exponentially proportional to the soft-decision quantization resolution q, although typical values for q are as low as 2 or 3. The noise process {Zj }∞ j=1 can in general be any stochastic process. For example, if {Zj } is a binary stationary memoryless process (hence q = 1), the NBNDC reduces to the BSC. The noise process applied in [28] (and also in this thesis), is a non-binary generalization of the queue-based (QB) noise [37]. We refer to this channel model as NBNDC-QB. The noise is modeled via a 2q -ary M th -order Markovian stationary
CHAPTER 2. PRELIMINARIES
12
ergodic process with 2q + 2 independent parameters. According to this model, at each sample time j, the noise is generated via one of the two following packages: • A queue with M cells, shown in Figure 2.5, that contains a ball in each cell. The balls are numbered, with integers ranging from 0 to 2q − 1. Each number represents an error symbol. • An urn that contains a large set of numbered balls; the same numbered balls as in the queue(Figure 2.6).
Figure 2.5: A queue of length M .
Figure 2.6: An urn of numbered balls with 2q different numbers.
CHAPTER 2. PRELIMINARIES
13
At each sample time j, a biased coin is flipped to choose one of the packages. Assume that the queue is selected with probability ε. If the queue is selected, the noise symbol is determined by selecting one of the M cells and taking the number of the ball it contains as the generated noise symbol. The probability of selecting the kth cell of the queue is chosen as 1 , if k = 1, 2, . . . , M − 1 ; M −1+α
α , M −1+α
,
α≥0
if k = M .
If the urn is selected, one of the balls will be taken out of the urn, and the ball number will determine the noise symbol. The numbered balls in the urn satisfy the probability distribution (ρ0 , ρ1 , . . . , ρ2q −1 ), i.e., a ball with number i on it is taken out of the urn with probability ρi . After the noise symbol is generated, no matter which package was selected, a ball with the same number as the generated noise symbol will be pushed in front of the queue, pushing out the ball in M th cell of the queue. The resulting QB noise process is a stationary M th order Markov source and has only 2q + 2 independent parameters: the size of the queue M , the probability distribution of the balls in the urn, and correlation parameters 0 ≤ ε < 1 and α ≥ 0. The state process of the queue based noise {Sn }∞ −∞ , which is defined by Sn , (Zn , Zn−1 , . . . , Zn−M +1 ) ∈ {0, 1, . . . , 2q − 1}M , is a homogeneous, first-order Markov process. Define the noise state transition probability by Q(sn |sn−1 ) , P r{Sn = sn |Sn−1 = sn−1 }, where
sn = (zn , zn−1 , . . . , zn−M +1 ), zn ∈ {0, 1, 2, . . . , 2q − 1}. According to [28], ! M −1 X ε Q(sn |sn−1 ) = δzn ,zn−` + αδzn ,zn−M + (1 − ε)ρzn , (2.4) M − 1 + α `=1
CHAPTER 2. PRELIMINARIES
14
where, δi,j =
1, if i = j 0, if i 6= j.
Since the noise process is independent of the input, we have P r{Y m = y m | X m = xm } = P r{Z m = z m }.
(2.5) (m)
Hence, the m-fold channel transition probability P r{Z m = z m } , PNBNDC (z m ) = P rNBNDC-QB {Z1 = z1 , Z2 = z2 , . . . , Zm = zm } is given by [28]: • For m > M
(m) PNBNDC-QB (z m )
=
m Y
[(
i−1 X
δzi ,z` + αδzi ,zi−M )
(2.6)
i=M +1 `=i−M +1
ε × + (1 − ε)ρzi ]π(z1 ,z2 ,...,zM ) , M −1+α where
q −1 ξ 2Y ` � Y
π(z1 ,z2 ,...,zM )
where ξ` =
� ε (1 − ε)ρ` + j M −1+α `=0 j=0 = M −1 � � , Y ε (1 − ε) + k M −1+α k=0
(2.7)
PM
k=1 δzk ,` ,
• For m ≤ M
q −1 ξ 0 � 2Y ` Y
� ε (1 − ε)ρ` + j M −1+α j=0 `=0 (m) PNBNDC-QB (z m ) = � , m−1 Y� ε (1 − ε) + k M −1+α k=0
(2.8)
CHAPTER 2. PRELIMINARIES
where ξ`0 =
Pm
k=1 δzk ,` .
15
(1)
Note from (2.8), for m = 1 we have PNBNDC-QB (z1 ) = ρz1 for
z1 ∈ {0, 1, . . . , 2q − 1}. Finally the channel noise correlation is given by ε
Cor =
E[Zk Zk+1 ] − E[Zk ]2 M −1+α = . ε V ar(Zk ) 1 − (M − 2 + α) M −1+α
Rayleigh Fading Channel The Rayleigh fading channel is a continuous alphabet, discrete time example for channel with memory. The channel noise affects the input data Xk , k = 1, 2, 3, . . . with both multiplicative and additive noise. The multiplicative noise Ak , k = 1, 2, 3, . . . is a sequence of Rayleigh distributed random variables (correlated in general), known as the fading coefficients, which cause an attenuation of the received signal. The additive noise is an AWGN with zero-mean and variance N0 /2. As a result, the output Yk is given by Yk = Ak Xk + Nk ,
k = 1, 2, 3, . . . .
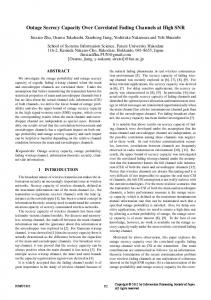
Figure 2.7: Rayleigh discrete fading channel, with BPSK modulation.
The channel setup we are using in this thesis is a discrete fading channel model (DFC) consisting of a binary phase-shift keying (BPSK) modulator, a time-correlated flat Rayleigh fading channel with additive white Gaussian noise (AWGN), and a q-bit
CHAPTER 2. PRELIMINARIES
16
soft-quantized demodulator, shown in Figure 2.7. Let the input and output alphabet be X = {0, 1} and Y = {0, 1, . . . , 2q − 1}, respectively. Denoting the DFC binary input by {Xk }, k = 1, 2, . . ., the received channel symbols are given by Rk =
p Es Ak Sk + Nk ,
k = 1, 2, . . .
where Es is the energy of signal sent over the channel, Sk = 2Xk − 1 ∈ {−1, 1} is the BPSK modulated signal and {Nk } is an additive white noise process, represented by a sequence of independent and identically distributed (i.i.d.) Gaussian random variables of variance N0 /2. {Ak } is the channel’s fading process with Ak = |Gk |, where {Gk } is a time-correlated complex wide-sense stationary Rayleigh process with autocorrelation function given by R[k] = J0 (2πfD T |k|) from Clarke’s model [8], where fD T is the normalized maximum doppler frequency and J0 (·) is the zeroth-order Bessel function of the first kind. Therefore, Ak is Rayleigh distributed, with unit second moment. The fading process {Ak } is assumed to be independent of the noise and input processes. The channel signal-to-noise ratio (SNR) is given by SNR= Es /N0 . In the last part of the DFC model, a soft-decision demodulator consisting of a uniform quantizer with a resolution of q bits, takes the output Rk to produce the discrete channel output: Yk = j,
0 if Rk ∈ (Tj−1 , Tj0 ],
where the Tj0 are uniformly spaced thresholds −∞, if Tj0 = (j + 1 − 2q−1 )∆, if ∞, if
with step-size ∆, such that j = −1 j = 0, 1, . . . , 2q − 2 j = 2q − 1.
√ √ Let δ , ∆/ Es and Tj , Tj0 / Es . The m-fold transition probability for the DFC
CHAPTER 2. PRELIMINARIES
17
can be calculated via [28] (m)
PDFC (y m | xm ) , P r{Y m = y m | X m = xm } # "m Y = EA1 ...Am qxk ,yk (Ak ) ,
(2.9)
k=1
where y m = (y1 , y2 , . . . , ym ), xm = (x1 , x2 , . . . , xm ), qi,j (ak ) , P r{Yk = j|Xk = i, Ak = ak }, and EX [·] denotes expectation with respect to the random variable X. (1)
(1)
For m = 1, there is closed form expression for PDFC (y|x) = PDFC (j), y ∈ Y, x ∈ X , which is given by (1)
PDFC (j) = n(−Tj−1 ) − n(−Tj ), where j =
y−(2q −1)x (−1)x
(2.10)
∈ Y, and � √
n(Tj ) = 1 − Q(Tj 2SNR) −
� 1−Q
√ Tj 2
��
−
√ 1 e ( +1 SNR q 1 +1 SNR
Tj2 1 +1 SNR
) ,
(m)
where Q(·) is the Gaussian Q-function. In general, for m 6 3, PDFC (y m | xm ) can be calculated in closed form. For m > 3, since the joint probability density function of arbitrarily correlated Rayleigh and Rician random variables is not known in closed form, it can only be determined via numerical methods. It can be shown that the DFC is actually an NBNDC as given by (2.2) with a stationary ergodic noise process [28].
2.2
Source Coding and Quantization
Consider Figure 2.1 again. In a general digital communication system, in order to send the information from the source to receiver, at first some processing on the source data takes place (encoding). The data is expressed using the symbols of a
CHAPTER 2. PRELIMINARIES
18
given alphabet and sent over a channel with a certain statistical characteristics. As well, the receiver needs to do some processing on the received data, as a means to retrieve the source information (decoding). This encoding/decoding process is often performed in two separate steps. The first step is referred to as source coding and the second step is called channel coding.
2.2.1
Source Coding
In a separate source and channel coding system, also known as a tandem coding system, the source coding process aims to represent the source information as compactly as possible. To do this, source redundancy should be removed. The redundancy of a source can be measured quantitatively, via the concept of source entropy. According to Shannon [30], entropy is a measure of the uncertainty of a random variable. Assume the source is a stationary discrete memoryless source (DMS). Hence it can be modeled as a random variable X with alphabet X = {0, 1, . . . , N − 1}. The entropy H(X) of such source is defined as: H(X) = −
X
p(x) log p(x) = −EX [log p(X)],
x∈X
where p(x) = P r{X = x}. For a source with memory, the source can be modeled as a stochastic process {Xi }, i = 1, 2, . . .. The amount of randomness or uncertainty for such sources is measured via the entropy rate, H∞ (X ), defined as � 1 − EX1 ,X2 ,...,Xn [log p(X1 , X2 , . . . , Xn )] , n→∞ n
H∞ (X ) = lim
(if the limit exists,) where p(x1 , x2 , . . . , xn ) = P r{X1 = x1 , X2 = x2 , . . . , Xn = xn }. Note that for a DMS, the entropy and entropy rate are equal. Setting the base
CHAPTER 2. PRELIMINARIES
19
of the logarithms to 2, the unit of these measures is expressed in bits. It can be shown [9, p. 29-30], that for any stochastic process {Xi }, i = 1, 2, . . ., H∞ (X ) ≤ log2 N, where N is the size of the source alphabet, i.e. |X | = N . For a discrete source {Xi }, i = 1, 2, . . . with alphabet size N , the redundancy is defined as ρT = log2 N − H∞ (X ). The redundancy of a source can be due to non-uniformity of its marginal probability distribution or its memory. As a result, the total redundancy ρT can be decomposed into two parts: ρT = ρD + ρM , ρD = log2 N − H(X1 ), ρM = H(X1 ) − H∞ (X ). Here ρD is the redundancy due to non-uniformity and ρM is due to the memory. In general, we distinguish between two kinds of source coding; lossless and lossy source coding. In lossless source coding, the aim is to remove all the source’s redundancy by compressing the source, while the data is still fully retrievable; i.e., the retrieved data after decompression is identical to the source data. In [30], Shannon showed that for a lossless fixed-to-variable length source coding scheme and a stationary ergodic source {Xi }∞ i=1 , the coding rate R can be arbitrarily close to source entropy rate H∞ (X ). Conversely, he showed that for a source code with coding rate R less than the entropy rate H∞ (X ), the probability of decoding error is arbitrarily close to one, for sufficiently large source blocks k.
CHAPTER 2. PRELIMINARIES
20
In a lossy source coding scheme, the minimum coding rate is a function of the amount of allowed distortion. The rate distortion function R(D) is the infimum of rates R such that (R, D) is in the rate distortion region of the source for a given distortion D, where the rate distortion region for a source is the closure of the achievable rate distortion pairs (R, D) [9, p. 306]. In the rate distortion theorem, it is proved that for an independent and identically distributed (i.i.d.) source X with distribution p(x) and bounded distortion function d(x, xˆ), the rate distortion function satisfies R(D) =
p(ˆ x|x):
P
min
x,ˆ x
p(x)p(ˆ x|x)d(x,ˆ x)≤D
ˆ I(X; X),
ˆ is the mutual information of the two random variables X ∈ X and where I(X; X) ˆ ∈ Xˆ and is defined as X ˆ = I(X; X)
XX x∈X x ˆ∈Xˆ
p(x, xˆ) log
p(x, xˆ) , p(x)p(ˆ x)
where p(x, xˆ) is the joint probability distribution of the two random variables.
2.2.2
Quantization
Since the conventional entropy function H∞ (X ) is undefined for continuous sources, the information content of such sources is theoretically infinite. Thus it is practically impossible to present a continuous source using a source code with finite rate. As a result, using lossy source coding rather than lossless coding is inevitable. This is a process in which the analog source is converted to a discrete (digital) source at the cost of some distortion with respect to the original source. This task is done via quantization. A quantizer in general, partitions the continuous domain R of the source into a finite number of regions and assigns a value to each region, which represents all the
CHAPTER 2. PRELIMINARIES
21
members of that region. The representing values are called output levels or reconstruction points. More specifically, consider a source X with a continuous alphabet R. An N -level quantizer Q is a mapping from the domain R to a set of output levels, known as codebook C = {ci : i ∈ I}, with I being the index set of the quantizer, such that xˆ , Q(x) = ci
if and only if x ∈ Ri .
Equivalently, Ri = {x ∈ R : Q(x) = ci }. ˆ is defined, To measure the quality of a quantizer, a distortion measure d(X, X) ˆ is the quantized where X is the continuous random variable to be quantized and X value. Different distortion measures may be chosen to quantify the quality of a quantizer. When R is the real line, a popular choice is the rth power of the magnitude ˆ = |x − xˆ|r , r > 0. A very common distortion measure which is error d(X, X) ˆ = (x − xˆ)2 . For exclusively used in this thesis is the square error distortion d(X, X) a random variable X, often called a random source X, the expected distortion is considered as measure of quality for a quantizer Q D(Q) = E[d(X, Q(X))].
(2.11)
For the square error distortion, E[d(X, Q(X))] is called mean square error (MSE) and is calculated via D(Q) = E[d(X, Q(X))] = E[(X − Q(X))2 ]. There are two necessary conditions for a quantizer to be optimal. One of the conditions is about the quantization regions and the other is about output levels [17, p. 176-185], [9, p. 303]: • The Nearest neighbor condition (NNC): Given a codebook C, the distortion is minimized by mapping a random source X to the output level ci that has
CHAPTER 2. PRELIMINARIES
22
minimum distortion with respect to it. The collection of quantization regions in R defined by this mapping is called a Voronoi or Dirichlet partition indexed by the output levels. These are given by Ri ⊂ {x : d(x, xˆi ) ≤ d(x, xˆj ), j ∈ I} i ∈ I
(2.12)
• The centroid condition (CC); The reconstruction points should minimize the conditional expected distortion over their respective assignment regions. Hence, the output level is simply the centroid of the part of source that lies in the region Ri , i.e., xˆi = arg min E[d(X, xˆ)|X ∈ Ri ], x ˆ∈R
i ∈ I.
(2.13)
For the MSE distortion, it can be shown that the centroid of a region is its center of mass, given by xˆi = E[X|X ∈ Ri ],
i ∈ I.
(2.14)
As can be seen, according to the above optimality conditions, the quantizer regions can be obtained from the codebook and vice versa. Consequently, in order to describe a quantizer, it is enough to specify its codebook. Applying the NNC and CC conditions to design a quantizer, if the quantizer only takes one source symbol at a time and outputs L q-ary symbols, it is called a scalar quantizer (SQ) with rate R = (L log2 q)/1 bits/sample. If the output alphabet is qary, then the quantizer’s codebook will have N = 2R output levels. In this thesis we always consider output of the quantizer to be binary. The most common algorithm for SQ design is the Lloyd algorithm [22]. Furthermore, a quantizer that takes k source symbols at a time and outputs L quantized symbols, is called a vector quantizer
CHAPTER 2. PRELIMINARIES
23
(VQ) with rate R = (L log2 q)/k bits/sample and N = 2R output levels. The design algorithm for VQ is the generalized Lloyd algorithm, also known as Linde-Buzo-Gray vector quantizer algorithm (LBG-VQ) [21]. The Lloyd algorithm for SQ design is an iterative algorithm. Its idea comes directly from the CC and NNC conditions: For a fixed codebook, optimize the partition set {Ri }. For the resulting partition, optimize the codebook C. Iterate. Algorithm 2.1 depicts the Lloyd-Max algorithm in more detail. A quantizer that is designed using the Lloyd algorithm, is called a Lloyd-Max quantizer. When using the Lloyd algorithm, the distortion in each iteration is either reduced or will be leaved unchanged. As a result, since the distortion is nonnegative, the algorithm is guaranteed to converge. In order to start the algorithm, an initial codebook must be given. A well-known technique for initial codebook selection is the splitting algorithm, [12, 21] which has experimentally been shown to yield well-designed final codebooks. The splitting algorithm is described in Section 3.1.2. Algorithm 2.1 The Lloyd algorithm for SQ design (for MSE distortion) (1)
(1)
(1)
Input: pdf f (x), initial codebook C1 = {ˆ x1 , xˆ2 , . . . , xˆN }, threshold �. M ←1 D0 ← ∞ D1 ← E[d(X, Q(1) (X))] −Dm while Dm−1 > � do Dm−1 m←m+1 (m) (m) (m) Ri ← {x : d(x, xˆi ) ≤ d(x, xˆj ), j = 1, 2, . . . , N } i = 1, 2, . . . , N (m) (m) xˆi ← arg minxˆ∈R E[d(X, xˆ)|X ∈ Ri ], i = 1, 2, . . . , N (m) (m) (m) Cm ← {ˆ x1 , xˆ2 , . . . , xˆN } Dm ← E[d(X, Q(m) (X))] end while Output: Cm
CHAPTER 2. PRELIMINARIES
24
The generalized Lloyd algorithm for vector quantizer design also follows the same idea as the Lloyd algorithm. The only difference is that since the input is a vector x = (x1 , . . . , xk ), the distortion measure is extended to k-dimensional vectors. For P instance the square error distortion is defined as d(x, Q(x)) = ki=1 (xi − xˆi )2 , where ˆ , Q(x). Note that (2.12), (2.13), and (2.14) also change into vector forms x ˆ i ) ≤ d(x, x ˆ j ), j ∈ I} i ∈ I, Ri ⊂ {x : d(x, x ˆ i = arg min E[d(X, x ˆ )|X ∈ Ri ], x ˆ ∈R x
i ∈ I,
(2.15) (2.16)
and ˆ i = E[X|X ∈ Ri ], x
i ∈ I.
(2.17)
The per-sample MSE distortion for a k-dimensional vector quantizer is calculated via 1 E[d(X, Q(X)] k � 1X � ˆ i k2 |X ∈ Ri P (X ∈ Ri ) = E kX − x k i∈I Z 1X ˆ i k2 dx, p(x)kx − x = k i∈I Ri
D(Q) =
where ka − bk2 ,
Pk
i=1 (a
(2.18)
− b)2 , for k-dimensional vectors a, b.
Note that in order to send the quantized values (output levels) over a channel, or store them in a storage medium, it is not necessary to send the actual quantized values. In practice, assuming that the receiver already knows the quantizer codebook C, it is enough to send the index i ∈ I of an output level ci to retrieve it in the receiver. The index i is coded to be sent over the channel. As a result, each output level ci is in correspondence with a codeword. For a binary input channel, the codewords can be the binary form of the indices i ∈ I.
CHAPTER 2. PRELIMINARIES
25
A quantizer can also be viewed from another perspective. Consider a digital communication system with a continuous valued stochastic process {Vi } as source (Figure 2.8). The VQ (or in general any quantizer) can be considered as an encoder/decoder pair, where the source is encoded via the mapping γ, and decoded via the mapping β γ(v) = i if v ∈ Ri , β(j) = cj , cj ∈ C, where cj is the output level corresponding to index j ∈ J and J is the output index set. Note that we assume here that the quantizer codewords are sent through a noiseless channel. As a result, for a quantizer model j = i, but for a general channel this is not the case. Since the channel is noiseless, the end-to-end distortion can be calculated via (2.18). It is interesting to note that in this case, assigning the indices to the output levels can be done arbitrarily (as long as the same assignment is used for quantization regions), with no effect on the system’s end-to-end distortion. That is because a different index assignment will only change the order of integrals over the quantization regions in (2.18). Since the sum of elements is independent of the order of summation, the VQ’s performance is independent of index assignment. Note that SQ is a specific case of VQ and hence the statement holds for SQ as well.
Figure 2.8: Block diagram of a vector quantizer in a communication system.
In Chapter 3, we survey the case where the channel is noisy and discuss that in that case, in contrast with the noiseless channel case, the end-to-end distortion is not
CHAPTER 2. PRELIMINARIES
26
only due to quantization, but also the distortion due to channel noise and hence the index-assignment has a vital effect on the end-to-end distortion.
Chapter 3 Exploiting Channel Memory and Soft-Decision Information in COVQ Design As mentioned earlier, where applicable, the performance of a communication system can be potentially improved by using joint source-channel coding instead of tandem coding, as well as using the channel memory, rather than discarding it via interleaving, and using soft-decision decoding, in contrast to hard decoding. In this chapter we review a well-known joint source-channel coding scheme, channel optimized vector quantization (COVQ), and present the design procedure of the COVQ for the nonbinary noise discrete channel with queue based noise (NBNDC-QB), described in Chapter 2. We numerically illustrate that such a system can successfully exploit the channel memory and soft decision information, in order to improve the performance over systems designed for ideally interleaved (hence memoryless) channels and hardquantized output channels. We end this chapter by numerically confirming that the 27
CHAPTER 3. EXPLOITING MEMORY AND SOFT-DECISION IN COVQ
28
NBNDC-QB is an effective model for approximating the Rayleigh DFC, described in Chapter 2, for COVQ design. The confirmation is done via fitting the NBNDC-QB to the Rayleigh DFC, designing a COVQ for the NBNDC-QB, testing the COVQ over the Rayleigh DFC, and comparing the training result of the COVQ for the NBNDCQB with the simulation results for the Rayleigh DFC.
3.1
Channel Optimized Vector Quantization (COVQ)
In Chapter 2 we reviewed vector quantization (VQ) and its design procedure. Since VQ is a source coding method, it disregard the channel’s statistics. As a result, since the channel’s noise plays a vital role on the overall performance of a communication system, it is not beneficial to send the output codewords of the VQ encoder directly over the channel. Therefore, in a tandem coding system, a channel coding module is added to the system, whose aim is to make the codewords robust to channel errors at the cost of adding extra bits (and thus increasing the coding rate) to the VQ codewords. This also adds extra online computational complexity and delay to the system. However, in COVQ, as a joint source-channel coding scheme, the VQ is designed by incorporating the channel’s statistics into the design algorithm. As a result, the COVQ is expected to be more robust to noisy channels, in comparison with VQ, while adding no extra redundancy to the codes, and adding less computational complexity and delay to the encoder/decoder in comparison with channel coding schemes. The COVQ approach was first introduced by Kumazawa et al. [20]. It was further
CHAPTER 3. EXPLOITING MEMORY AND SOFT-DECISION IN COVQ
29
Figure 3.1: Block diagram of a COVQ system.
developed and studied by Farvardin and Vaishampayan in [12, 13]. Later in [14], it was shown that the complexity of the encoding of a COVQ is proportional to the number of non-empty encoding regions, and it was observed that as the channel gets noisier, the number of non-empty encoding regions decrease.
3.1.1
System setup
Consider the communication system depicted in Figure 3.1. The input source to the COVQ encoder is a real-valued stationary and ergodic process {Vi }∞ i=1 . The COVQ encoder is a mapping γ that takes a vector of k source symbols v ∈ Rk and outputs an index i ∈ {0, 1, . . . , 2n − 1}, such that γ(v) = i if v ∈ Si , where {Si : i ∈ {0, 1, . . . , 2n −1}} is a partition of Rk . Note that the encoder is similar to a VQ encoder, except that the quantization regions Si are chosen according to both the source and channel statistics. The index i is then mapped to a binary vector x ∈ {0, 1}n via an index assignment mapper b(·). The index assignment is a one-to-one mapping b : {0, 1, . . . , 2n − 1} → {0, 1}n ,
b(i) = x
CHAPTER 3. EXPLOITING MEMORY AND SOFT-DECISION IN COVQ
30
where x is binary n-tuple. Since the mapping is one-to-one, for a given index mapping b, we can denote the quantization regions by Sx instead of Si , where b(i) = x. The binary n-tuples x ∈ {0, 1}n , each representing k source symbols, are then sent over the NBNDC-QB. As noted in Chapter 2, the channel output is 2q -ary. Denote the channel output by y. The decoder is a mapping β that maps the received n-tuple 2q -ary y to output levels of the quantizer codebook: β(y) = cy , cy ∈ Rk , y ∈ {0, 1, . . . , 2q − 1}n . For a given k dimensional source symbol v = (v1 , . . . , vk ) and its corresponding retrieved output level cy = (cy1 , . . . , cyk ) , the end-to-end per-sample distortion of the system is given by k
1X 1 (vi − cyi )2 . d(v, cy ) = kv − cy k2 = k k i=1
3.1.2
COVQ Design
The COVQ training algorithm aims to select the codebook C = {ci , i ∈ {0, 1, . . . , 2q − 1}n } and the partition set P = {Si , i ∈ {0, 1}n }, as well as the index mapping b, to minimize the following average distortion-per-sample measure: Z X 1X D(C, P, b) = p(v) P (y|x)d(v, cy )dv k x Sx y Z X X 1 = p(v) P (y|x)kv − cy k2 dv k x Sx y Z X X 1 = P (y|x) p(v)kv − cy k2 dv, k x y Sx
(3.1)
where p(v) is the source k-fold probability density function and P (y | x) is calculated via (2.6)-(2.8). The performance of this coding system is generally measured via
CHAPTER 3. EXPLOITING MEMORY AND SOFT-DECISION IN COVQ
31
D(C, P, b) and the encoding rate R, which is given by R=
n 1 log2 |P| = k k
bits/sample.
It can be seen that the COVQ design problem is similar to the VQ design problem; the difference is that the codebook and partition index sets are not the same here, since the partition sets are indexed via binary n-tuples I = {0, 1}n and the codebook is indexed via 2q -ary n-tuples J = {0, 1, . . . , 2q − 1}n , where q is the soft decision resolution. Another difference between the two design problems is the applied distortion measure. For a VQ the distortion is given by (2.18), while COVQ distortion is given in (3.1). Having these differences in mind, the LBG-VQ algorithm can be generalized to be used for COVQ design. In this algorithm, two necessary optimality conditions are satisfied iteratively. The conditions are called the generalized NNC and generalized CC conditions: • Generalized NNC [14]: Let P ∗ = {S∗x } be the optimal partition set for a fixed codebook C and a given index mapping b. The MSE distortion is minimized if the partitions satisfy ( X X S∗x = v : P (y|x)kv − cy k2 ≤ P (y|˜ x)kv − cy k2 , y∈J
) ˜∈I x
,
x ∈ I.
y∈J
(3.2) As a result, the encoder function γ cascaded with the index mapping can be written as b(γ(v)) = arg min x∈I
X
P (y|x)kv − cy k2 .
(3.3)
y∈J
It can be seen that the computational complexity of encoding, using (3.3) is O(|I| × |J | × k) = O(k2(q+1)n ) which becomes intractable, even for moderate
CHAPTER 3. EXPLOITING MEMORY AND SOFT-DECISION IN COVQ
32
values of q and n. In order to decrease the computational complexity, the following technique is proposed in [14]. For a fixed C and b, the encoding region S∗x can be written as \
S∗x =
Sxt ∗ ,
x6=t
where
S∗xt
is described as follows:
( S∗xt =
)
v:2
X
[P (y|x) − P (y|t)] hv, cy i ≤
y∈J
X
[P (y|x) − P (y|t)] kcy k2
,
y∈J
(3.4) where hv, cy i represents the inner product of v and cy . According to (3.4), the region S∗xt is characterized by a hyperplane Hxt , which separates the encoding regions S∗x and S∗t and is described by ) ( X X [P (y|x) − P (y|t)] kcy k2 . [P (y|x) − P (y|t)] hv, cy i = Hxt = v : 2 y∈J
y∈J
(3.5) This fact can be used to reduce the encoding complexity in the following way. Define for all nonempty encoding regions ˆ v ˆx , E[V|X ∈ Sx ] =
X
P (y|x)cy ,
x∈I
y∈J
and ˆ 2 |X ∈ Sx ] = αx , E[kVk
X
P (y|x)kcy k2 ,
x ∈ I,
y∈J
ˆ denotes the random variable at the output of the decoder. Then, it where V can be shown that (3.5) can be written as Hxt = {v : 2hv, v ˆt − v ˆx i = αt − αx }.
(3.6)
It can also be shown that the distance of v to v ˆx , dx (v) , αx − 2hv, v ˆx i can be used to determine which side of Hxt the point v belongs to. In other words, to
CHAPTER 3. EXPLOITING MEMORY AND SOFT-DECISION IN COVQ
33
determine the quantization region for a source symbol v, the following relation can be used as the encoder function � ˆx i . b(γ(v)) = arg min dx (v) = arg min αx − 2hv, v x∈I
x∈I
(3.7)
Using this technique, the parameters v ˆx and αx are calculated only once with complexities O(2nq ) and O(k2nq ) respectively, and for each source vector v to be encoded, the complexity is O(k2n ). It can be seen that the second technique has a notable speedup over the technique that uses (3.3) for encoding, specially for higher values of q. Furthermore, it is important to note that we only need to calculate dx (v) for the non empty regions, whose number increases as the channel gets noisier. • Generalized CC [14]: Similar to the CC condition, the generalized CC condition states that for a fixed index mapping b and fixed partition set P = {Sx }, x ∈ I, the optimal codebook C ∗ = {cy }, y ∈ J satisfies ˆ )|Y = y}, c∗y = arg min E{d(V, v ˆ ∈Rk v
y ∈ J,
(3.8)
where Y denotes the random vector at the channel output. For the MSE distortion, this relation is simplified to R P x P (y|x) Sx vf (v)dv ∗ R cy = P . x P (y|x) Sx f (v)dv
(3.9)
Similar to the Lloyd algorithm, a successive application of (3.2) and (3.9) will lead to a non-increasing sequence of distortions. Hence the algorithm has to converge. Therefore, we start with an initial point and iteratively satisfy one of the two aforementioned conditions, in succession.
CHAPTER 3. EXPLOITING MEMORY AND SOFT-DECISION IN COVQ
34
To select the initial codebook C 0 we have used the splitting algorithm [12,21]. This method, which is also used for initial codebook selection in VQ and SQ design, first designs a VQ (COVQ with noiseless channel) with only one output level C10 , {c0 } using the CC. Then, the number of output levels are doubled to 2 by letting C20 = {c0 + d, c0 − d}, where d is a vector with very small values in each coordinate, and training the quantizer using the initial codebook C20 . After the algorithm converges to the locally optimum code C2∗ = {c0 , c1 }, the number of output levels is doubled to 4, by letting C40 = {c0 + d, c0 − d, c1 + d, c1 − d}, and again training the quantizer for 4 output levels. This procedure is continued until an initial codebook with desired number of output levels (i.e., 2n ) is obtained. To design the COVQ we also need to address the index assignment problem. In Chapter 2 we mentioned that for a VQ (over a noiseless channel) the order of assigning indices to code levels does not affect the performance of the system. This is not the case when the channel is noisy. According to the distortion expression (3.1) for a COVQ, it can be shown [12] that for the MSE distortion and for a COVQ satisfying the generalized CC, the average end-to-end distortion can be broken into two terms DCOV Q = DV Q + DC , where DV Q
1X = k x∈I
Z
p(v)kv − cx k2 dv
(3.10)
Sx
where cx represents the output level from the codebook C, the output of the COVQ decoder, when the channel is noiseless and v ∈ Sx . In other words, DV Q is the expected distortion when the channel deterministically outputs y ∈ J corresponding to each binary vector x ∈ I sent over the channel. The other term DC is the distortion due to the channel noise. Recalling that γ(v) = i if v ∈ Si and x = b(i), DC is given
CHAPTER 3. EXPLOITING MEMORY AND SOFT-DECISION IN COVQ
by
35
n
2 −1 1 XX P r{v ∈ Si }P (y|b(i))kcb(i) − cy k2 . DC = k i=0 y∈J
(3.11)
It can be seen that for a different index mapping x0 = b0 (i), the distortion caused by the channel can be different. As a result, it is important to choose the mapping b judiciously, in order to minimize the channel distortion DC . We have used the simulated annealing algorithm, as suggested in [12], to perform this minimization. The simulated annealing (SA) algorithm is a well-known probabilistic algorithm [7, 19] which is shown to yield a good approximation to a globally optimum solution in a large search space. At each step, the SA algorithm replaces the current solution by a random nearby solution, chosen with a probability that depends both on the difference between the corresponding function values and also on a global parameter called temperature T , which is gradually decreased during the process. At the final steps with T close to zero, the search is more local (downhill), while at the beginning (high temperatures) it is more likely to have random solutions selected from the state space to avoid being trapped in a local optima. Algorithm 3.1 generally describes how the SA algorithm is applied to the index assignment problem. In this algorithm, the system state is defined as a particular mapping b = (b(1), b(2), . . . , b(2N )), and the energy function is defined as the channel distortion DC of the system, given in (3.11). Some minor modifications can be made to the general algorithm, such as terminating the algorithm if the number of trials exceeds an specific number, implying relative stability of the state. The SA algorithm parameters we have used in this thesis are the same as those used in [12] and are listed in Table 3.1 To select the initial codebook, at first we consider the error free channel and
CHAPTER 3. EXPLOITING MEMORY AND SOFT-DECISION IN COVQ
36
Algorithm 3.1 Simulated annealing algorithm for index assignment Input: random initial state b, initial temperature T0 , temperature decrease factor α, final temperature Tf , and number of failed trials allowed, before temperature decrease Ncut T ← T0 count ← 0 while T > Tf do while count < Ncut do choose state b0 by randomly perturbing b ∆DC ← DC (b0 ) − DC (b) if ∆DC ≤ 0 then b ← b0 count ← 0 else {with probability e∆DC /T , do} b ← b0 count ← 0 end if count ← count + 1 end while T ← αT end while Output: b train the COVQ with the initial codebook obtained from the splitting algorithm, followed by simulated annealing for a locally optimum index assignment. Then we use the resulting codebook as the initial state for a channel with high SNR. After the training for high SNR channel is done, we decrease the channel SNR slightly and train the COVQ again, setting the previously trained codebook (for higher SNR) as the initial state of the system with the new SNR. We continue this process until we eventually reach the desired channel SNR.
CHAPTER 3. EXPLOITING MEMORY AND SOFT-DECISION IN COVQ
37
Table 3.1: Simulated annealing parameters. T0 Tf α Ncut
3.2
10.0 2.5 × 10⁻⁴ 0.97 200
Numerical Results
We now present the numerical results obtained using the training algorithm and the NBNDC-QB channel model described previously. Several source distributions were tested, including independent and identically distributed (i.i.d.) Gaussian and Laplacian sources and correlated Gauss-Markov sources. The correlated source was modeled via a Markov process of first-order : Vi = φVi−1 + Ui where φ ∈ (−1, 1) is the correlation parameter and {Ui } is a Gaussian i.i.d. process. All of the source models had zero mean and unit variance. For each source model, the COVQ was trained using 500,000 source vectors.
3.2.1
Exploiting memory and soft-decision information
Tables 3.2 and 3.3 depict COVQ training results for the memoryless Gaussian source and NBNDC-QB with different channel noise correlation coefficients. The NBNDCQB noise one-dimensional distribution ρj is expressed in terms of the SNR of the (1)
(1)
underlying DFC by setting ρj = PDFC (j), where = PDFC (j) is given in (2.10) for j ∈ {0, 1, . . . , 2q − 1} and δ is chosen as in [28] to maximize the DFC capacity. The values of ρj and δ are shown in Table 3.14. In practice, the memoryless channel behavior
CHAPTER 3. EXPLOITING MEMORY AND SOFT-DECISION IN COVQ
38
is realized by interleaving. It can be shown that by ideal (infinite) interleaving, a correlated channel is reduced to its memoryless counterpart. It can be seen that the highly correlated channel consistently outperforms the memoryless channel and gains of more than 5 dB are achievable (e.g., for q = 1, R = 3, k = 3, SNR=0 in Table 3.2), using the channel memory. Note that since the COVQ only makes use of intra-block memory, for rate R = 1 and low dimensions k, the block length is so small that there is not much channel memory to be harnessed. As a result, the performance is constant for different channel correlations. However, it is observed that in some cases, interleaving may give better COVQ performance over channels with lower noise correlations. For example, the SDR performance of the memoryless channel for q = 3, R = 3, k = 2 (see Tables 3.2 and 3.3,) is slightly better than the corresponding performance for noise correlations 0.5 and 0.7 at high SNRs. Since the capacity of the correlated channel is strictly higher than that of the memoryless channel, this degradation may be due to poor selection of the initial codebook for the vector quantizer. However, the results indicate a general trend of improved COVQ performance when the channel noise correlation is increased. Similar observations can be made for sources with Laplacian or Gauss-Markov distributions (see Tables 3.4 and 3.5). Additionally, it is observed in Tables 3.2-3.5 that the system with soft-decision quantization (q > 1), considerably outperforms hard-quantization (q = 1), by as much as 2.3 dB (for R = 3, k = 1, Cor = 0, SNR=5) for a memoryless Gaussian source, when using only a 2-bit soft-decision quantizer (q = 2). For 3-bit quantization further gain is obtained, although the gain for q = 3 over q = 2 is less than the gain for q = 2 over q = 1.
CHAPTER 3. EXPLOITING MEMORY AND SOFT-DECISION IN COVQ
39
Comparing the overall performance of a COVQ system that uses the combination of memory and soft-decision information to a system that uses interleaving to discard channel memory and hard-decision quantization in the output, it can be seen that gains more than 5.7 dB (at R = 3, k = 3, SNR=0) can be achieved for memoryless Gaussian sources. More gain is obtained for correlated Guass-Markov sources. It is important to notice that in a uniform soft-quantized output system, the SDR performance also depends on the soft-quantizer step size δ. However, according to our results, the system’s performance is not very sensitive to the choice of δ. In this work, we selected the δ values that maximize the capacity of the memoryless channel as the initial choice and then tried to improve the performance by applying a local search over the δ values. In Tables 3.6-3.8, the training results for memoryless Gaussian source with different channel parameters α and M are depicted. Table 3.9 shows the results of using the same COVQ design technique, with a slight modification in the initial codebook selection. More precisely, in the modified version, after training the COVQ for the lowest SNR, the resulting codebook was again used as an initial codebook for designing a new COVQ with higher SNR and the training is continued until the COVQ for the highest SNR is trained. We did the same decrease-increase method [6] 5 times to obtain the final COVQ codebooks for desired SNRs. As can be seen, the results show a good improvement (up to 2.1 dB at q = 1, R = 3, k = 1, Cor=0.9, SNR=10) at the cost of extra complexity in the training algorithm.
CHAPTER 3. EXPLOITING MEMORY AND SOFT-DECISION IN COVQ
3.2.2
40
Validating the NBNDC-QB model
As mentioned earlier, the m-fold probability distribution of correlated Rayleigh random variables is not known in closed form, for m > 3. As a result, the channel (m)
transition distribution PDFC (y m |xm ) can only be calculated numerically. It is shown in [28] that the NBNDC-QB model can approximate the Rayleigh DFC in terms of channel capacity and noise autocorrelation function, while providing closed form expression for the channel transition distribution for arbitrary channel block length m and memory order M . Approximating a given Rayleigh DFC (with fixed SNR and fD T and q) via the NBNDC-QB is done via the following steps: • Matching the noise one-dimensional probability distributions (as in Section (1)
(1)
3.2.1) by setting ρj = PDF C (j) for j ∈ Y, where PDF C (j) is given by (2.10), in terms of δ, q, and SNR. The values of ρj are given in Table 3.14. • Matching the noise correlation coefficients (so that parameter α is determined). • The remaining QB parameters (M, ε) are estimated by minimizing the KullbackLeibler divergence rate between the two (2q -ary) noise processes. It is important to notice that in general, two channel models can not be matched to have the exact same behavior. However, for the memoryless case (with Cor=0), the NBNDC-QB is statistically identical to the ideally interleaved DFC. We have used the values given in [29] in which the Kullback-Leibler divergence rate between the two channel (2q -ary) noise processes is minimized over M and ε for SNR(dB) ∈ {2.0, 5.0, 10.0, 15.0}, fD T ∈ {0.005, 0.01}, and q = 2. The resulting values for q = 2, given in Table 3.10, are also used for case of q = 1.
CHAPTER 3. EXPLOITING MEMORY AND SOFT-DECISION IN COVQ
41
Using the approximated NBNDC-QB to fit a given Rayleigh DFC, we trained a COVQ using the previously described COVQ design algorithm. The resulting channel optimized quantizer’s performance was then tested over the given Rayleigh DFC. For generating the fading coefficients, we used the modified Clarke’s method introduced in [36]. Training and simulation results (over the NBNDC-QB and Rayleigh DFC channels) in terms of SDR are shown in Tables 3.12 and 3.13 for memoryless and correlated Gaussian sources, and in Table 3.11 for a memoryless Laplacian source . The channel parameters used for training/simulation are given in Table 3.10. Comparing the training and simulation performance of the COVQ, we observe that there is a good conformity between the results of the two channel models, where the NBNDCQB is used for training and the Rayleigh DFC for testing. However, for higher rates, some degradation between the simulation and training results is observed.
CHAPTER 3. EXPLOITING MEMORY AND SOFT-DECISION IN COVQ
42
Table 3.2: COVQ Training SDR results (in dB) for the memoryless NBNDC-QB and the highly correlated NBNDC-QB with parameters α = 1.0, M = 1; memoryless Gaussian source. q
R
1
1
2
3
1
2
2
3
1
3
2
3
k 1 2 3 1 2 3 1 2 3 1 2 3 1 2 3 1 2 3 1 2 3 1 2 3 1 2
Memoryless (Cor=0) SNR (dB) 15 10 5 2 4.18 3.77 2.88 2.16 4.16 3.75 2.87 2.15 4.23 3.78 2.87 2.15 8.16 6.58 4.23 2.85 8.32 6.72 4.88 3.67 8.57 7.12 5.10 3.78 11.12 8.09 4.83 4.45 11.64 9.30 6.60 4.90 11.99 9.76 6.90 5.08 4.23 3.88 3.10 2.43 4.21 3.87 3.09 2.42 4.28 3.90 3.09 2.42 8.37 7.00 4.75 3.35 8.55 7.13 5.46 4.29 8.78 7.59 5.76 4.42 11.67 8.81 7.20 5.34 12.42 10.37 7.73 5.88 12.57 10.71 8.01 6.09 4.24 3.91 3.16 2.49 4.22 3.89 3.15 2.48 4.29 3.93 3.15 2.48 8.42 7.08 4.89 3.46 8.60 7.22 5.61 4.43 8.83 7.69 5.91 4.57 11.79 8.96 7.45 5.60 12.57 10.61 7.96 6.15
0 1.67 1.66 1.67 2.06 2.88 2.95 3.57 3.88 3.97 1.95 1.94 1.95 2.51 3.41 3.54 4.13 4.61 4.85 2.01 2.00 2.01 2.61 3.55 3.68 4.35 4.85
15 4.18 4.16 4.27 8.35 8.55 8.81 11.71 12.09 12.54 4.23 4.21 4.31 8.54 8.76 9.02 12.18 12.51 13.13 4.24 4.22 4.32 8.58 8.80 9.07 12.28 12.63
Cor=0.9 SNR (dB) 10 5 2 3.77 2.88 2.16 3.75 2.87 2.15 3.88 3.64 3.26 7.05 5.24 5.70 7.32 7.05 6.13 8.37 7.49 6.91 9.68 9.45 8.04 11.63 9.98 8.89 12.40 10.79 9.69 3.88 3.10 2.43 3.87 3.09 2.42 3.99 3.77 3.43 7.40 5.62 6.13 7.67 7.48 6.75 7.79 7.50 6.94 11.24 9.57 8.46 11.74 10.27 9.52 12.33 11.13 10.30 3.91 3.16 2.49 3.89 3.15 2.48 4.01 3.81 3.48 7.48 5.73 6.24 7.74 7.43 6.90 7.86 7.50 6.83 10.41 9.01 8.44 11.58 10.35 9.46
0 1.67 1.66 2.97 5.09 5.82 6.47 7.22 8.24 9.03 1.95 1.94 3.17 5.52 6.20 6.77 7.76 8.87 9.74 2.01 2.00 3.22 5.64 6.42 6.48 7.90 9.10
CHAPTER 3. EXPLOITING MEMORY AND SOFT-DECISION IN COVQ
43
Table 3.3: COVQ Training SDR results (in dB) for the NBNDC-QB with parameters α = 1.0, M = 1 and channel correlations 0.5, 0.7 ; memoryless Gaussian source. q
R
1
1
2
3
1
2
2
3
1
3
2
3
k 1 2 3 1 2 3 1 2 3 1 2 3 1 2 3 1 2 3 1 2 3 1 2 3 1 2
15 4.18 4.16 4.25 8.26 8.44 8.65 11.34 11.64 11.79 4.23 4.21 4.30 8.47 8.66 8.87 11.93 12.21 12.51 4.24 4.22 4.31 8.51 8.71 8.93 12.05 12.34
Cor=0.5 SNR (dB) 10 5 2 3.77 2.88 2.16 3.75 2.87 2.15 3.82 2.92 2.20 6.81 4.66 3.37 6.99 4.91 3.68 7.09 5.04 3.94 8.56 5.56 4.01 9.13 6.35 4.72 9.48 6.88 5.41 3.88 3.10 2.43 3.87 3.09 2.42 3.94 3.14 2.47 7.20 5.11 3.84 7.34 5.48 4.30 7.53 5.80 4.65 9.21 6.30 4.75 10.22 7.74 5.98 10.67 8.24 6.50 3.91 3.16 2.49 3.89 3.15 2.48 3.97 3.21 2.54 7.28 5.26 3.97 7.42 5.71 4.49 7.62 6.01 4.92 9.36 6.59 5.04 10.48 8.09 6.46
0 1.67 1.66 1.72 2.64 2.91 3.27 3.20 4.21 4.47 1.95 1.94 2.00 3.10 3.75 3.89 3.90 5.14 5.47 2.01 2.00 2.07 3.24 4.02 4.19 4.24 5.51
15 4.18 4.16 4.26 8.30 8.49 8.72 11.50 11.78 11.88 4.23 4.21 4.30 8.50 8.71 8.94 12.04 12.34 12.62 4.24 4.22 4.31 8.55 8.76 8.99 12.16 12.47
Cor=0.7 SNR (dB) 10 5 2 3.77 2.88 2.16 3.75 2.87 2.15 3.85 2.99 2.69 6.92 4.91 3.75 7.13 5.29 4.59 7.17 6.15 5.11 8.96 6.51 5.26 9.25 7.79 6.49 10.48 8.19 6.81 3.88 3.10 2.43 3.87 3.09 2.42 3.97 3.20 2.93 7.30 5.34 4.20 7.45 5.84 5.08 7.57 6.14 5.57 9.53 7.28 6.05 10.18 8.36 7.20 10.97 9.05 7.78 3.91 3.16 2.49 3.89 3.15 2.48 3.99 3.26 3.00 7.37 5.47 4.33 7.52 6.02 5.26 7.64 6.27 5.61 9.65 7.57 6.42 10.57 8.69 7.68
0 1.67 1.66 2.31 3.69 4.07 4.46 4.41 5.70 6.00 1.95 1.94 2.57 4.17 4.45 5.07 5.27 6.59 7.03 2.01 2.00 2.66 4.34 4.68 5.06 5.61 6.85
CHAPTER 3. EXPLOITING MEMORY AND SOFT-DECISION IN COVQ
44
Table 3.4: COVQ Training SDR results (in dB) for the memoryless NBNDC-QB and the highly correlated NBNDC-QB with parameters α = 1.0, M = 1; Gauss-Markov source with correlation parameter φ = 0.9. q
R
1
1
2
3
1
2
2
3
1
3
2
3
k 1 2 3 1 2 3 1 2 3 1 2 3 1 2 3 1 2 3 1 2 3 1 2 3 1 2
15 4.17 7.09 8.05 8.17 10.66 12.03 11.14 13.93 15.53 4.22 7.25 8.30 8.38 11.32 12.79 11.69 15.06 16.26 4.23 7.28 8.35 8.43 11.42 12.94 11.81 15.33
Memoryless (Cor=0) SNR (dB) 10 5 2 3.76 2.87 2.14 5.85 3.87 2.63 6.63 5.00 3.69 6.57 4.22 2.83 8.79 6.61 5.01 10.31 7.70 5.75 8.10 4.82 4.44 11.62 8.33 6.43 13.10 9.81 7.71 3.87 3.09 2.42 6.19 4.32 3.08 7.40 5.84 4.48 7.00 4.74 3.34 9.90 7.55 6.00 11.15 8.84 7.12 8.82 7.19 5.33 12.85 9.83 7.86 14.30 11.41 9.18 3.90 3.15 2.48 6.26 4.44 3.19 7.51 6.00 4.66 7.08 4.89 3.45 10.15 7.51 5.94 11.44 9.17 7.25 8.97 7.45 5.59 13.22 10.15 8.11
0 1.66 1.91 3.10 2.05 3.93 4.81 3.56 5.02 6.33 1.94 2.32 3.56 2.49 4.83 5.84 4.12 6.30 7.64 2.00 2.41 3.74 2.60 5.09 6.16 4.34 6.56
15 4.17 7.23 8.26 8.36 11.46 12.53 11.73 16.00 17.25 4.22 7.37 8.48 8.55 11.71 13.21 12.21 16.13 17.32 4.23 7.40 8.53 8.59 11.78 13.22 12.31 15.61
Cor=0.9 SNR (dB) 10 5 2 3.76 2.87 2.14 6.23 4.74 5.13 7.30 7.22 6.38 7.05 5.23 5.70 11.25 9.40 8.27 12.08 10.60 9.88 9.70 9.53 8.21 14.38 12.28 11.20 15.82 13.80 12.63 3.87 3.09 2.42 6.51 5.06 5.49 7.59 7.48 6.77 7.41 5.61 6.13 11.45 10.35 9.46 12.50 11.41 10.63 11.12 9.82 8.74 14.99 13.30 12.15 16.27 14.75 13.69 3.90 3.15 2.48 6.56 5.15 5.58 7.64 7.60 6.94 7.48 5.72 6.24 10.80 10.03 9.13 12.57 11.51 10.98 10.40 10.01 8.98 14.62 13.15 12.18
0 1.66 4.61 5.85 5.08 7.59 9.37 7.44 10.50 11.96 1.94 4.98 6.30 5.51 8.90 10.00 8.04 11.38 13.12 2.00 5.08 6.49 5.64 8.71 10.47 8.31 11.57
CHAPTER 3. EXPLOITING MEMORY AND SOFT-DECISION IN COVQ
45
Table 3.5: COVQ Training SDR results (in dB) for the memoryless NBNDC-QB and the highly correlated NBNDC-QB with parameters α = 1.0, M = 1; memoryless Laplacian source. q
R
1
1
2
3
1
2
2
3
1
3
2
3
k 1 2 3 1 2 3 1 2 3 1 2 3 1 2 3 1 2 3 1 2 3 1 2 3 1 2
Memoryless (Cor=0) SNR (dB) 15 10 5 2 2.87 2.63 2.07 1.58 3.46 3.12 2.42 1.84 4.06 3.46 2.44 1.90 6.64 5.39 3.48 2.32 7.67 6.18 4.18 3.12 8.11 6.61 4.55 3.38 9.70 7.08 4.21 3.54 10.92 8.52 5.96 4.36 11.40 9.25 6.41 4.65 2.90 2.70 2.21 1.77 3.50 3.22 2.59 2.06 4.14 3.63 2.66 2.03 6.85 5.79 3.96 2.77 7.91 6.59 4.88 3.73 8.37 7.13 5.24 3.94 10.32 7.84 5.97 4.41 11.45 9.51 7.04 5.30 12.08 10.13 7.52 5.62 2.90 2.71 2.25 1.81 3.51 3.24 2.64 2.11 4.16 3.66 2.73 2.08 6.89 5.86 4.08 2.88 7.95 6.67 5.02 3.86 8.42 7.26 5.40 4.08 10.43 7.99 6.18 4.62 11.59 9.72 7.26 5.53
0 1.25 1.44 1.48 1.67 2.39 2.59 2.66 3.37 3.59 1.44 1.67 1.72 2.06 2.91 3.14 3.38 4.18 4.44 1.48 1.72 1.77 2.15 3.03 3.30 3.56 4.39
15 2.87 3.48 4.26 6.71 7.76 8.40 9.84 11.27 12.26 2.90 3.52 4.31 6.95 8.06 8.66 10.63 11.71 12.53 2.90 3.53 4.31 6.99 8.11 8.71 10.77 11.87
Cor=0.9 SNR (dB) 10 5 2.63 2.07 3.16 2.45 3.93 3.38 5.64 4.12 7.08 6.44 8.16 7.07 9.15 8.01 10.91 9.33 11.97 10.23 2.70 2.21 3.25 2.63 4.04 3.46 6.05 4.48 7.01 6.69 7.62 7.25 8.46 8.45 10.52 9.02 11.58 10.36 2.71 2.25 3.27 2.68 4.06 3.51 6.12 4.59 7.01 6.72 7.53 7.20 8.59 7.57 10.41 9.18
2 1.58 1.85 2.91 4.34 5.62 6.38 6.78 8.17 9.10 1.77 2.08 3.10 4.74 5.98 6.51 7.31 8.51 9.65 1.81 2.14 3.15 4.84 6.23 6.60 7.07 8.61
0 1.25 1.44 2.60 3.83 5.12 5.88 6.07 7.71 8.43 1.44 1.68 2.81 4.21 5.46 6.18 6.61 8.01 9.00 1.48 1.73 2.86 4.31 5.81 6.21 6.60 8.24
CHAPTER 3. EXPLOITING MEMORY AND SOFT-DECISION IN COVQ
46
Table 3.6: COVQ Training SDR results (in dB) for the memoryless NBNDC-QB and the highly correlated NBNDC-QB with parameters α = 0.5, M = 5; memoryless Gaussian source. q
R
1
1
2
3
1
2
2
3
1
3
2
3
k 1 2 3 1 2 3 1 2 3 1 2 3 1 2 3 1 2 3 1 2 3 1 2 3 1 2
Memoryless (Cor=0) SNR (dB) 15 10 5 2 4.18 3.77 2.88 2.16 4.16 3.75 2.87 2.15 4.23 3.78 2.87 2.15 8.16 6.58 4.23 2.85 8.32 6.72 4.88 3.67 8.57 7.12 5.10 3.78 11.12 8.09 4.83 4.45 11.64 9.30 6.60 4.90 11.98 9.76 6.90 5.08 4.23 3.88 3.10 2.43 4.21 3.87 3.09 2.42 4.28 3.90 3.09 2.42 8.55 7.13 5.46 4.29 8.37 7.00 4.75 3.35 8.78 7.59 5.76 4.42 11.67 8.81 7.20 5.34 12.42 10.37 7.73 5.88 12.57 10.71 8.01 6.09 4.24 3.91 3.16 2.49 4.22 3.89 3.15 2.48 4.29 3.93 3.15 2.48 8.42 7.08 4.89 3.46 8.60 7.22 5.61 4.43 8.83 7.69 5.91 4.57 11.79 8.96 7.45 5.60 12.57 10.61 7.96 6.15
0 1.67 1.66 1.67 2.06 2.88 2.95 3.57 3.88 3.97 1.95 1.94 1.95 3.41 2.51 3.54 4.13 4.61 4.85 2.01 2.00 2.01 2.61 3.55 3.68 4.35 4.85
15 4.18 4.16 4.27 8.35 8.56 8.85 11.71 12.22 13.75 4.23 4.21 4.31 8.76 8.54 9.05 12.18 12.56 13.93 4.24 4.22 4.32 8.58 8.80 9.09 12.29 12.68
Cor=0.9 SNR (dB) 10 5 2 3.77 2.88 2.16 3.75 2.87 2.15 3.88 3.69 3.30 7.05 5.24 5.70 7.35 7.40 6.53 8.73 7.74 6.92 9.72 9.31 8.30 12.43 10.28 8.96 12.65 10.55 9.35 3.88 3.10 2.43 3.87 3.09 2.42 3.99 3.31 3.47 7.70 7.76 7.00 7.40 5.62 6.13 8.90 8.05 7.30 12.02 10.06 8.84 12.69 10.77 9.60 12.91 11.19 10.14 3.91 3.16 2.49 3.89 3.15 2.48 4.02 3.36 3.51 7.48 5.73 6.24 7.77 7.86 7.12 8.94 8.12 7.44 11.45 9.66 8.85 12.26 10.96 9.89
0 1.67 1.66 3.03 5.09 6.01 6.41 7.51 8.26 8.65 1.95 1.94 3.21 6.49 5.52 6.82 8.09 8.92 9.53 2.01 2.00 3.26 5.64 6.63 7.01 8.21 9.22
CHAPTER 3. EXPLOITING MEMORY AND SOFT-DECISION IN COVQ
47
Table 3.7: COVQ Training SDR results (in dB) for the memoryless NBNDC-QB and the highly correlated NBNDC-QB with parameters α = 1.0, M = 5; memoryless Gaussian source. q
R
1
1
2
3
1
2
2
3
1
3
2
3
k 1 2 3 1 2 3 1 2 3 1 2 3 1 2 3 1 2 3 1 2 3 1 2 3 1 2
Memoryless (Cor=0) SNR (dB) 15 10 5 2 4.18 3.77 2.88 2.16 4.16 3.75 2.87 2.15 4.23 3.78 2.87 2.15 8.16 6.58 4.23 2.85 8.32 6.72 4.88 3.67 8.57 7.12 5.10 3.78 11.12 8.09 4.83 4.45 11.64 9.30 6.60 4.90 11.98 9.76 6.90 5.08 4.23 3.88 3.10 2.43 4.21 3.87 3.09 2.42 4.28 3.90 3.09 2.42 8.37 7.00 4.75 3.35 8.55 7.13 5.46 4.29 8.78 7.59 5.76 4.42 11.67 8.81 7.20 5.34 12.42 10.37 7.73 5.88 12.57 10.71 8.01 6.09 4.24 3.91 3.16 2.49 4.22 3.89 3.15 2.48 4.29 3.93 3.15 2.48 8.42 7.08 4.89 3.46 8.60 7.22 5.61 4.43 8.83 7.69 5.91 4.57 11.79 8.96 7.45 5.60 12.57 10.61 7.96 6.15
0 1.67 1.66 1.67 2.06 2.88 2.95 3.57 3.88 3.97 1.95 1.94 1.95 2.51 3.41 3.54 4.13 4.61 4.85 2.01 2.00 2.01 2.61 3.55 3.68 4.35 4.85
15 4.18 4.16 4.27 8.35 8.56 8.85 11.71 12.22 13.73 4.23 4.21 4.31 8.54 8.76 9.05 12.18 12.56 13.99 4.24 4.22 4.32 8.58 8.80 9.09 12.29 12.68
Cor=0.9 SNR (dB) 10 5 2 3.77 2.88 2.16 3.75 2.87 2.15 3.88 3.69 3.30 7.05 5.24 5.70 7.35 7.40 6.53 8.73 7.74 6.93 9.72 9.31 8.30 12.36 10.36 9.03 12.70 10.57 9.35 3.88 3.10 2.43 3.87 3.09 2.42 3.99 3.31 3.47 7.40 5.62 6.13 7.70 7.76 7.00 8.94 8.03 7.30 12.02 10.06 8.84 12.68 10.76 9.62 12.94 11.20 10.16 3.91 3.16 2.49 3.89 3.15 2.48 4.02 3.36 3.51 7.48 5.73 6.24 7.77 7.86 7.12 8.96 8.15 7.43 11.45 9.66 8.85 12.20 10.89 9.87
0 1.67 1.66 3.03 5.09 6.01 6.42 7.51 8.27 8.63 1.95 1.94 3.21 5.52 6.49 6.84 8.09 8.93 9.55 2.01 2.00 3.26 5.64 6.63 6.97 8.21 9.22
CHAPTER 3. EXPLOITING MEMORY AND SOFT-DECISION IN COVQ
48
Table 3.8: COVQ Training SDR results (in dB) for the memoryless NBNDC-QB and the highly correlated NBNDC-QB with parameters α = 2.0, M = 5; memoryless Gaussian source. q
R
1
1
2
3
1
2
2
3
1
3
2
3
k 1 2 3 1 2 3 1 2 3 1 2 3 1 2 3 1 2 3 1 2 3 1 2 3 1 2
Memoryless (Cor=0) SNR (dB) 15 10 5 2 4.18 3.77 2.88 2.16 4.16 3.75 2.87 2.15 4.23 3.78 2.87 2.15 8.16 6.58 4.23 2.85 8.32 6.72 4.88 3.67 8.57 7.12 5.10 3.78 11.12 8.09 4.83 4.45 11.64 9.30 6.60 4.90 11.98 9.76 6.90 5.08 4.23 3.88 3.10 2.43 4.21 3.87 3.09 2.42 4.28 3.90 3.09 2.42 8.37 7.00 4.75 3.35 8.55 7.13 5.46 4.29 8.78 7.59 5.76 4.42 11.67 8.81 7.20 5.34 12.42 10.37 7.73 5.88 12.57 10.71 8.01 6.09 4.24 3.91 3.16 2.49 4.22 3.89 3.15 2.48 4.29 3.93 3.15 2.48 8.42 7.08 4.89 3.46 8.60 7.22 5.61 4.43 8.83 7.69 5.91 4.57 11.79 8.96 7.45 5.60 12.57 10.61 7.96 6.15
0 1.67 1.66 1.67 2.06 2.88 2.95 3.57 3.88 3.97 1.95 1.94 1.95 2.51 3.41 3.54 4.13 4.61 4.85 2.01 2.00 2.01 2.61 3.55 3.68 4.35 4.85
15 4.18 4.16 4.27 8.35 8.56 8.85 11.71 12.23 13.76 4.23 4.21 4.31 8.54 8.76 9.05 12.18 12.56 14.05 4.24 4.22 4.32 8.58 8.80 9.09 12.29 12.68
Cor=0.9 SNR (dB) 10 5 2 3.77 2.88 2.16 3.75 2.87 2.15 3.88 3.69 3.30 7.05 5.24 5.70 7.35 7.40 6.53 8.78 7.72 6.91 9.72 9.31 8.30 12.49 10.36 9.08 12.74 10.63 9.40 3.88 3.10 2.43 3.87 3.09 2.42 3.99 3.31 3.47 7.40 5.62 6.13 7.70 7.76 7.00 8.94 8.06 7.31 12.02 10.06 8.84 12.69 10.80 9.62 12.97 11.25 10.23 3.91 3.16 2.49 3.89 3.15 2.48 4.02 3.36 3.51 7.48 5.73 6.24 7.77 7.86 7.12 8.96 8.10 7.45 11.45 9.66 8.85 12.21 10.92 9.90
0 1.67 1.66 3.03 5.09 6.01 6.40 7.51 8.32 8.69 1.95 1.94 3.21 5.52 6.49 6.84 8.09 8.95 9.58 2.01 2.00 3.26 5.64 6.63 7.00 8.21 9.28
CHAPTER 3. EXPLOITING MEMORY AND SOFT-DECISION IN COVQ
49
Table 3.9: COVQ Training SDR results (in dB) for the memoryless NBNDC-QB and the highly correlated NBNDC-QB with parameters α = 1.0, M = 1; memoryless Gaussian source- Decrease increase method (5 times). q
R
1
1
2
3
1
2
2
3
1
3
2
3
k 1 2 3 1 2 3 1 2 3 1 2 3 1 2 3 1 2 3 1 2 3 1 2 3 1 2
Memoryless (Cor=0) SNR (dB) 15 10 5 2 4.18 3.77 2.88 2.16 4.17 3.75 2.87 2.15 4.23 3.78 2.88 2.15 8.16 6.58 4.23 2.85 8.42 6.98 4.95 3.67 8.68 7.21 5.12 3.79 11.12 8.48 5.80 4.45 11.64 9.30 6.60 4.94 12.16 9.78 6.92 5.11 4.23 3.88 3.10 2.43 4.21 3.87 3.09 2.42 4.28 3.91 3.10 2.43 8.37 7.00 4.75 3.35 8.55 7.43 5.65 4.32 8.86 7.64 5.79 4.44 11.67 9.43 7.21 5.35 12.42 10.38 7.78 5.88 12.80 10.84 8.07 6.12 4.24 3.91 3.16 2.49 4.22 3.89 3.15 2.48 4.29 3.93 3.15 2.49 8.42 7.08 4.89 3.47 8.60 7.52 5.75 4.46 8.87 7.74 5.94 4.58 11.79 9.65 7.47 5.60 12.57 10.61 8.01 6.15
0 1.67 1.66 1.67 2.06 2.88 2.96 3.57 3.88 3.99 1.95 1.94 1.95 2.51 3.43 3.54 4.13 4.61 4.86 2.01 2.00 2.01 2.61 3.56 3.68 4.35 4.86
15 4.18 4.17 4.37 8.84 9.20 9.51 13.41 13.92 14.40 4.23 4.21 4.39 8.94 9.34 9.60 13.69 14.02 14.51 4.24 4.22 4.40 8.96 9.32 9.57 13.74 13.86
Cor=0.9 SNR (dB) 10 5 2 3.77 2.88 2.16 3.75 2.87 2.15 4.16 3.68 3.27 8.08 6.69 5.70 8.54 7.29 6.40 8.89 7.76 6.97 11.80 9.45 8.04 12.36 10.27 9.05 12.94 10.95 9.76 3.88 3.10 2.43 3.87 3.09 2.42 4.22 3.81 3.44 8.32 7.06 6.13 8.77 7.60 6.75 9.07 8.00 7.28 12.34 10.10 8.72 12.87 11.04 9.94 13.35 11.65 10.60 3.91 3.16 2.49 3.89 3.15 2.48 4.23 3.85 3.49 8.37 7.17 6.25 8.80 7.75 6.95 9.06 8.05 7.33 12.44 10.32 8.95 12.87 11.24 10.24
0 1.67 1.66 2.98 5.09 5.84 6.47 7.23 8.34 9.06 1.95 1.94 3.17 5.52 6.20 6.80 7.91 9.22 9.94 2.01 2.00 3.23 5.64 6.45 7.07 8.16 9.58
CHAPTER 3. EXPLOITING MEMORY AND SOFT-DECISION IN COVQ
Table 3.10: NBNDC parameters for fitting the Rayleigh DFC with q = 2. γ(dB) 2 (δ = 0.5)
5 (δ = 0.4)
10 (δ = 0.2)
15 (δ = 0.12)
fD T = 0.005 M = 11 ε = 0.7537 α = 0.6362 Cor = 0.22 M = 10 ε = 0.7967 α = 0.6318 Cor = 0.29 M =7 ε = 0.7563 α = 0.5932 Cor = 0.32 M =5 ε = 0.7076 α = 0.5511 Cor = 0.35
fD T = 0.01 M =8 ε = 0.6846 α = 0.5313 Cor = 0.22 M =7 ε = 0.7260 α = 0.5286 Cor = 0.29 M =5 ε = 0.6765 α = 0.4818 Cor = 0.32 M =4 ε = 0.6371 α = 0.399 Cor = 0.34
50
CHAPTER 3. EXPLOITING MEMORY AND SOFT-DECISION IN COVQ
51
Table 3.11: COVQ training results (for DFC-fitted NBNDC-QB) and simulation results (for the Rayleigh DFC) in terms of SDR (dB); memoryless Laplacian source. fD T = 0.01. q
R= n/k 1
1
2
3
1
2
2
3
k 1 2 3 1 2 3 1 2 3 1 2 3 1 2 3 1 2 3
15 2.87 3.47 4.15 6.67 7.69 8.21 9.65 10.78 11.16 2.90 3.51 4.21 6.89 7.97 8.50 10.45 11.50 11.95
Training SNR (dB) 10 5 2.63 2.07 3.12 2.42 3.63 2.64 5.46 3.62 6.22 4.14 6.62 4.56 7.14 4.40 8.20 5.31 8.69 5.92 2.70 2.21 3.23 2.60 3.78 2.86 5.88 4.09 6.69 4.75 7.08 5.15 8.00 5.01 9.16 6.60 9.87 7.25
2 1.59 1.84 1.88 2.46 2.90 3.21 2.91 3.93 4.24 1.77 2.06 2.13 2.89 3.57 3.89 4.19 4.97 5.41
15 2.87 3.46 4.06 6.71 7.71 8.17 9.73 10.79 10.95 2.90 3.50 4.15 6.96 8.01 8.46 10.64 11.48 11.49
Simulation SNR (dB) 10 5 2.63 2.07 3.12 2.41 3.45 2.39 5.45 3.58 6.20 4.10 6.53 4.50 7.15 4.30 8.19 5.26 8.60 5.89 2.70 2.21 3.22 2.59 3.62 2.62 5.98 4.21 6.76 4.76 7.04 4.95 8.28 5.18 8.95 6.08 8.87 6.18
2 1.59 1.84 1.70 2.42 2.89 3.17 2.83 3.94 4.27 1.77 2.06 1.94 2.97 3.53 3.66 4.03 4.55 4.67
CHAPTER 3. EXPLOITING MEMORY AND SOFT-DECISION IN COVQ
52
Table 3.12: COVQ training results (for DFC-fitted NBNDC-QB) and simulation results (for the Rayleigh DFC) in terms of SDR (dB); memoryless Gaussian source. fD T = 0.005. q
R= n/k 1
1
2
3
1
2
2
3
k 1 2 3 1 2 3 1 2 3 1 2 3 1 2 3 1 2 3
15 4.17 7.14 8.11 8.23 10.87 11.79 11.29 13.21 14.25 4.22 7.29 8.37 8.45 11.30 12.40 11.89 14.34 15.62
Training SNR (dB) 10 5 3.76 2.87 5.96 4.05 6.75 4.52 6.71 4.43 8.27 5.46 9.25 6.43 8.36 5.16 10.02 6.85 10.93 7.54 3.87 3.09 6.29 4.48 7.02 5.53 7.13 4.92 9.26 6.79 10.45 7.94 9.07 6.19 11.72 8.65 13.05 9.94
2 2.14 2.78 3.10 3.01 4.21 4.87 3.41 5.14 5.78 2.42 3.22 4.29 3.49 5.28 6.27 5.03 6.78 7.77
15 4.17 7.08 8.07 8.26 10.84 11.79 11.29 13.25 14.25 4.21 7.26 8.30 8.50 11.38 12.32 12.01 14.03 14.27
Simulation SNR (dB) 10 5 3.76 2.86 5.86 3.84 6.54 4.23 6.71 4.38 8.16 5.45 9.37 6.60 8.32 5.02 10.18 7.14 11.11 7.93 3.87 3.09 6.19 4.30 6.91 5.89 7.19 4.94 9.02 6.36 9.85 7.05 9.23 6.03 10.86 7.54 11.29 8.15
2 2.13 2.60 3.03 2.95 4.31 5.08 3.31 5.41 6.19 2.42 3.05 4.49 3.49 4.90 5.59 4.83 6.00 6.54
CHAPTER 3. EXPLOITING MEMORY AND SOFT-DECISION IN COVQ
53
Table 3.13: COVQ training results (for DFC-fitted NBNDC-QB) and simulation results (for the Rayleigh DFC) in terms of SDR (dB); Gauss-Markov source with correlation factor φ = 0.9. fD T = 0.005. q
R= n/k 1
1
2
3
1
2
2
3
k 1 2 3 1 2 3 1 2 3 1 2 3 1 2 3 1 2 3
15 4.18 4.16 4.24 8.23 8.43 8.67 11.26 11.66 11.71 4.23 4.21 4.29 8.44 8.65 8.90 11.86 12.25 12.43
Training SNR (dB) 10 5 3.77 2.88 3.75 2.87 3.81 2.89 6.71 4.44 6.88 4.72 7.08 4.94 8.36 5.17 8.85 5.98 9.13 6.27 3.88 3.10 3.87 3.09 3.93 3.11 7.12 4.93 7.29 5.34 7.49 5.54 9.06 6.20 9.94 7.20 10.30 7.68
2 2.16 2.15 2.15 3.02 3.40 3.59 3.42 4.42 4.61 2.43 2.42 2.43 3.50 4.00 4.27 5.03 5.54 5.82
15 4.18 4.16 4.23 8.23 8.39 8.65 11.25 11.62 11.46 4.23 4.21 4.28 8.47 8.63 8.87 11.97 12.25 11.96
Simulation SNR (dB) 10 5 3.76 2.88 3.75 2.87 3.78 2.85 6.71 4.36 6.83 4.72 7.05 4.96 8.29 5.00 8.88 6.04 9.06 6.34 3.88 3.10 3.87 3.08 3.90 3.08 7.18 4.93 7.29 5.19 7.48 5.34 9.21 6.05 9.65 6.58 9.23 6.57
2 2.16 2.14 2.14 2.95 3.42 3.61 3.32 4.53 4.72 2.43 2.42 2.41 3.50 3.89 4.07 4.82 5.06 5.11
CHAPTER 3. EXPLOITING MEMORY AND SOFT-DECISION IN COVQ
54
Table 3.14: The ρ and δ values for the NBNDC-QB for soft-decision resolutions q = 1, 2, 3. SNR (dB) 15
10
5
2
0
q 1 2 3 1 2 3 1 2 3 1 2 3 1 2 3
δ 0.12 0.60 0.20 0.11 0.40 0.18 0.50 0.25 0.60 0.31
ρ0 0.992 0.972 0.955 0.977 0.924 0.865 0.936 0.782 0.703 0.892 0.695 0.563 0.854 0.627 0.472
ρ1 0.008 0.020 0.018 0.023 0.053 0.051 0.064 0.154 0.100 0.108 0.196 0.132 0.146 0.227 0.145
ρ2 0.006 0.012 0.019 0.037 0.054 0.078 0.085 0.112 0.110 0.132
ρ3 0.001 0.008 0.005 0.024 0.010 0.055 0.024 0.084 0.036 0.104
ρ4 0.004 0.013 0.034 0.054 0.071
ρ5 0.002 0.006 0.018 0.031 0.041
ρ6 0.001 0.003 0.008 0.015 0.021
ρ7 0.000 0.001 0.005 0.009 0.013
Chapter 4 Joint Source-Channel MAP Decoding of the NBNDC-QB The COVQ system explained in Chapter 3 is only able to take advantage of the intrablock memory (the dependency within each codeword block) of the data sent over the channel. As a result, the inter-block memory of codewords (the dependency on the previous received blocks of the current block) are discarded during the system design. In this chapter, we describe a source-channel decoding approach which utilizes interblock memory. This also extends the work in [26], where only binary output channels with Markovian noise are examined. In particular, we study the sequence maximuma-posteriori (MAP) decoding problem of quantized sources over the NBNDC-QB and the correlated Rayleigh DFC described in Chapter 2. We consider a scalar quantizer (SQ) designed for a noiseless channel. The SQ output is passed through an index assignment mapping and then sent over the channel. The output is soft-demodulated with resolution q and delivered to a sequence MAP detector to combat channel errors. As in [26], we refer to such a coding scheme as SQ-MAP. We use scalar-quantization, 55
CHAPTER 4. SQ-MAP OVER THE NBNDC-QB
56
rather than vector-quantization (VQ), since although VQ achieves better signal-todistortion (SDR) performance due to the space-filling gain, it retains less redundancy in the index codewords at the quantizer output; but using SQ, such redundancy is kept to be exploited by the MAP decoder together with the channel’s characteristics, for error correction. As a result, it is likely for the system to perform better using an SQ. It is important to mention that the SQ-MAP scheme is designed to minimize the sequence error probability, while we evaluate the performance of the system via the signal-to-distortion ratio (SDR) with the mean square error (MSE) distortion measure. Hence, the SQ-MAP is not necessarily optimal in terms of achieving minimum mean square error (MMSE). However, this system has tractably low complexity as well as good performance according to simulations results, which makes it an efficient joint source-channel coding scheme. MMSE optimal and suboptimal MAP decoding metrics are studied in [23,34]. Furthermore, in this work, we study the use of residual source redundancy as well as noise correlation and soft-decision information on the NBNDC model, in order to achieve better SDR performance. Minimizing distortion via improved MAP metrics is not studied here. Similar to Chapter 3, we show that the channel’s memory and soft-decision information can be exploited to improve the SQ-MAP system performance. We also numerically show that the NBNDC-QB effectively models the Rayleigh DFC when measured in terms of SDR performance. Furthermore, we prove a theorem for a specific case of our system setup (SQ-MAP for the NBNDC-QB), in which we provide necessary and sufficient condition for a sequence MAP decoder to be replaceable with a simple instantaneous (symbol-by-symbol) decoding rule.
CHAPTER 4. SQ-MAP OVER THE NBNDC-QB
4.1
57
Sequence MAP decoding
Figure 4.1: Block diagram of an SQ-MAP system.
4.1.1
System setup
Consider the communication system depicted in Figure 4.1. The analog source V = {Vi }∞ i=1 is assumed to be a real-valued stationary ergodic process. The scalar quantizer (SQ) encoder is a mapping γ from the real domain of source symbols to the index set {0, 1, . . . , 2n − 1}, such that γ(v) = i if v ∈ Si , where {Si : i ∈ {0, 1, . . . , 2n − 1}} is a partition of R. Hence the SQ rate is R = n. The partitions are chosen according to Lloyd-Max formulation given in Chapter 2, with the initial codebook selection obtained via the splitting algorithm, described in Section 3.1.2. As in the COVQ system, the index assignment module is a one-to-one mapping, which maps each index i to a binary vector x ∈ {0, 1}n b : {0, 1, . . . , 2n − 1} → {0, 1}n ,
b(i) = x
where x is represented in binary form. Since the mapping is one-to-one, for a given index mapping b, we can present the quantization regions by Sx instead of Si , where
CHAPTER 4. SQ-MAP OVER THE NBNDC-QB
58
Figure 4.2: FBC and NBC index assignments for an hypothetical source distribution and its quantization regions; MSB is the rightmost bit.
b(i) = x. To assign a binary n-tuple codeword to each index, different index assignment methods such as the natural binary code (NBC), the folded binary code (FBC), simulated annealing, and some heuristic assignment methods were tested. The FBC was selected because of its simplicity and good performance. An example of the FBC and NBC index assignment (with the right-most bit as the most significant bit) is depicted in Figure 4.2, for a hypothetical source with the probability density shown in the figure. The horizontal line represents the real axis and the quantization regions are separated by the short vertical lines. Note that the FBC index assignment tends to set more zeros to the rightmost bits of the codewords corresponding to codelevels with moderate values. Since the source distributions used here are symmetric and denser around the origin, the rightmost bits are more likely to be zero. This non-uniformity of the distribution of zeros and ones in each codeword leads to more
CHAPTER 4. SQ-MAP OVER THE NBNDC-QB
59
redundancy in the codewords which helps to improve the performance of the sequence MAP decoder. The n-tuple codeword x is then sent bit-by-bit over the NBNDC-QB channel where it is affected by the error n-tuple z n . The channel output y ∈ {0, 1, . . . , 2q − 1}n , corresponding to each binary n-tuple x sent over the channel, is fed to a MAP decoder where the data redundancy is used for error correction. Finally, the SQ decoder β maps the decoder output x ˆ into output levels of the quantizer codebook β(ˆ x) = cxˆ , cxˆ ∈ R, x ˆ ∈ {0, 1}n .
4.1.2
MAP decoder design
The MAP decoder is designed to minimize the sequence error probability by exploiting the residual redundancy of the source and channel model statistics to combat channel errors. Since we are considering a general source, the redundancy ρT , in general, is due to a combination of non-uniformity of the distribution (ρD ) and memory (ρM ), such that ρT = ρD + ρM . Similar to [26], we first assume to have an i.i.d. source and then we modify the metric for sources with memory. If V is i.i.d., then the SQ encoder output process, X = {Xi }, is also i.i.d. Hence ρM = 0 and the only remaining redundancy is due to non-uniformity of the source. Consequently, the MAP detector could be considered as a system observing a sequence of n-tuples yN = (y1 , y2 , . . . , yN ) ∈ {0, 1, . . . , 2q − 1}nN , where q is the soft-decision quantization resolution, N denotes the number of source symbols to be transmitted over the channel, and n is the codeword length. Note that since the transmission over the channel is done bit-by-bit (and not n-tuple
CHAPTER 4. SQ-MAP OVER THE NBNDC-QB
60
by n-tuple), the observation of the MAP detector can also be considered as sequence of 2q -ary symbols y nN = (y1 , y2 , . . . , ynN ) ∈ {0, 1, . . . , 2q − 1}nN , where yk = (y(k−1)n+1 , y(k−1)n+2 , . . . , y(kn) ), k = 1, 2, . . . , N . yN is a noisy observation of the source sequence xN = (x1 , x2 , . . . , xN ) ∈ {0, 1}nN , which can be similarly represented bit-by-bit via xnN = (x1 , x2 , . . . , xnN ) ∈ {0, 1}nN , where xk = (x(k−1)n+1 , x(k−1)n+2 , . . . , x(kn) ), k = 1, 2, . . . , N . Therefore, the n-tuple by n-tuple and bit-by-bit notations can be interchangeably used for ease of explanation. The channel contaminates the source bits via 2q -ary error symbols z nN = (z1 , z2 , . . . , znN ) ∈ {0, 1, . . . , 2q − 1}nN . The MAP decoder estimates xN by x ˆN according to x ˆN = arg max P r{XN = xN | YN = yN }. xN
Similar to the reasoning in [2, 27], the above equation is equivalent to ˆ N = arg x = arg = arg
max
P r{Y nN = y nN | X nN = xnN }P r{X nN = xnN }
max
P r{Z nN = z nN }P r{X nN = xnN } " # N −1 � � Y ni+n ni Q(z1n )P (x1 ) Q(zni+1 |z1 )P (xi+1 )
xnN ∈{0,1}nN xnN ∈{0,1}nN
max
xnN ∈{0,1}nN
(4.1)
i=1
where i+j i Q(zi+1 |zi−k ) , P r{Zi+1 = zi+1 , Zi+2 = zi+2 , . . . , Zi+j = zi+j |Zi = zi , . . . , Zi−k = zi−k },
i, j, k ∈ {1, 2, . . . , nN − 1}, i + j ≤ nN, i − k ≥ 1, and P (xi ) , P r{Xi = xi } is the probability mass function of the n-tuple codewords. Note that since the channel model we are considering is the NBNDC-QB with Markovian memory order M , for nN > M (which is always the considered case since N is
CHAPTER 4. SQ-MAP OVER THE NBNDC-QB
61
assumed to be large,) it can be shown that (4.1) is equivalent to N
x ˆ =
(n) arg max{log[PNBNDC-QB (z1n )p(x1 )] N x
+
N −1 X
(i+1)n
in log[Q(zin+1 | zin−(M −1) )p(xi+1 )]},
i=1
(4.2) where
j+n
Y i=j+1
i−1 X δzi ,z`
`=i−(M −1)
j+n j Q(zj+1 | zj−(M −1) ) = ε + (1 − ε)ρzi , + αδzi ,zi−M × M −1+α
(4.3)
(n)
which is obtained from (2.4), zi , 0 if i < 1, zij = (zi , zi+1 , . . . , zj ), j ≥ i, PNBNDC-QB (z1n ) = P r{Z1n = z1n } is given via (2.6)-(2.8), and z is related to its corresponding symbols x, y via (2.3). According to (4.2) and (4.3), the MAP detection can be implemented using a modified version of the Viterbi algorithm [15]. We consider the state space to be the set of all possible n-tuple codewords. Therefore, the trellis has 2n states, each having 2n outgoing and entering states and the path metric at step i is (i+1)n
in log[Q(zin+1 | zin−(M −1) )P (xi )].
When the source has memory, we assume that it forms a discrete Markov chain of order 1 with state transition probability matrix P (xi | xi−1 ), and the path metric will be updated to (i+1)n
in log[Q(zin+1 | zin−(M −1) )P (xi | xi−1 )].
The pmf P (xi ) and state transition matrix [P (xi | xi−1 )] of the source codewords are calculated from a training set of symbols (the same training set used for designing the SQ).
CHAPTER 4. SQ-MAP OVER THE NBNDC-QB
62
The SQ-MAP system has low complexity due to the Viterbi algorithm and the simplicity of SQ encoding/decoding. On the other hand, the sequence MAP detector imposes a significant amount of delay in the receiver since the decoder needs to receive all of the nN symbols to be able to minimize the sequence probably of error. Furthermore, the storage complexity of the system grows with asymptotical growth order O(nN 2n ). Hence, the storage requirement becomes unmanageable for very large values of nN . Therefore, it is useful to know when it is possible to replace the MAP detector with an instantaneous (symbol-by-symbol) decoding rule, without sacrificing the system’s optimality in terms of sequence probability of error.
4.1.3
A specific case of the SQ-MAP system
In this section, we consider the MAP decoder system with the SQ coding rate R = n = 1 for the NBNDC-QB with memory order M = 1. We investigate necessary and sufficient conditions for the MAP detector to be replaceable with a symbol-by-symbol instantaneous decoder (mapping) without losing system optimality. We call the MAP detector useless, when it can be replaced with the instantaneous mapping. According to Figure 4.1, the output of the SQ is a binary n-tuple. Letting R = n = 1, the SQ output is binary. The binary sequence xi , i = 1, 2, . . . , N is transmitted across the NBNDC-QB. According to the queue noise model, as stated in Chapter 2, for M = 1, the noise process is a homogeneous first-order Markov process. Recall that Q(zn ) , P r{Zn = zn } and Q(zn |zn−1 ) , P r{Zn = zn |zn−1 = zn−1 }, zn ∈ {0, 1, 2, . . . , 2q − 1}.
CHAPTER 4. SQ-MAP OVER THE NBNDC-QB
63
In this section, we always consider the special case M = 1. As a result, according to the channel noise model, α = 1. Furthermore, it can be seen that the probability distribution of the noise is Q(zn ) = ρzn ,
zn ∈ Y,
(4.4)
where ρzi is known from the noise model. The matrix Q = [Q(i|j)], i, j ∈ {0, 1, . . . , 2q − 1} can be calculated in closed form, for arbitrary q, via
Q(i|j) = [εδi,j + (1 − ε)ρzi ] , where δi,j =
(4.5)
1, if i = j 0, if i 6= j.
For instance, letting q = 2 we have: Q(0|0) Q(1|0) Q(2|0) Q(3|0) Q(0|1) Q(1|1) Q(2|1) Q(3|1) Q = Q(0|2) Q(1|2) Q(2|2) Q(3|2) Q(0|3) Q(1|3) Q(2|3) Q(3|3) (1 − ε)ρ1 (1 − ε)ρ2 (1 − ε)ρ3 ε + (1 − ε)ρ0 (1 − ε)ρ0 ε + (1 − ε)ρ1 (1 − ε)ρ2 (1 − ε)ρ3 = (1 − ε)ρ (1 − ε)ρ1 ε + (1 − ε)ρ2 (1 − ε)ρ3 0 (1 − ε)ρ0 (1 − ε)ρ1 (1 − ε)ρ2 ε + (1 − ε)ρ3
.
The channel output is fed to the MAP decoder described in the previous section.
CHAPTER 4. SQ-MAP OVER THE NBNDC-QB
64
To figure out when the MAP detector is useless, we find necessary and sufficient conditions such that applying MAP detector does not yield a lower sequence error probability than applying a mapping θ, where θ is a mapping from the set of channel output alphabet to the binary input alphabet, i.e. θ(yn ) = y˜n , with
yn ∈ Y = {0, 1, . . . , 2q − 1}, y˜n ∈ {0, 1},
(4.6)
0, if yn ∈ Y0 ; y˜n = 1, if yn ∈ Y1 ,
where, Y1 = Y0c ⊆ Y. To replace the MAP detector with the mapping we simply skip the MAP detector and set xˆi = y˜i , i = 1, 2, . . . , N . Lemma 4.1. For the NBNDC-QB with parameters satisfying the condition ρ0 ≥ ρ1 ≥ ρ2 ≥ . . . ≥ ρ2q −1 ,
(4.7)
among all mappings θ : {0, 1, . . . , 2q − 1} → {0, 1}, the following mapping θ∗ yields the lowest symbol probability of error: θ∗ (yn ) , y˜n =
0, if yn < k ∗ ;
(4.8)
1, otherwise. where k ∗ ∈ {0, 1, . . . , 2q } is the smallest value satisfying ρk∗ ρ2q −k∗ −1
≤
P (1) , P (0)
(4.9)
where ρ−1 , ∞, ρ2q , 0, and P (x) , P r{X = x}, x ∈ {0, 1}. In other words, assuming (4.7) holds, setting Y0 = {0, 1, . . . , k ∗ − 1}, Y1 = Y0c = {k ∗ , k ∗ + 1, . . . , 2q − 1}, with Y0 = ∅ for k ∗ = 0 and Y1 = ∅ for k ∗ = 2q , yields the best symbol probability of error, among all instantaneous mapping rules.
CHAPTER 4. SQ-MAP OVER THE NBNDC-QB
65
Proof. We first show that any general mapping other than θ∗ defined via (4.8), can be modified to have a less than or equal symbol error probability. To this end, we consider the mapping as a classification rule that classifies 2q different output symbols from {0, 1, . . . , 2q − 1} into two classes Y0 and Y1 . According to (4.8), for θ∗ we have Y0∗ = {0, 1, . . . , k ∗ − 1} and Y1∗ = {k ∗ , k ∗ + 1, . . . , 2q − 1}. Let Pe denote the symbol error probability under mapping θ Pe , P r{θ(Y ) 6= X}. If θ 6= θ∗ , at least one of the two following cases happen: i) There exists an element a ∈ Y1 , such that a < k ∗ . Removing a from Y1 and adding it to Y0 yields Pe2 − Pe1 = P r{Y = a|X = 1}P r{X = 1} − P r{Y = a|X = 0}P r{X = 0} = Q(2q − 1 − a)P (1) − Q(a)P (0) = P (1)ρ2q −1−a − P (0)ρa , where Pe2 represents the error probability after a is placed in Y0 and Pe1 is the error probability before this modification. According to (4.7), ρa ≥ ρk∗ −1 and ρ2q −k∗ ≥ ρ2q −1−a . Hence by (4.9), P (1) ρk∗ −1 ρa ≤ ≤ P (0) ρ2q −k∗ ρ2q −1−a and therefore, Pe2 − Pe1 ≤ 0. Thus, putting a into Y0 will not increase the error probability.
CHAPTER 4. SQ-MAP OVER THE NBNDC-QB
66
ii) There exists an element b ∈ Y0 , such that b ≥ k ∗ . Similarly, it can be shown that Pe2 − Pe1 = −P (1)ρ2q −1−b + P (0)ρb . According to (4.7), ρb ≤ ρk∗ and ρ2q −k∗ −1 ≤ ρ2q −1−b . Hence by (4.9), P (1) ρk∗ ρb ≥ ≥ P (0) ρ2q −k∗ −1 ρ2q −1−b and therefore, Pe2 − Pe1 ≤ 0. Thus, removing b from Y0 and adding it to Y1 does not increase error probability. The proof is complete by observing that by repeatedly applying the above replacements, the mapping obtained will be identical to θ∗ .
As mentioned in the previous section, the sequence {Xi } (which is the same as {Xi } here, since R = 1) is modeled via a first order stationary Markov chain. Define pxn ,xn−1 , P (xn |xn−1 ) , P r{Xn = xn |Xn−1 = xn−1 }
(4.10)
and pxn , P (xn ) , P r{Xn = xn }, where xn ∈ {0, 1}. For the special case of a symmetric binary Markov source i.e., P (0)/P (1) = 1, it can be seen from (4.9) that for k ∗ = 2q−1 i) ii)
ρk ∗
=
ρ2q−1 ≤ 1, ρ2q−1 −1
ρ2q −k∗ −1 ρk∗ −1 ρ2q−1 −1 = ≥ 1. ρ2q −k∗ ρ2q−1
CHAPTER 4. SQ-MAP OVER THE NBNDC-QB
67
From now on in this subsection, we will only consider symmetric binary Markov sources (i.e., we assume that p00 = p11 ). Define the auxiliary binary noise symbol z˜n which is related to its corresponding noise symbol zn via z˜n =
0, if zn < 2q−1 ;
(4.11)
1, otherwise. The sequence of auxiliary binary noise symbols represents the auxiliary noise process ∞ ∞ {Z˜n }∞ n=1 . Since the noise process {Zn }n=1 is independent of the input process {Xn }n=1
and the auxiliary binary noise variable Z˜n is only a function of Zn , the auxiliary noise ∞ process {Z˜n }∞ n=1 is also independent of the input process {Xn }n=1 . Correspondingly,
we can define ˜ zn ) , P r{Z˜n = z˜n } Q(˜ ˜ zn |˜ Q(˜ zn−1 ) , P r{Z˜n = z˜n |Z˜n−1 = z˜n−1 }.
It can be seen that P r {Zn ∈ {0, 1, . . . , 2q−1 − 1}} , if z˜n = 0; ˜ zn ) = Q(˜ P r {Zn ∈ {2q−1 , 2q−1 + 1, . . . , 2q − 1}} , if z˜n = 1.
(4.12)
Therefore, according to (4.4) ˜ ˜ Q(0) = 1 − Q(1) = ρ0 + ρ1 + ρ2 + . . . + ρ2q−1 −1 .
(4.13)
Lemma 4.2. The auxiliary noise process {Z˜n }∞ n=1 forms a first order Markov chain, if {Zn }∞ n=1 is a first-order Markov chain.
CHAPTER 4. SQ-MAP OVER THE NBNDC-QB
68
Proof. We use a theorem given in [11, p. 325] [18] which states that if {Zn }∞ n=1 is ˜ a Markov process, then a sufficient condition for the process {Z˜n }∞ n=1 , where Zn = f (Zn ), to be a Markovian is that P r{Z˜n+1 = z˜n+1 |Zn = zn } = P r{Z˜n+1 = z˜n+1 |Z˜n = f (zn )},
(4.14)
for all z˜n+1 and zn , where f (·) is a function mapping the state space SZ = Y into the set {0, 1}. Let the function f be given by (4.11). Then using (4.5), we have � P r{Z˜n+1 = 0|Zn = zn } = P r Zn+1 ∈ {0, 1, . . . , 2q−1 − 1}|Zn = zn = P r{Zn+1 = 0|Zn = zn } + P r{Zn+1 = 1|Zn = zn } + . . . + P r{Zn+1 = 2q−1 − 1|Zn = zn } = Q(0|zn ) + Q(1|zn ) + . . . + Q(2q−1 − 1|zn ) ε + P2q−1 −1 (1 − ε)ρi , if zn < 2q−1 ; i=0 = P q−1 2i=0 −1 (1 − ε)ρi , if zn ≥ 2q−1 .
(4.15)
Also n o P r{Z = 0} n P r{Z˜n+1 = 0|Z˜n = 0} = P r Z˜n+1 = 0|Zn = 0 + P r{Z˜n = 0} n o P r{Z = 1} n P r Z˜n+1 = 0|Zn = 1 ˜ P r{Zn = 0} +... + (4.16) n o P r{Z = 2q−1 − 1} n P r Z˜n+1 = 0|Zn = 2q−1 − 1 . P r{Z˜n = 0} Note that according to (4.15), P r{Z˜n+1 = 0|Zn = 0} = {Z˜n+1 = 0|Zn = 1} = ... = {Z˜n+1 = 0|Zn = 2q−1 − 1} = ε +
2q−1 X−1
(1 − ε)ρi .
i=0
CHAPTER 4. SQ-MAP OVER THE NBNDC-QB
69
Hence, (4.16) is equal to q−1
2X −1 � � P r{Zn = 0} + P r{Zn = 1} + . . . + P r{Zn = 2q−1 − 1} ε+ (1 − ε)ρi × P r{Z˜n = 0} i=0 q−1
2X −1 � � P r{Z˜n = 0} = ε+ (1 − ε)ρi × P r{Z˜n = 0} i=0
= ε+
2q−1 X−1
(1 − ε)ρi .
i=0
With the same reasoning, it can be shown that P r{Z˜n+1 = 0|Z˜n = 1} = 1 − P r{Z˜n+1 = 1|Z˜n = 1} =
2q−1 X−1
(1 − ε)ρi .
(4.17)
i=0
Thus condition (4.14) is satisfied for the NBNDC-QB with memory order M = 1 and for the function f (·) given via (4.11). Consequently, the process {Z˜n }∞ n=1 is a first order Markov chain. Since {Z˜n }∞ n=1 is Markov process, it can be shown that its state transition proba˜ is bility matrix Q
˜ ˜ Q(0|0) Q(1|0) ˜ = Q ˜ ˜ Q(0|1) Q(1|0) ˜ ˜ (1 − ε)Q(1) ε + (1 − ε)Q(0) = , ˜ ˜ (1 − ε)Q(0) ε + (1 − ε)Q(1)
(4.18)
˜ zn ) is given in (4.12). where Q(˜ Note by the definition of the NBNDC given via (2.2), the mapping θ∗ described in (4.8), and the fact that for symmetric binary Markov sources k ∗ = 2q−1 , it can be seen that if y˜n = xn , then zn < 2q−1 (and hence z˜n = 0) and vice versa. As a result,
CHAPTER 4. SQ-MAP OVER THE NBNDC-QB
70
the auxiliary binary noise symbol can also be defined in terms of the input xn and y˜n 0, if y˜n = xn ; (4.19) z˜n , 1, if y˜n = xcn , where xcn is the binary complement of xn and y˜n = θ∗ (yn ). We next seek the answer to question “for a given sequence MAP decoder system, when is it optimal to replace the N -sequence MAP detector with an application of an instantaneous mapping (such as θ∗ ) applied N times? ”. In other words, “when is ˆ N = Y˜ N an optimal sequence (MAP) detection rule, in the sense of minimizing the X sequence error probability? ”. The answer to this question is partly given in [3]. To be more specific, for q = 1 the NBNDC model is identical to the queue based channel (QBC) model which is introduced in [37]. It is shown there that for α = 1 (which is the case here since M = 1), the channel reduces to the binary Markov channel described in Chapter 2. Theorem 1 of [3] states necessary and sufficient conditions for the MAP decoder to be useless over a binary Markov channel and for binary Markov sources. In this case, ˆN = Y N) a MAP decoder is defined to be useless when it decodes what is sees (i.e., X and thus does not make any improvement in the channel bit error rate. As a result, they show that under certain conditions, it is optimal to skip the MAP decoder and believe in what is seen in the receiver. Note that skipping the decoder and believing in the output sequence can only be applied for q = 1 so that the output sequence is also binary. On the other hand, for q ≥ 2, the received sequence is not binary; hence, we use the mapping θ∗ in order to convert the 2q -ary received sequence Y N , into a binary sequence Y˜ N . Since θ∗ is also (trivially) defined for q = 1 (k ∗ = 1 here and y˜ = y), Theorem 1 of [3] yields necessary and sufficient conditions for the mapping
CHAPTER 4. SQ-MAP OVER THE NBNDC-QB
71
θ∗ to be an optimal sequence detection rule for q = 1. The following theorem gives a necessary and sufficient condition for the mapping θ∗ to be an optimal sequence detection rule for q > 1. Theorem 4.1. For a symmetric binary Markov source with p00 = p11 ∈ [ 12 , 1] and the NBNDC-QB with correlation parameter ε ≥ 0, memory order M = 1, q > 1, and satisfying (4.7), assume that sequence length N ≥ 3, X1 = Y˜1 , and XN = Y˜N . Then ˆ N = Y˜ N is an optimal sequence MAP detection rule if and only if X � �2 ρ2q−1 −1 1 − p00 ≥ 1, × ρ2q−1 p00
(4.20)
where Y˜ N = θ∗ (Y N ) is obtained via applying the mapping θ∗ N -times component-wise to Y N . Proof. For θ∗ to be the optimal detection rule, then ∀xN ∈ {0, 1}N and ∀y N ∈ {0, 1, . . . , 2q − 1}N , we should have γ,
P r{X N = y˜N |Y N = y N } ≥ 1. P r{X N = xN |Y N = y N }
γ can be written as γ =
P r{Y N = y N |X N = y˜N }P r{X N = y˜N } . P r{Y N = y N |X N = xN }P r{X N = xN }
Note that by (2.3) and (2.5), we have P r{Y N = y N |X N = xN } = P r{Z N = z n }, where zi ,
yi −(2q −1)xi , (−1)xi
i = 1, 2, . . . , N . Also note that by definition of θ∗ (with
k ∗ = 2q−1 ), we have that ai ,
yi −(2q −1)˜ yi (−1)y˜i
∈ {0, 1, . . . , 2q−1 − 1}, where y˜i = θ∗ (yi ), i =
CHAPTER 4. SQ-MAP OVER THE NBNDC-QB
72
1, 2, . . . , N . Define A , P r{Z N = aN }P r{X N = y˜N }, aN ∈ {0, 1, . . . , 2q−1 − 1}N , B , P r{Z N = z N }P r{X N = xN }, z N ∈ {0, 1, . . . , 2q − 1}N ,
where aN = (a1 , a2 , . . . , aN ) and z N = (z1 , z2 , . . . , zn ) are defined above. Hence, P r{Z N = aN }P r{X N = y˜N } A = B P r{Z N = z N }P r{X N = xN } # � �" N P r{Z1 = a1 }P (˜ y1 ) Y Q(ak |ak−1 )P (˜ yk |˜ yk−1 ) = P r{Z1 = z1 }P (x1 ) k=2 Q(zk |zk−1 )P (xk |xk−1 )
γ =
=
N Y Q(ak |ak−1 )P (˜ yk |˜ yk−1 ) k=2
Q(zk |zk−1 )P (xk |xk−1 )
,
where the last equality follows from P r{Z1 = a1 }P (˜ y1 ) = P r{Z1 = z1 }P (x1 ) since X1 = Y˜1 according to the hypothesis. We partition the index set as follows: K = A1 ∪ A2 ∪ A3 ∪ A4 , where K , {2, 3, . . . , N }, A1 , {k ∈ K : xk = y˜k , xk−1 = y˜k−1 }, A2 , {k ∈ K : xk 6= y˜k , xk−1 6= y˜k−1 }, A3 , {k ∈ K : xk 6= y˜k , xk−1 = y˜k−1 }, A4 , {k ∈ K : xk = y˜k , xk−1 6= y˜k−1 }. Hence, γ=
4 Y Y Q(ak |ak−1 )P (˜ yk |˜ yk−1 ) . Q(z |z )P (x |x ) k k−1 k k−1 i=1 k∈A i
In set A1 , since xk = y˜k and xk−1 = y˜k−1 we see that zk = ak and zk−1 = ak−1 . Thus, Y Q(ak |ak−1 )P (˜ Y Q(ak |ak−1 )P (xk |xk−1 ) yk |˜ yk−1 ) = = 1, Q(zk |zk−1 )P (xk |xk−1 ) k∈A Q(ak |ak−1 )P (xk |xk−1 ) k∈A 1
1
CHAPTER 4. SQ-MAP OVER THE NBNDC-QB
73
In A2 , xk 6= y˜k and xk−1 6= y˜k−1 imply that xk = 1 − y˜k and xk−1 = 1 − y˜k−1 . Also, if xk 6= y˜k and xk−1 6= y˜k−1 , then by (4.11) and (4.19) zk , zk−1 ≥ 2q−1 . Now since the Markov source is symmetric (p00 = p11 ), we obtain that P (˜ yk |˜ yk−1 ) = P (xk |xk−1 ). Noting ak , ak−1 < 2q−1 and according to (4.5) and (4.7) Y Q(ak |ak−1 ) Y Q(ak |ak−1 )P (˜ yk |˜ yk−1 ) = ≥ 1. Q(z Q(z k |zk−1 )P (xk |xk−1 ) k |zk−1 ) k∈A k∈A 2
2
We next note that since X1 = Y˜1 and XN = Y˜N , for each k ∈ A3 there should exist a corresponding index ` ∈ A4 and vice versa. As a result, |A3 | = |A4 | where |A3 | denotes the number of elements in set A3 . Furthermore, in A3 we have xk 6= y˜k implying xk = 1 − y˜k . Therefore, according to the definitions of zk and ak and using (2.3), it can be seen that zk = (2q − 1) − ak and zk−1 = ak−1 . Similarly, in set A4 we have zk = ak and zk−1 = (2q − 1) − ak−1 . Besides, due to the source symmetry and noting that p00 ∈ [ 21 , 1], we have min
k∈A3
p10 P (˜ yj |˜ yj−1 ) 1 − p00 P (˜ yk |˜ yk−1 ) = min = = . P (xk |xk−1 ) j∈A4 P (xj |xj−1 ) p00 p00
Now according to (4.5) and (4.7), we have Y Q(ak |ak−1 )P (˜ Y Q(ak |ak−1 )P (˜ yk |˜ yk−1 ) yk |˜ yk−1 ) × Q(zk |zk−1 )P (xk |xk−1 ) k∈A Q(zk |zk−1 )P (xk |xk−1 ) k∈A3 4 Y Q(ak |ak−1 )(1 − p00 ) Y Q(ak |ak−1 )(1 − p00 ) ≥ × Q(2q − 1 − ak |ak−1 )p00 k∈A Q(ak |2q − 1 − ak−1 )p00 k∈A3 4 | {z } (α)
Y (1 − ε)ρ2q−1 −1 (1 − p00 ) Y (1 − p00 ) ≥ × (1 − ε)ρ2q−1 p00 p00 k∈A k∈A 3
4
|A3 |
=
Y ρ2q−1 −1 i=1
ρ2q−1
� ×
1 − p00 p00
where (α) follows by noting that
�2 ,
Q(ak |ak−1 ) Q(ak |2q −1−ak−1 )
≥ 1, ∀k ∈ A4 . Evidently, if (4.20)
CHAPTER 4. SQ-MAP OVER THE NBNDC-QB
74
holds, then |A3 |
Y ρ2q−1 −1 i=1
ρ2q−1
�
1 − p00 × p00
�2 ≥ 1.
Thus γ ≥ 1 and the mapping θ∗ is an optimal MAP decoding rule. To prove the converse, assume that (4.20) does not hold; i.e., �2 � ρ2q−1 −1 1 − p00 × < 1. ρ2q−1 p00 Now for X N = (0, 0, . . . , 0) and Y N = (0, 0, . . . , 0, 2q−1 , 0, . . . , 0) where the only nonzero component of Y N is in any arbitrary position i ∈ {2, . . . , N − 1}, we have � γ = 1 × 1 × ... ×
� �2 � 1 − p00 ρ2q−1 −1 × × 1 × . . . × 1 < 1. ρ2q−1 p00
Hence, if (4.20) does not hold, there exists some X N and Y N such that the mapping θ∗ does not decode optimally.
For the binary symmetric first-order Markov sources with p00 = p11 ∈ [0, 12 ), with the same approach, a similar theorem can be proved with the following condition � �2 p00 ρ2q−1 −1 × ≥ 1. ρ2q−1 1 − p00 Tables 4.1-4.4 depict the simulation results for three binary symmetric sources, in terms of symbol error rate over the NBNDC-QB with noise correlations Cor = 0.0, 0.9, soft-decision resolutions q = 1, 2, 3, and different SNRs. The calculated values for condition (4.20), denoted by C, are also given in the tables. For q = 1, the values C are calculated via the condition in Theorem 1 of [3]. The ρ values for the simulations can be seen in Table 3.14. It is observed from Tables 4.1-4.4 that the results verify Theorem 4.1, since for all the cases where (4.20) holds the MAP decoder and the
CHAPTER 4. SQ-MAP OVER THE NBNDC-QB
75
instantaneous mapping perform equally (they both actually output the same decoded sequence). It is also observed that for the cases where (4.20) does not hold, the mapping θ∗ does not perform as well as the MAP decoder, so that it is not optimal in these cases. An other interesting observation is that for q = 1, the optimality of the mapping θ∗ is dependent on the channel noise correlation (as it is observed numerically and analytically in [3]), while for q > 1, this is not the case.
0.5
p00
0.9
0
Cor
3
2
1
3
2
1
q
15 MAP θ∗ C = 128.48 > 1 0.76 0.76 C = 3.12 > 1 0.76 0.76 C = 1.79 > 1 0.76 0.76 C = 13028.96 > 1 0.70 0.70 C = 3.12 > 1 0.70 0.70 C = 1.79 > 1 0.70 0.70
10 MAP θ∗ C = 41.98 > 1 2.30 2.30 C = 2.82 > 1 2.30 2.30 C = 1.79 > 1 2.30 2.30 C = 4379.55 > 1 2.21 2.21 C = 2.82 > 1 2.21 2.21 C = 1.79 > 1 2.21 2.21
SNR 5 MAP θ∗ C = 14.58 > 1 6.43 6.43 C = 2.85 > 1 6.43 6.43 C = 1.63 > 1 6.43 6.43 C = 1643.61 > 1 6.12 6.12 C = 2.85 > 1 6.12 6.12 C = 1.63 > 1 6.12 6.12 2 MAP θ∗ C = 8.22 > 1 10.85 10.85 C = 2.31 > 1 10.85 10.85 C = 1.54 > 1 10.85 10.85 C = 1011.65 > 1 10.69 10.69 C = 2.31 > 1 10.69 10.69 C = 1.54 > 1 10.69 10.69
0 MAP θ∗ C = 5.83 > 1 14.65 14.65 C = 2.06 > 1 14.65 14.65 C = 1.47 > 1 14.65 14.65 C = 776.74 > 1 14.56 14.56 C = 2.06 > 1 14.56 14.56 C = 1.47 > 1 14.56 14.56
Table 4.1: Symbol error rate (in%) for MAP decoding and instantaneous mapping θ∗ for symmetric binary Markov sources with p00 = 0.5 (i.i.d. source). The channel model is the NBNDC-QB, with M = 1, Cor = 0, 0.9, and q = 1, 2, 3. The values C are calculated from (4.20).
CHAPTER 4. SQ-MAP OVER THE NBNDC-QB 76
0.6
p00
0
0
Cor
3
2
1
3
2
1
q
15 MAP θ∗ C = 57.10 > 1 0.76 0.76 C = 1.39 > 1 0.76 0.76 C = 0.80 < 1 0.73 0.76 C = 5790.65 > 1 0.70 0.70 C = 1.39 > 1 0.70 0.70 C = 0.80 < 1 0.65 0.70
10 MAP θ∗ C = 18.66 > 1 2.30 2.30 C = 1.25 > 1 2.30 2.30 C = 0.80 < 1 2.22 2.30 C = 1946.47 > 1 2.21 2.21 C = 1.25 > 1 2.21 2.21 C = 0.80 < 1 2.15 2.21
SNR 5 MAP θ∗ C = 6.48 > 1 6.43 6.43 C = 1.27 > 1 6.43 6.43 C = 0.73 < 1 6.23 6.43 C = 730.49 > 1 6.12 6.12 C = 1.27 > 1 6.12 6.12 C = 0.73 < 1 6.04 6.12 2 MAP θ∗ C = 3.65 > 1 10.85 10.85 C = 1.03 > 1 10.85 10.85 C = 0.68 < 1 10.55 10.85 C = 449.62 > 1 10.69 10.69 C = 1.03 > 1 10.69 10.69 C = 0.68 < 1 10.30 10.69
0 MAP θ∗ C = 2.59 > 1 14.65 14.65 C = 0.91 < 1 15.03 14.65 C = 0.65 < 1 14.35 14.65 C = 345.22 > 1 14.56 14.56 C = 0.91 < 1 14.58 14.56 C = 0.65 < 1 14.24 14.56
Table 4.2: Symbol error rate (in%) for MAP decoding and instantaneous mapping θ∗ for symmetric binary Markov sources with p00 = 0.6 (symmetric Markov source). The channel model is the NBNDC-QB, with M = 1, Cor = 0, 0.9, and q = 1, 2, 3. The values C are calculated from (4.20).
CHAPTER 4. SQ-MAP OVER THE NBNDC-QB 77
0.7
p00
0.9
0
Cor
3
2
1
3
2
1
q
15 MAP θ∗ C = 23.60 > 1 0.76 0.76 C = 0.57 < 1 0.64 0.76 C = 0.33 < 1 0.62 0.76 C = 2393.07 > 1 0.70 0.70 C = 0.57 < 1 0.62 0.70 C = 0.33 < 1 0.55 0.70
10 MAP θ∗ C = 7.71 > 1 2.30 2.30 C = 0.52 < 1 1.91 2.30 C = 0.33 < 1 1.90 2.30 C = 804.41 > 1 2.21 2.21 C = 0.52 < 1 1.87 2.21 C = 0.33 < 1 1.84 2.21
SNR 5 MAP θ∗ C = 2.68 > 1 6.43 6.43 C = 0.52 < 1 5.55 6.43 C = 0.30 < 1 5.37 6.43 C = 301.89 > 1 6.12 6.12 C = 0.52 < 1 5.61 6.12 C = 0.30 < 1 5.30 6.12 2 MAP θ∗ C = 1.51 > 1 10.85 10.85 C = 0.42 < 1 9.50 10.85 C = 0.28 < 1 9.27 10.85 C = 185.81 > 1 10.69 10.69 C = 0.42 < 1 9.86 10.69 C = 0.28 < 1 9.31 10.69
0 MAP θ∗ C = 1.07 > 1 14.65 14.65 C = 0.38 < 1 12.99 14.65 C = 0.27 < 1 12.79 14.65 C = 142.67 > 1 14.56 14.56 C = 0.38 < 1 13.47 14.56 C = 0.27 < 1 13.13 14.56
Table 4.3: Symbol error rate (in%) for MAP decoding and instantaneous mapping θ∗ for symmetric binary Markov sources with p00 = 0.7 (symmetric Markov source). The channel model is the NBNDC-QB, with M = 1, Cor = 0, 0.9, and q = 1, 2, 3. The values C are calculated from (4.20).
CHAPTER 4. SQ-MAP OVER THE NBNDC-QB 78
0.9
p00
0.9
0
Cor
3
2
1
3
2
1
q
15 MAP θ∗ C = 1.59 > 1 0.76 0.76 C = 0.04 < 1 0.27 0.76 C = 0.02 < 1 0.22 0.76 C = 160.80 > 1 0.70 0.70 C = 0.04 < 1 0.29 0.70 C = 0.02 < 1 0.23 0.70
10 MAP θ∗ C = 0.52 < 1 1.74 2.30 C = 0.03 < 1 0.89 2.30 C = 0.02 < 1 0.69 2.30 C = 54.07 > 1 2.21 2.21 C = 0.03 < 1 0.96 2.21 C = 0.02 < 1 0.76 2.21
SNR 5 MAP θ∗ C = 0.18 < 1 3.65 6.43 C = 0.04 < 1 2.66 6.43 C = 0.02 < 1 2.16 6.43 C = 20.29 > 1 6.12 6.12 C = 0.04 < 1 3.48 6.12 C = 0.02 < 1 2.64 6.12 2 MAP θ∗ C = 0.10 < 1 6.56 10.85 C = 0.03 < 1 4.59 10.85 C = 0.02 < 1 4.17 10.85 C = 12.49 > 1 10.69 10.69 C = 0.03 < 1 7.03 10.69 C = 0.02 < 1 5.34 10.69
0 MAP θ∗ C = 0.07 < 1 8.68 14.65 C = 0.03 < 1 6.54 14.65 C = 0.02 < 1 6.00 14.65 C = 9.59 > 1 14.56 14.56 C = 0.03 < 1 10.73 14.56 C = 0.02 < 1 8.50 14.56
Table 4.4: Symbol error rate (in%) for MAP decoding and instantaneous mapping θ∗ for symmetric binary Markov sources with p00 = 0.9 (symmetric Markov source). The channel model is the NBNDC-QB, with M = 1, Cor = 0, 0.9, and q = 1, 2, 3. The values C are calculated from (4.20).
CHAPTER 4. SQ-MAP OVER THE NBNDC-QB 79
CHAPTER 4. SQ-MAP OVER THE NBNDC-QB
4.2
80
Numerical Results
We now present numerical results for the described communication system, over both the NBNDC-QB model and the Rayleigh DFC model. Similar to Chapter 3, several source distributions are tested, including memoryless (i.i.d.) Gaussian and Laplacian sources and Gauss-Markov sources. All of the source models have zero mean and unit variance. For each simulation, the SQ training and statistics collection is done over a set of 1,000,000 source symbols. Afterwards, 100,000 source symbols are transmitted for simulation and the SDR with the mean square error distortion is measured. We ran each simulation 10 times and took average for more consistent results.
4.2.1
Exploiting memory and soft-decision quantization
Tables 4.5-4.11 depict simulation results (in dB) for different sources over the NBNDCQB model with several parameters of SNR, SQ codeword length n, noise correlation Cor, channel memory order M , and soft-decision resolution q.
Memoryless sources As can be seen from the tables, the performance of a system with high noise correlation (or even moderate correlation as in Table 4.6,) can be significantly better than a system working over a fully-interleaved (Cor = 0) channel. For example, more than 2.5 dB of SDR gain is obtained for memoryless Gaussian sources at q = 3, n = 3, SNR = 2 (see Table 4.5). Furthermore, for n = 1 since the quantized codewords form a symmetric i.i.d. source, the results illustrate Theorem 1 of [3] and Theorem
CHAPTER 4. SQ-MAP OVER THE NBNDC-QB
81
4.1 (compare the results of Tables 4.5 and 4.12 for n = 1). Considerable gains (up to 2.25 dB) are also obtained by increasing the quantizer resolution to q = 2 (at n = 3, SNR = 5, Cor = 0.9 for Laplacian sources). More gain is obtained for a 3-bit quantizer.
Gauss-Markov sources For Gauss-Markov sources, we have up to 3.8 dB SDR gain (at q = 3, n = 3, SNR = 0), by exploiting the noise correlation instead of interleaving the channel. As can be seen, in general better performance is observed when channel is highly correlated. At low rates, especially at n = 1, the SDR performance for the correlated channel is worse than that for the uncorrelated channel. This behavior was expected for n = 1 and q = 1 using Corollary 3 of [3]. According to this corollary and the numerical results, for the correlated channel, the source memory has a mismatch with the channel memory. As a result, increasing the channel noise correlation will also increase the mismatch between the source and channel memory information. This makes the SQ-MAP perform worse on correlated channels than over uncorrelated channels. However, this mismatch does not occur for higher rates (n > 2) and the SDR performance of the system significantly improves with increasing channel noise correlation. The mismatch between the source and channel memory is investigated for the binary Markov channel in [3], in which to handle this mismatch a convolutional coder is proposed in order to convert the source memory redundancy ρM to redundancy ρD due to non-uniformity.
CHAPTER 4. SQ-MAP OVER THE NBNDC-QB
82
It is also observed that system gains up to 2.8 dB (at n = 3, SNR = 2, Cor = 0.9 for Gauss-Markov sources) using only a 2-bit soft-decision quantizer in the receiver over a hard-decision quantizer (q = 1). More gain is obtained by further increasing of q.
4.2.2
Validating the NBNDC-QB model
We next assess how well the NBNDC-QB model can approximate the correlated Rayleigh DFC in terms of SDR performance of the SQ-MAP system. To validate the NBNDC-QB model as a good representation of the Rayleigh DFC for SQ-MAP systems, we design the MAP detector using the path metric obtained for an NBNDC-QB (with proper parameters to match a specific Rayleigh DFC) and run simulation using both the NBNDC-QB and the Rayleigh DFC to compare their performance. For a given DFC (with fixed SNR and fD T ) and a given q, we have used the same technique described in Chapter 3, to fit the NBNDC-QB to the Rayleigh DFC. The ρj values and other channel parameters used for simulation are given in Tables 3.14 and 3.10 respectively. To simulate the Rayleigh DFC, we generate the fading coefficients using the modified Clarke’s method introduced in [36]. Simulation results (over the NBNDC-QB and Rayleigh DFC channels) in terms of SDR are shown in Tables 4.14-4.16 for memoryless i.i.d. Gaussian sources, Gauss-Markov sources with correlation factor φ = 0.9, and memoryless i.i.d. Laplacian sources, respectively. The results in symbol error rate are depicted in Tables 4.17-4.19. Comparing the performance of the system for the two channels, we observe that for lower rates (codeword lengths n = 1 and 2 for the memoryless Gaussian source),
CHAPTER 4. SQ-MAP OVER THE NBNDC-QB
83
there is a good conformity between the results for the two channel models. This agreement in SDR performance can be heuristically explained by noting that for low rates (n = 1 and 2), the SQ output sent to the channel input is nearly i.i.d. uniform. But the NBNDC-QB and DFC channels were matched by minimizing the divergence rate between their noise processes. Hence, when both channels are driven by the same capacity-achieving input (which must be i.i.d. uniform as both channels are symmetric), they will then have a similar probability of error performance in addition to nearly identical capacities. The same agreement in SDR performance is also observed for memoryless Laplacian and Gauss-Markov sources for n = 1. We finally note that for n ≥ 3, some disagreement in SDR performance is observed between the two systems (in this case the SQ output is not i.i.d. uniform). The distribution P (x) of the quantized symbols is depicted in Table 4.20.
CHAPTER 4. SQ-MAP OVER THE NBNDC-QB
84
Table 4.5: SQ-MAP Training SDR results (in dB) for the memoryless NBNDC-QB and the highly correlated NBNDC-QB with parameters M = 1, α = 1; memoryless Gaussian source. q
1
2
3
n 1 2 3 1 2 3 1 2 3
Memoryless (Cor=0) SNR (dB) 15 10 5 2 4.17 3.75 2.78 1.94 8.15 6.49 3.85 2.14 11.05 7.80 4.02 1.93 4.17 3.75 2.78 1.94 8.15 6.49 3.85 2.14 11.10 7.94 4.33 2.53 4.17 3.75 2.78 1.94 8.17 6.54 4.02 2.41 11.15 7.98 4.38 2.57
0 1.33 1.10 0.70 1.33 1.10 1.45 1.33 1.44 1.51
15 4.19 8.37 11.58 4.19 8.69 12.61 4.19 8.76 12.86
Cor=0.9 SNR (dB) 10 5 2 3.77 2.85 1.97 6.89 4.47 2.84 8.43 4.76 2.76 3.77 2.85 1.97 7.68 5.61 4.03 10.15 6.64 4.51 3.77 2.85 1.97 7.77 5.91 4.48 10.52 7.16 5.12
0 1.35 1.82 1.62 1.35 3.05 3.30 1.35 3.56 4.00
Table 4.6: SQ-MAP Training SDR results (in dB) for the NBNDC-QB with parameters M = 1, α = 1, and correlations 0.5, 0.7; memoryless Gaussian source. q
1
2
3
n 1 2 3 1 2 3 1 2 3
15 4.17 8.26 11.18 4.17 8.31 11.40 4.17 8.33 11.49
Cor=0.5 SNR (dB) 10 5 2 3.74 2.78 1.95 6.67 4.13 2.44 7.90 4.16 2.06 3.74 2.78 1.95 6.77 4.27 2.64 8.31 4.61 2.66 3.74 2.80 1.95 6.85 4.44 2.83 8.43 4.82 2.87
0 1.32 1.38 0.84 1.32 1.61 1.51 1.33 1.86 1.76
15 4.18 8.28 11.30 4.18 8.43 11.76 4.17 8.43 11.87
Cor=0.7 SNR (dB) 10 5 2 3.75 2.79 1.94 6.75 4.23 2.57 8.06 4.30 2.22 3.75 2.79 1.94 7.01 4.59 3.01 8.76 5.08 3.08 3.73 2.79 1.95 7.06 4.78 3.21 8.92 5.36 3.38
0 1.34 1.52 1.00 1.34 2.00 1.92 1.35 2.25 2.22
CHAPTER 4. SQ-MAP OVER THE NBNDC-QB
85
Table 4.7: SQ-MAP Training SDR results (in dB) for the memoryless NBNDC-QB and the highly correlated NBNDC-QB with parameters M = 1, α = 1; Gauss-Markov source with correlation factor φ = 0.9. q
1
2
3
n 1 2 3 1 2 3 1 2 3
15 4.21 8.95 13.38 4.38 9.16 13.98 4.39 9.18 14.07
Memoryless (Cor=0) SNR (dB) 10 5 2 3.78 3.74 3.22 8.29 6.97 6.34 11.84 9.46 7.52 4.23 3.89 3.61 8.81 8.00 6.98 12.87 10.72 8.91 4.30 4.01 3.65 8.87 8.09 7.24 13.06 10.96 9.16
0 3.09 5.41 6.18 3.22 6.08 7.56 3.39 6.43 7.81
15 4.23 8.94 13.89 4.35 9.24 14.47 4.37 9.29 14.57
Cor=0.9 SNR (dB) 10 5 2 3.81 2.89 2.01 8.24 6.88 5.71 12.69 10.43 8.69 4.14 3.44 2.65 8.97 8.26 7.36 14.02 12.88 11.51 4.20 3.62 2.97 9.18 8.64 8.00 14.34 13.47 12.58
0 1.39 4.90 7.51 2.02 6.59 10.34 2.39 7.38 11.58
Table 4.8: SQ-MAP Training SDR results (in dB) for the memoryless NBNDC-QB and the highly correlated NBNDC-QB with parameters M = 1, α = 1; memoryless Laplacian source. q
1
2
3
n 1 2 3 1 2 3 1 2 3
Memoryless (Cor=0) SNR (dB) 15 10 5 2 0 2.87 2.62 2.00 1.44 1.00 6.65 5.27 2.91 1.30 0.27 9.59 6.49 2.72 0.58 0.82 2.87 2.62 2.00 1.44 1.00 6.69 5.42 3.32 2.01 1.18 9.90 7.09 3.81 2.06 1.06 2.87 2.62 2.00 1.44 1.00 6.72 5.45 3.27 2.01 1.20 9.96 7.12 3.75 1.99 1.27
15 2.88 6.89 10.14 2.88 7.26 11.59 2.88 7.32 11.85
Cor=0.9 SNR (dB) 10 5 2 2.63 2.05 1.45 5.88 4.28 3.21 7.64 4.88 3.34 2.63 2.05 1.45 6.72 5.53 4.47 9.86 7.14 5.35 2.63 2.05 1.45 6.91 5.88 4.97 10.47 7.94 6.23
0 1.01 2.56 2.51 1.01 3.79 4.30 1.01 4.36 5.27
CHAPTER 4. SQ-MAP OVER THE NBNDC-QB
86
Table 4.9: SQ-MAP Training SDR results (in dB) for the memoryless NBNDC-QB and the highly correlated NBNDC-QB with parameters M = 5, α = 0.5; memoryless Gaussian source. q
1
2
3
n 1 2 3 1 2 3 1 2 3
Memoryless (Cor=0) SNR (dB) 15 10 5 2 4.17 3.75 2.78 1.94 8.15 6.49 3.85 2.14 11.05 7.80 4.02 1.93 4.17 3.75 2.78 1.94 8.15 6.49 3.85 2.14 11.10 7.94 4.33 2.53 4.17 3.75 2.78 1.94 8.17 6.54 4.02 2.41 11.15 7.98 4.38 2.57
0 1.33 1.10 0.70 1.33 1.10 1.45 1.33 1.44 1.51
15 4.22 8.37 13.11 4.22 9.03 14.09 4.22 9.14 14.29
Cor=0.9 SNR (dB) 10 5 2 3.86 2.89 2.03 7.06 4.61 2.91 11.11 8.24 6.69 3.86 2.89 2.03 8.32 6.77 5.34 13.03 10.87 9.21 3.86 2.89 2.03 8.75 7.42 6.39 13.65 11.74 10.34
0 1.45 1.80 5.81 1.45 4.35 8.09 1.45 5.69 9.38
Table 4.10: SQ-MAP Training SDR results (in dB) for the memoryless NBNDC-QB and the highly correlated NBNDC-QB with parameters M = 5, α = 1; memoryless Gaussian source. q
1
2
3
n 1 2 3 1 2 3 1 2 3
Memoryless (Cor=0) SNR (dB) 15 10 5 2 4.17 3.75 2.78 1.94 8.15 6.49 3.85 2.14 11.05 7.80 4.02 1.93 4.17 3.75 2.78 1.94 8.15 6.49 3.85 2.14 11.10 7.94 4.33 2.53 4.17 3.75 2.78 1.94 8.17 6.54 4.02 2.41 11.15 7.98 4.38 2.57
0 1.33 1.10 0.70 1.33 1.10 1.45 1.33 1.44 1.51
15 4.26 8.40 13.18 4.26 9.09 14.33 4.26 9.12 14.29
Cor=0.9 SNR (dB) 10 5 2 3.91 2.90 2.09 7.07 4.61 2.95 11.27 8.50 6.90 3.91 2.90 2.09 8.35 6.57 5.25 13.02 11.03 9.32 3.91 2.90 2.09 8.72 7.46 6.38 13.75 11.87 10.46
0 1.44 1.85 6.07 1.44 4.20 8.36 1.44 5.46 9.59
CHAPTER 4. SQ-MAP OVER THE NBNDC-QB
87
Table 4.11: SQ-MAP Training SDR results (in dB) for the memoryless NBNDC-QB and the highly correlated NBNDC-QB with parameters M = 5, α = 2; memoryless Gaussian source. q
Memoryless (Cor=0) SNR (dB) 15 10 5 2 4.17 3.75 2.78 1.94 8.15 6.49 3.85 2.14 11.05 7.80 4.02 1.93 4.17 3.75 2.78 1.94 8.15 6.49 3.85 2.14 11.10 7.94 4.33 2.53 4.17 3.75 2.78 1.94 8.17 6.54 4.02 2.41 11.15 7.98 4.38 2.57
n 1 2 3 1 2 3 1 2 3
1
2
3
0 1.33 1.10 0.70 1.33 1.10 1.45 1.33 1.44 1.51
15 4.19 8.41 13.25 4.19 9.03 14.33 4.19 9.07 14.31
Cor=0.9 SNR (dB) 10 5 2 3.85 2.93 2.23 7.09 4.52 2.86 11.42 8.84 7.26 3.85 2.93 2.23 8.00 6.12 4.56 13.28 11.11 9.63 3.85 2.93 2.23 8.54 7.06 5.74 13.76 11.89 10.79
0 1.43 1.68 6.33 1.43 3.57 8.66 1.43 4.84 9.80
Table 4.12: SQ with instantaneous mapping- Training SDR results (in dB) for the memoryless NBNDC-QB and the highly correlated NBNDC-QB with parameters M = 1, α = 1; memoryless Gaussian source. q
1
2
3
n 1 2 3 1 2 3 1 2 3
Memoryless (Cor=0) SNR (dB) 15 10 5 2 4.17 3.75 2.78 1.94 8.15 6.49 3.85 2.14 11.05 7.80 4.02 1.93 4.17 3.75 2.78 1.94 8.15 6.49 3.85 2.14 11.05 7.80 4.02 1.93 4.17 3.75 2.78 1.94 8.15 6.49 3.85 2.14 11.05 7.80 4.02 1.93
0 1.33 1.10 0.70 1.33 1.10 0.70 1.33 1.10 0.70
15 4.19 8.37 11.58 4.19 8.37 11.58 4.19 8.37 11.58
Cor=0.9 SNR (dB) 10 5 2 3.77 2.85 1.97 6.89 4.42 2.74 8.38 4.61 2.47 3.77 2.85 1.97 6.89 4.42 2.74 8.38 4.61 2.47 3.77 2.85 1.97 6.89 4.42 2.74 8.38 4.61 2.47
0 1.35 1.66 1.21 1.35 1.66 1.21 1.35 1.66 1.21
CHAPTER 4. SQ-MAP OVER THE NBNDC-QB
88
Table 4.13: SQ with instantaneous mapping- Training SDR results (in dB) for the memoryless NBNDC-QB and the highly correlated NBNDC-QB with parameters M = 1, α = 1; Gauss-Markov source with correlation factor φ = 0.9. q
1
2
3
n 1 2 3 1 2 3 1 2 3
Memoryless (Cor=0) SNR (dB) 15 10 5 2 4.21 3.78 2.82 1.97 8.19 6.52 3.87 2.16 11.13 7.81 4.03 1.93 4.21 3.78 2.82 1.97 8.19 6.52 3.87 2.16 11.13 7.81 4.03 1.93 4.21 3.78 2.82 1.97 8.19 6.52 3.87 2.16 11.13 7.81 4.03 1.93
0 1.36 1.11 0.71 1.36 1.11 0.71 1.36 1.11 0.71
15 4.23 8.40 11.59 4.23 8.40 11.59 4.23 8.40 11.59
Cor=0.9 SNR (dB) 10 5 2 3.81 2.89 2.01 6.91 4.44 2.74 8.38 4.64 2.51 3.81 2.89 2.01 6.91 4.44 2.74 8.38 4.64 2.51 3.81 2.89 2.01 6.91 4.44 2.74 8.38 4.64 2.51
0 1.39 1.66 1.24 1.39 1.66 1.24 1.39 1.66 1.24
Table 4.14: SQ-MAP simulation SDR results (in dB) for the DFC-fitted NBNDC-QB and the DFC; memoryless Gaussian source, q = 2. Channel model
fD T
0.005 NBNDCQB 0.01
0.005 Rayleigh DFC 0.01
n 1 2 3 1 2 3 1 2 3 1 2 3
15 Cor=0.35 4.18 8.34 11.75 4.17 8.34 11.60 4.17 8.15 11.05 4.18 8.17 11.13
SNR (dB) 10 5 Cor=0.32 Cor=0.29 3.76 2.77 6.73 4.01 8.62 4.48 3.75 2.80 6.75 4.07 8.59 4.67 3.75 2.78 6.52 3.91 7.77 3.97 3.75 2.79 6.51 3.88 7.77 3.91
2 Cor=0.22 1.94 2.29 2.28 1.94 2.28 2.35 1.94 2.18 1.89 1.95 2.18 1.90
CHAPTER 4. SQ-MAP OVER THE NBNDC-QB
89
Table 4.15: SQ-MAP simulation SDR results (in dB) for the DFC-fitted NBNDC-QB and the DFC; Gauss-Markov source with correlation factor φ = 0.9, q = 2. Channel model
fD T
0.005 NBNDCQB 0.01
0.005 Rayleigh DFC 0.01
n 1 2 3 1 2 3 1 2 3 1 2 3
15 Cor=0.35 4.35 9.19 14.25 4.35 9.20 14.19 4.22 8.82 13.28 4.24 8.90 13.35
SNR (dB) 10 5 Cor=0.32 Cor=0.29 4.15 3.73 8.76 7.66 13.07 10.48 4.16 3.74 8.80 7.71 13.22 10.72 3.88 3.28 7.99 6.39 11.38 8.38 3.93 3.39 8.15 6.59 11.52 8.60
2 Cor=0.22 3.19 6.33 8.02 3.21 6.41 8.26 2.82 5.05 6.41 2.85 5.33 6.66
Table 4.16: SQ-MAP simulation SDR results (in dB) for the DFC-fitted NBNDC-QB and the DFC; memoryless Laplacian source, q = 2. Channel model
fD T
0.005 NBNDCQB 0.01
0.005 Rayleigh DFC 0.01
n 1 2 3 1 2 3 1 2 3 1 2 3
15 Cor=0.35 2.87 6.92 10.73 2.87 6.91 10.62 2.87 6.50 9.50 2.87 6.57 9.64
SNR (dB) 10 5 Cor=0.32 Cor=0.29 2.62 2.00 5.77 3.26 8.09 4.06 2.62 2.02 5.82 3.51 8.03 4.21 2.61 2.01 4.99 2.68 6.42 2.64 2.61 2.00 5.09 2.67 6.42 2.64
2 Cor=0.22 1.44 1.66 1.69 1.44 1.76 1.80 1.43 1.16 0.63 1.43 1.20 0.71
CHAPTER 4. SQ-MAP OVER THE NBNDC-QB
90
Table 4.17: SQ-MAP simulation results in symbol error rate(%), for the DFC-fitted NBNDC-QB and the DFC; memoryless Gaussian source, q = 2. Channel model
NBNDCQB
Rayleigh DFC
fD T 1 2 3 1 2 3 1 2 3 1 2 3
n
0.005
0.01
0.005
0.01
15 Cor=0.35 0.73 1.12 1.33 0.74 1.13 1.42 0.75 1.46 2.03 0.73 1.42 2.05
SNR (dB) 10 5 Cor=0.32 Cor=0.29 2.27 6.45 3.65 10.73 4.31 13.10 2.31 6.36 3.61 10.55 4.35 12.75 2.31 6.41 4.29 11.61 6.06 16.32 2.30 6.39 4.34 11.78 6.24 16.61
2 Cor=0.22 10.86 18.21 22.77 10.87 18.36 22.94 10.85 19.42 26.70 10.76 19.53 26.92
Table 4.18: SQ-MAP simulation results in symbol error rate(%), for the DFC-fitted NBNDC-QB and the DFC; Gauss-Markov source with correlation factor φ = 0.9, q = 2. Channel model
NBNDCQB
Rayleigh DFC
fD T 1 2 3 1 2 3 1 2 3 1 2 3
n
0.005
0.01
0.005
0.01
15 Cor=0.35 0.36 0.36 0.43 0.37 0.38 0.50 0.77 1.21 1.57 0.72 1.15 1.59
SNR (dB) 10 5 Cor=0.32 Cor=0.29 1.20 3.30 1.36 4.55 1.69 5.95 1.21 3.44 1.39 4.67 1.71 6.07 2.14 5.27 3.43 8.97 4.61 12.39 2.02 5.02 3.37 8.96 4.72 12.66
2 Cor=0.22 6.27 9.36 12.40 6.31 9.65 12.82 8.14 14.87 20.32 8.05 14.57 20.46
CHAPTER 4. SQ-MAP OVER THE NBNDC-QB
91
Table 4.19: SQ-MAP simulation results in symbol error rate(%), for the DFC-fitted NBNDC-QB and the DFC; memoryless Laplacian source, q = 2. Channel model
NBNDCQB
Rayleigh DFC
fD T 1 2 3 1 2 3 1 2 3 1 2 3
n
0.005
0.01
0.005
0.01
15 Cor=0.35 0.73 0.89 0.99 0.74 0.91 1.08 0.77 1.66 2.06 0.74 1.59 2.07
SNR (dB) 10 5 Cor=0.32 Cor=0.29 2.27 6.45 2.95 9.76 3.33 10.91 2.31 6.36 2.87 9.01 3.43 10.71 2.34 6.44 4.89 12.48 6.14 16.42 2.33 6.43 4.78 12.59 6.34 16.89
2 Cor=0.22 10.86 16.75 19.95 10.87 16.52 20.29 10.88 20.09 26.85 10.83 20.09 27.10
Table 4.20: P (x) for different source distributions and SQ coding rates. Distribution Gaussian
Laplace
Gauss− M arkov
R 1 2 3 1 2 3 1 2 3
P (x) 0.499 0.335 0.186 0.500 0.397 0.258 0.497 0.334 0.185
0.501 0.165 0.111 0.500 0.104 0.072 0.503 0.163 0.110
0.335 0.160 0.396 0.152 0.336 0.160
0.165 0.043 0.103 0.019 0.167 0.043
0.186 0.257 0.185
0.111 0.072 0.111
0.160 0.151 0.161
0.043 0.019 0.045
Chapter 5 Conclusions and Future Work We designed two joint source-channel coding schemes for the NBNDC-QB channel in order to take advantage of channel memory and soft-decision information. The COVQ performance results show that the COVQ system, as a joint sourcechannel coding technique, can successfully exploit the channel’s memory and softdecision information to combat channel errors while having the advantage of low encoding/decoding delay in comparison with tandem coding systems. Furthermore, the NBNDC-QB model, which (unlike the Rayleigh DFC) is mathematically tractable by virtue of having closed-from expressions for its statistics, was experimentally shown to be a practical model for the Rayleigh DFC in terms of COVQ performance. A scalar quantizer based MAP decoding system (SQ-MAP) was also designed over the recently introduced channel model NBNDC-QB, which consists of a scalar quantizer, a proper index assignment and a sequence maximum a posteriori (MAP) decoder designed to harness the redundancy left in the quantizers indices, the channels soft-decision output, and noise time correlation. The system was tested for both correlated and uncorrelated source distributions and numerical results show that the 92
CHAPTER 5. CONCLUSIONS AND FUTURE WORK
93
proposed system can successfully utilize memory and soft-decision information over the NBNDC-QB channel model. It was also observed that for correlated sources, in some cases the system with interleaved channel (system with no noise correlation) performs better than the system with highly correlated channel. This observation was investigated and necessary and sufficient condition for this phenomenon to occur was obtained at rate R = 1. Finally, the channel model was compared to the Rayleigh DFC, in terms of SDR, and it was shown numerically that the NBNDC-QB model can effectively approximate the Rayleigh discrete fading channels for low coding rates, while providing closed form expression for transition distribution. However, some degradation was observed for approximating the Rayleigh DFC for high rates. This work can be extended in some directions. The COVQ system we presented here does not use the optimal quantizer step size δ for soft-decision decoding. Note that since our training algorithm uses the resulting codebook of each COVQ with a specific SNR and an initial codebook of an other COVQ with lower SNR, each δ value affects the whole collection of COVQ systems (for different SNRs). Consequently, the choice of proper δ value for a COVQ with specific SNR is rather complicated since each candidate δ value improves the performance for some cases and deteriorates it for some others. Defining a proper qualifying factor and further optimization of the systems performance by finding the optimal set of δ values could a subject of interest for future work. For the SQ-MAP system, further investigations can be made in order to find the cases were the MAP-decoder is useless for higher rates or channel noise memory orders. Furthermore, the optimal index assignment is still an open problem, and we
CHAPTER 5. CONCLUSIONS AND FUTURE WORK
94
observed that proper choice of index assignment can critically improve the performance of the SQ-MAP system.
Bibliography [1] F. Alajaji and T. Fuja. A communication channel modeled on contagion. IEEE Trans. Inform. Theory, 40:2035 –2041, Nov. 1994. [2] F. Alajaji, N. Phamdo, N. Farvardin, and T. E. Fuja. Detection of binary sources over discrete channels with additive Markov noise. Institute for Systems Research Tech. Rep. TR 94-31, University of Maryland, College Park, MD 20742, 1994. [3] F. Alajaji, N. Phamdo, N. Farvardin, and T. E. Fuja. Detection of binary Markov sources over channels with additive Markov noise. IEEE Trans. Inform. Theory, 42(1):230 –239, Jan. 1996. [4] F. Alajaji and N. C. Phamdo. Soft-decision covq for Rayleigh-fading channels. IEEE Communications Letters, 2(6):162 –164, Jun. 1998. [5] E. Ayanoglu and R. Gray. The design of joint source and channel trellis waveform coders. IEEE Trans. Inform. Theory, 33(6):855 – 865, Nov. 1987. [6] F. Behnamfar, F. Alajaji, and T. Linder.
Channel-optimized quantization
with soft-decision demodulation for space-time orthogonal block-coded channels. IEEE Trans. Signal Proc., 54(10):3935 –3946, Oct. 2006.
95
BIBLIOGRAPHY
96
ˇ y. Thermodynamical approach to the traveling salesman problem: An [7] V. Cern` efficient simulation algorithm. Journal of Optimization Theory and Applications, 45(1):41–51, 1985. [8] R. H. Clarke. A statistical theory of mobile-radio reception. Bell Syst. Tech. J, 47(6):957–1000, 1968. [9] T.M. Cover and J.A. Thomas.
Elements of Information Theory.
Wiley-
Interscience, 2006. [10] R. L. Dobrushin and M. S. Pinsker. Memory increases transmission capacity. Problemy Peredachi Informatsii, 5(1):94–95, 1969. [11] E.B. Dynkin. Markov Processes. Vol. 1. Springer-Verlag Berlin, 1965. [12] N. Farvardin. A study of vector quantization for noisy channels. IEEE Trans. Inform. Theory, 36(4):799 –809, Jul. 1990. [13] N. Farvardin and V. Vaishampayan. Optimal quantizer design for noisy channels: An approach to combined source - channel coding. IEEE Trans. Inform. Theory, 33(6):827 – 838, Nov. 1987. [14] N. Farvardin and V. Vaishampayan. On the performance and complexity of channel-optimized vector quantizers. IEEE Trans. Inform. Theory, 37(1):155 –160, Jan. 1991. [15] G. D. Forney Jr. The Viterbi algorithm. Proceedings of the IEEE, 61(3):268–278, 1973. [16] R. G. Gallager. Information Theory and Reliable Communication. Wiley, 1968.
BIBLIOGRAPHY
97
[17] A. Gersho and R.M. Gray. Vector quantization and signal compression. Springer Netherlands, 1992. [18] F.P. Kelly. Markovian functions of a Markov chain. Sankhy¯a: The Indian Journal of Statistics, Series A, pages 372–379, 1982. [19] S. Kirkpatrick, C. D. Gelatt, and M.P. Vecchi. Optimization by simulated annealing. Science, 220(4598):671, 1983. [20] H. Kumazawa, M. Kasahara, and T. Namekawa. A construction of vector quantizers for noisy channels. Electronics and Communications in Japan (Part I: Communications), 67(4):39–47, 1984. [21] Y. Linde, A. Buzo, and R. Gray. An algorithm for vector quantizer design. IEEE Trans. Commun., 28(1):84 – 95, Jan. 1980. [22] S. Lloyd. Least squares quantization in pcm. IEEE Trans. Inform. Theory, 28(2):129 – 137, Mar. 1982. [23] D. J. Miller and M. Park. A sequence-based approximate mmse decoder for source coding over noisy channels using discrete hidden Markov models. IEEE Trans. Commun., 46(2):222 –231, Feb. 1998. [24] M. Mushkin and I. Bar-David. Capacity and coding for the gilbert-elliott channels. IEEE Trans. Inform. Theory, 35(6):1277 –1290, Nov. 1989. [25] N. Phamdo and F. Alajaji. Soft-decision demodulation design for COVQ over white, colored, and ISI Gaussian channels. IEEE Trans. Commun., 48(9):1499 –1506, Sep. 2000.
BIBLIOGRAPHY
98
[26] N. Phamdo, F. Alajaji, and N. Farvardin. Quantization of memoryless and Gauss-Markov sources over binary Markov channels. IEEE Trans. Commun., 45(6):668 –675, Jun. 1997. [27] N. Phamdo and N. Farvardin. Optimal detection of discrete Markov sources over discrete memoryless channels-applications to combined source-channel coding. IEEE Trans. Inform. Theory, 40(1):186 –193, Jan. 1994. [28] C. Pimentel and F. Alajaji. A discrete channel model for capturing memory and soft-decision information: A capacity study. In Proc. ICC ’09,, pages 1 –6, Jun. 2009. [29] C. Pimentel, F. Alajaji, and P. Melo. A discrete queue-based model for softdecision demodulated correlated fading channels. in Proc. VTC’11., May 2011. [30] C. E. Shannon. A mathematical theory of communication. Bell Syst. Tech. J., 27:379–423, 623–656, 1948. [31] C. E. Shannon. Coding theorems for a discrete source with a fidelity criterion. IRE Nat. Conv. Rec, 4(142-163), 1959. [32] C. E. Shannon. A mathematical theory of communication. ACM SIGMOBILE Mobile Computing and Communications Review, 5(1):3–55, 2001. [33] J. Singh, O. Dabeer, and U. Madhow. On the limits of communication with lowprecision analog-to-digital conversion at the receiver. IEEE Trans. Commun., 57(12):3629 –3639, Dec. 2009. [34] M. Skoglund. Soft decoding for vector quantization over noisy channels with memory. IEEE Trans. Inform. Theory, 45(4):1293 –1307, May 1999.
BIBLIOGRAPHY
99
[35] N. Wernersson and M. Skoglund. On source decoding based on finite-bandwidth soft information. In Information Theory, 2005. Proceedings. International Symposium on, pages 87 –91, Sep. 2005. [36] Y.R. Zheng and C. Xiao. Improved models for the generation of multiple uncorrelated Rayleigh fading waveforms. IEEE Communications Letters, 6(6):256 –258, Jun. 2002. [37] Libo Zhong, F. Alajaji, and G. Takahara. A binary communication channel with memory based on a finite queue. IEEE Trans. Inform. Theory, 53(8):2815 –2840, Aug. 2007.