1
Robust Orientation Field Estimation and Extrapolation Using Semilocal Line Sensors Carsten Gottschlich*, Preda Mih˘ailescu and Axel Munk
A BSTRACT Orientation field (OF) estimation is a crucial preprocessing step in fingerprint image processing. In this paper, we present a novel method for OF estimation that uses traced ridge and valley lines. This approach provides robustness against disturbances caused, e.g. by scars, contamination, moisture or dryness of the finger. It considers pieces of flow information from a larger region and makes good use of fingerprint inherent properties like continuity of ridge flow perpendicular to the flow. The performance of the line-sensor method is compared with the gradients based method and a multiscale directional operator. Its robustness is tested in experiments with simulated scar noise which is drawn on top of good quality fingerprint images from the FVC2000 and FVC2002 databases. Finally, the effectiveness of the line-sensor based approach is demonstrated on 60 naturally poor quality fingerprint images from the FVC2004 database. All orientations marked by a human expert are made available at the journal’s and the authors’ website for comparative tests. EDICS: BIO-FING I NDEX T ERMS Fingerprint recognition, image processing, orientation field estimation, ridge tracing I. I NTRODUCTION A. Motivation In fingerprint image processing, a good and reliable orientation field (OF) estimation is a crucial preprocessing step, because many subsequently applied methods for image enhancement, binarization and feature extraction require information about the local ridge orientation, and computing singular points (SPs) using the Poincaré index [4] is based on the orientation field. For example, if an image enhancement step using Gabor filters is incorporated into the automated fingerprint processing, this can improve the verification performance as shown in [16]. The Gabor filter is a local operator that takes the gray values of the image within a certain neighborhood, the c 2009 IEEE. Personal use of this material is permitted. Copyright ⃝ However, permission to use this material for any other purposes must be obtained from the IEEE by sending a request to
[email protected] Carsten Gottschlich and Axel Munk are with the Institute for Mathematical Stochastics, University of Goettingen, Goldschmidtstr. 7, 37077 Goettingen, Germany. Phone: +49-(0)551-39172100. Fax: +49-(0)551-3913505. Emails: {gottschlich,munk}@math.uni-goettingen.de Preda Mih˘ailescu is with the Mathematical Institute, University of Goettingen, Bunsenstr. 3-5, 37073 Goettingen, Germany. Phone: +49-(0)551-397756. Fax: +49-(0)551-392985. Email:
[email protected]
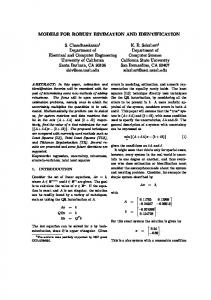
Fig. 1. Image 1_10 from FVC2006 DB3 [6]: A 16 × 16 pixels detail (right) from the original image (left) in which the block is marked as a white square.
local orientation and the local ridge frequency as input (as well as two additional tuning parameters: σx and σy , the standard deviations of the Gaussian envelope. [31]). Applied with an accurate estimation of the local orientation and ridge frequency, the Gabor filter has the potential to significantly improve the image quality. On the other hand, if inaccuracies and mistakes occur during the OF estimation that can not be dealt with by techniques like low-pass filtering, incorrect local ridge orientations are subsequently passed to the Gabor filter. This will lead to artifacts (see e.g. [38]) in the enhanced image, especially to the creation of spurious bifurcations, and eventually decrease the matching results. For these and further reasons, the quality of the OF estimation can have a big influence on the overall performance. B. Related Work 1) Gradients: Currently, the most popular method for OF estimation is based on gradients and was introduced by Kass and Witkin in 1987 [24]. Its advantages are that it can be computed very fast, it performs well for many images, and unlike other methods previously used, the accuracy of the calculated orientation is not limited by a fixed number of possible orientations [4]. Nevertheless, the gradients based method is susceptible to interference by scars, dirt, moisture or dryness of the finger, and other sources of noise which can lead to interrupted, thick or grainy ridge structures in the acquired image. The problem is inherent to the fact that gradients are extracted from the image using very small masks (of 3 × 3 up to 5 × 5 pixels). The results are then averaged over larger windows in order to increase the consistency of the results. Figure 1 (b) displays a 16 × 16 pixels detail from a fingerprint image that is disturbed by scar noise. In
2
the depicted window, the orientation seemingly goes from the left top to the right center, but this detail belongs to an area disturbed by scars. For a human expert it is quite obvious, taking the surroundings of this window into account, that the true ridge flow roughly goes from top to bottom. The method based on averaging squared gradients fails to estimate the true ridge flow, because the information is not contained in this small window. Possible improvements rest upon neighboring windows that may catch a better orientation estimation, and on a subsequent smoothing step like low-pass filtering. A gradients based approach which combines Gaussian smoothed OFs at different scales was proposed by [5]. 2) Normal vectors: An idea similar to the approach based on averaging squared gradients was presented by Donahue and Rokhlin [8]. They regarded a grayscale image as a surface over the xy-plane, calculated for each 2 × 2 pixels neighborhood the normal vectors and computed the orientation by a least squares minimization over the surface normals in an averaging window. 3) Micropatterns: Kawagoe and Tojo suggested a block wise OF estimation method [25] based on 2 × 2 pixels binary micropatterns. First, a fingerprint image is binarized and divided into subregions of 16×16 pixels. Each 2×2 pixels micropattern belongs to one of four classes representing the orientations of 0 ◦ , 45 ◦ , 90 ◦ and 135 ◦ , or a neutral fifth class. For each block the occurrences of 2 × 2 pixels micropatterns are determined and compiled into a histogram of the four orientation classes from which an average block orientation is estimated. A survey of further local methods for OF estimation can be found in [31]. 4) Global: On the other side of the scale, global models strive to describe the whole orientation field by a number of parameters. Sherlock and Monroe [37] introduced a zero-pole global model using rational complex functions. An improvement by using a piecewise linear orientation function was proposed in [39]. The zero-pole model [37] has been extended by Zhou and Gu [42] who suggested to approximate the rational function by a set of polynomials, and to use a point-charge model in order to improve the accuracy in the proximity to singular points (see also [43], [12]). For fingerprint matching, the usage of the globally modeled OF in combination with minutiae was proposed in [13]. The application of quadratic differentials for a global OF model was introduced in [18], [17]. All aforementioned global models have the disadvantage of requiring the knowledge of the singular points. First, a coarse gradients based OF is computed from which the type and location of the SPs is estimated. Inaccuracies and mistakes in this process lead to erroneous OF estimations by the global model. In [40], a model was proposed that does not require prior knowledge of SPs. It is based on 2D Fourier expansions in the phase plane and adapts directly to the coarse gradients based OF estimation. 5) Gabor Filterbank: The ridge and furrow pattern of a fingerprint can be regarded as an oriented texture [22] and the frequency- and orientation-selective properties of a Gabor filter [20] can be capitalized in a filterbank which chooses for each location the filter with the highest energy response and
Fig. 2. Examples of three typical types of noise from FVC2004 [30]: a wet (left, image 108_8 DB1) and a dry fingerprint (center, image 1_7 DB1). The fingerprint on the right (image 10_1 DB3) is disturbed by scars.
selects the frequency and the orientation accordingly. 6) 2D Sine Waves: For the extraction of ridge patterns from palmprint images that are disturbed by many creases crossing the ridge lines, an approximation of the ridge patterns by 2dimensional sine waves was proposed in [9]. This method was refined in [21] by, amongst other things, a region growing algorithm that is similar to the one presented in Section II-B2. 7) Multiscale directional operator: A multiscale directional operator has been introduced by Oliveira and Leite [35]. It estimates the orientation of each pixel (x, y) by dividing the semicircle into D directions and calculates the standard deviation of the gray values for n test points along each direction with (x, y) as central point. From all pairs of two orthogonal directions, the pair exhibiting the highest information contrast is chosen. The information contrast is defined as the maximum of the absolute values of the differences in standard deviation between two orthogonal directions. Next, from the two directions of the chosen pair for pixel (x, y), the direction with the smaller standard deviation is determined following the idea that the standard deviation along a ridge or valley is smaller than in the perpendicular direction, and this value is stored in a new orientation image g. Finally, the orientation at pixel (x, y) is obtained by applying a smoothing window Ω centered in (x, y) to image g. The multiscale directional operator can be regarded as a generalization of [32]. 8) Line-sensor: The line-sensor based method which we present in this paper traces ridge and valley lines and builds a coherent structure of locally parallel line segments from which the OF estimation is derived. To this end, the line-sensor based approach makes good use of a property inherent in fingerprints: the continuity of ridge and valley flow perpendicular to the flow. This is a multiscale approach, since, at first, line segments are discovered locally. In a second step, neighboring parallel line segments will be merged and eventually they ’broadcast’ their orientation to a medium-scale vicinity. By this means, the orientation field is constructed. C. Sketch of the method Firstly, the grayscale image is smoothed, binarized and morphologically improved. Secondly, a rudimentary line tracing detects ridges and valleys, completely or partially. Thirdly,
3
the discovered line pieces are analyzed for parallel pieces in a neighborhood orthogonal to the line piece. Fourthly, we take the parallelism of line pieces into account and group them to parallel structures; the larger the structure, the higher the confidence in the resulting orientation estimation. All structures that cover a minimum number of pixels are merged, and all line pieces propagate their orientation orthogonally. In this way, the orientation field is estimated. Finally, missing blocks are iteratively reconstructed until the orientation field is complete. See Figure 7 for an illustration of the main steps.
Fig. 3. Original grayscale and binarized images 101_6 (left) and 101_8 from FVC2004 DB1 [30].
D. Results In order to investigate the performance of our method, in a first step we chose a sample of good quality fingerprint images from the FVC2000 [28] and FVC2002 [29] databases. The images were divided into blocks of 16 × 16 pixels. A human expert classified the blocks as foreground or background and marked the orientation of all foreground blocks. Next, artificial scars were simulated by drawing white bars on top the good quality images. We compared the OF estimations of the linesensor based method, the gradients based method [4] and the multiscale directional operator [35] to the OF marked by the human expert. As performance measure, the number of deviations > 15 ◦ between an estimated orientation and the marked ’ground truth’ orientation was used. For the gradients, averaging window sizes from 8 to 100 pixels were applied, and for the multiscale directional operator, 36 combinations of the three parameters number of directions, number of test points and smoothing window size were computed. For the original good quality images, the gradients based method and the line-sensor based method achieved the best results with 12 deviations > 15 ◦ out of 4072 foreground blocks (0.29%) and 20 deviations > 15 ◦ (0.49%), respectively. The multiscale directional operator produced 105 erroneous estimations (2.58%). With an increasing number of simulated scars, the performance of the gradient based method deteriorates proportionally to the amount of added scar noise, whereas the line-sensor based method shows greater robustness to this type of simulated noise. The number of defective estimations by the multiscale directional operator increases slowly in comparison to the gradients based method, but its performance is clearly worse than the line-sensor based method (see Figure 12). In the main part of the experimentation, 1782 orientations were manually marked in 60 poor quality images from FVC2004 [30] representing three typical types of real life noise: wet finger, dry finger and finger with scars (see Figure 2). For the convenience of the reader, all marked orientations are made available at the journal’s 1 and the authors’ website 2 for comparative tests. On these naturally poor quality images, the performance of the three methods was compared using the same measure. The line-sensor based method clearly outperformed the other two methods on these naturally poor fingerprint images. Using the number of deviations > 15 ◦ between the estimated and
the marked orientation as performance measure, the gradients based method produced 50% more defective orientation estimations than the line-sensor based method, and the multiscale directional operator produced more than three times the number of errors. On the other hand, the presented method has difficulties in the core area, where due to the ridge bending the approach based on parallel traced segments has its limitations, and the computational costs for the line-sensor based OF estimation are greater than the requirements of the gradient based method. II. ROBUST O RIENTATION F IELD E STIMATION The various steps of the algorithm described below depend on a variety of significant constants. Large variations of the values of these parameters are conceivable. We have chosen these values empirically, striving to optimize the estimation performance. A. Preprocessing
1) Binarization: Goal of the binarization is to prepare the subsequent line tracing by obtaining a binary image with a ridge and valley structure that is as distinct as possible with respect to the local noise level. This is achieved in three steps: firstly, the grayscale image is smoothed by a two-dimensional Gaussian filter [36]. Secondly, it is binarized by applying a basic adaptive mean threshold [10] and finally single pixels and very small 4-connected pixel areas are removed using a seed fill method [14]. In our tests with images from all FVC databases and different combinations of parameters, the following produced the best results: a Gaussian filter with mask size 7 × 7 pixels and σ = 1.0, a 5 × 5 pixels window for the locally adaptive mean threshold and the removal of all 4-connected areas ≤ 10 pixels. 2) Tracing: The line tracing is based upon the principles of the sensor-like "Entracer" introduced in [33]. Lines are traced in black (ridges) and white (valleys). The tracing of valleys is necessary in binarized images of dry fingerprints, whereas ridge tracing is appropriate for wet prints (see Figure 3). It is desirable to trace complete ridge and valley lines in order to retrieve as many pieces of information as possible, but for the purpose of orientation field estimation, it is sufficient if only some parts of lines are traced. For choosing start points, we iterate in a grid over the binarized 1 available at http://www.signalprocessingsociety.org/publications/periodicals/forensics/ image. Initially, all grid points are permitted as start points and 2 available at http://www.stochastik.math.uni-goettingen.de/biometrics/ marked accordingly in a two-dimensional Boolean array. After
4
Fig. 4. The sensor peers from a start point into a circular set of directions.
Step 1
Step 2
Step 3
Step 4
Fig. 6. In step 1, the gray polygon (range = 24 pixels) covers the proximity of the blue line piece in orthogonal direction. Other line pieces (traced ridges or valleys) crossing the polygon are examined for whether they run parallel (green), i.e. forming an angle ≤ 7.5 ◦ with the blue piece. The ratio of green pixels within the polygon to the total number of polygon pixels is 0.21 in this example. Discovered parallel pieces (green) in step 1 are added to the structure. In step 2, the grown structure of coherent pieces is drawn in blue, and for each newly added piece the corresponding polygon (gray) is inspected for crossing line pieces. The iteration continues as long as new parallel pieces are discovered. Fig. 5. Starting in the top left corner of the first image (left), the line-sensor performs an all-around search and traces the line into the direction which can be followed for the longest possible distance (red line). From the next point on, the line-sensor explores only those directions that are located in cone around the recently followed direction (second image).
a line was traced, grid points which are part of the line and neighboring pixels of the same color in the binary image are excluded from being start points. In this way, double tracing of lines is avoided. On commencing to trace a line, the sensor peers from the start point p0 ∈ B(i, j) into d directions as shown in Figure 4. Here, B(i, j) denotes the (i, j)-th pixel of the binary image B. For each direction, the number n of possible pixel steps in the same color are measured. After sorting, let n0 be the biggest value. Prerequisites for beginning to follow a line: firstly, n0 must be greater than a threshold value tminStartLen , and secondly, all other directions with ni ≥ tminStartLen must be situated in a cone around the direction belonging to n0 or in a cone around the opposite direction. If there are other directions with ni ≥ tminStartLen outside these two cones, the tracing is aborted, because the start point might be part of the image background or an area disturbed by noise. If this initial all-around search detects exactly one or two directions, the tracing begins. The second direction is the one belonging to the biggest ni in the opposite cone. Now, the line is followed k ≤ n0 pixel steps into the first direction to the point p1 ∈ B(i, j). The choice of each k aims at going as far as possible in one direction and simultaneously ensuring that the next point is close to the center of the followed line for being able to continue the tracing. Now looking from point p1 , the sensor searches in the cone around the followed direction for the next possible pixel steps without changing the color (see Figure 5). The angle of the cone shall not be much larger than ’normal’ ridge bending. Let n0 be the biggest pixel step value and tminContinueLen the minimum length necessary for the continuation of the tracing. If n0 ≥ tminContinueLen , the line is followed in the direction which belongs to n0 and this step is iterated. Otherwise the line is terminated and if there is a second direction at the start point, the line is tracked in that direction in the same manner. Also, after each step from pk to pk+1 , this piece is marked as
an 8-connected line in the start point image and it is checked whether an already discovered line was crossed. If so, the intersecting angle α is determined. For an α smaller than a threshold tα , the tracing is stopped in order to avoid the double tracing of lines, for a big α, the line tracing continues, and the decision, which of the two lines expresses the true ridge flow and which line tracks a scar, will be postponed. After a line can not be traced further, it is stored in a list. The color of the line and intermediate points are stored. Henceforward, ’line piece’ or ’line segment’ denotes the segment between of two consecutive intermediate points on a traced ridge or valley.
Fig. 7. The main steps of the line-sensor based method. Top left: image 107_7 from FVC2000 DB2 [28] with 15 randomly added artificial scars; top right: traced ridges (blue) and valleys (red); bottom left: merged coherent structure; bottom right: derived orientation field after reconstruction.
5
For the experimentation in Section III, the following parameters were used: • grid size g = 4 pixels • number of directions d = 120 • minimum start length tminStartLen = 15 pixels • minimum length for continuing the tracing tminContinueLen = 5 pixels ◦ • start cone size conestart = 45 ◦ • max bending threshold conebending = 15 ◦ • intersecting angle threshold tα = 22.5 Related work: For the purpose of minutiae detection, a different tracing approach operating in the grayscale image was proposed by Maio and Maltoni [27]. Extensions are given in [26] by tracing both, ridges and valleys, and in [23] by adaptive tracing and filtering. B. Orientation Field Estimation 1) Evaluation of Traced Lines: Once, we have a list of lines consisting of straight pieces, the critical question arises: which lines, or which pieces of lines, reflect the true ridge flow, and which pieces belong to traced scars and other sources of noise? Bearing in mind the continuity of ridge flow perpendicular to the flow direction, such line pieces tend to comprise the true ridge flow that are confirmed by many parallel line pieces. Traced scars may also have other parallel scar pieces, but from a broader perspective, they remain a local phenomenon. The number of parallel ridge and valley line pieces are detected for each line piece in the following way: A vector orthogonal to the piece’s orientation is added to and subtracted from the start point and the end point of the piece. These resulting four points form a polygon which covers the neighborhood in orthogonal direction. We examine whether the pieces crossing this polygon run parallel (see Figure 6 step 1). If so, simply the number of pixels that belong to the parallel piece and are located inside the polygon are summed up. The ratio of parallel pixels to total pixels of the polygon is used as an indicator for the goodness of the piece. This ratio and the polygon are stored for each piece and they will be utilized in the next step. A good line is characterized by the fact that a high percentage of lines and line pieces in the region surrounding the good line run parallel. This, to some extent, is also true for lines that are very closely located to the core and delta points. 2) Growing Coherent Structure: After sorting all line pieces according to descending parallel ratios, let p0 be the piece with the biggest proportion of parallel parts. Beginning with p0 and a new, blank image coherent structure (CS), a structure of coherent pieces is created as follows: p0 is added to a new list s1 which keeps track of all pieces building this structure. The polygon belonging to p0 is drawn on CS and in the start point image S, where all line pieces are marked, the pieces located in or crossing the polygon area are detected (see Figure 6). If a piece under consideration and p0 form an angle α ≤ tparallel , the new piece is classified as parallel and added to the list s1. Next, for each piece pk that was added during the last step, the according polygon is drawn on CS and that area of the polygon which was previously blank is checked in image S for the occurrence of pieces.
Each detected piece parallel to pk is appended to the structure s1. The iteration lasts until in a single step no new parallel pieces are discovered and the growth of structure s1 stops. The pixel count of the whole structure is stored. From the list of line pieces, sorted in descending order with respect to their ratio, the next item is analyzed. If piece p1 is not part of structure s1, a new structure s2 is build starting with piece p1 , else it is continued with piece p2 . Finally, all structures that cover an area of more than tminP ixel are merged. Traced scar lines may have some parallel pieces and grow to a structure, but even in the case of two or more parallel scars this remains a local phenomenon, and in this merging step all possible scar influence is excluded. For the experimentation in Section III, we used tminP ixel = 1000. Related work: A region growing algorithm proposed by Jain and Feng [21] for blocks of 2D sine waves instead of line pieces rests upon a similar philosophy. Another idea for verifying thinned ridges extracted from a binarized image was presented in [15] for OF estimation and subsequent fingerprint classification. Two papers were recently published which especially address the problem of creases and scars: Oliveira and Leite [35] propose to detect and reconnect broken ridges using a multiscale directional operator in combination with morphological tools. In [41] creases are detected for removing spurious minutiae and as a feature for fingerprint matching. 3) Orientation Field Estimation: For the orientation field estimation, the image I is divided into blocks. Reasonable values for the block size b are in the range from 1-16 pixels. For the scar simulation in Section III-B, a block size of b = 8 pixels was chosen. Each block B(a, b) is initialized with a vector v(a, b) = [0.0, 0.0]. Iterating over the merged line piece structure created in the last step, each line piece propagates its orientation to the OF in the following way: The polygon belonging to the line piece is reused for determining which OF blocks are overlapped by it and how many pixels are covered. Let ϕk be the orientation of line piece pk and assume it covers nk,(a,b) pixels of block B(a, b). Then, the weighted influence of piece pk on block B(a, b) is wk,(a,b) = nk,(a,b) /b2 and v(a, b) is updated: vnew (a, b) = vold (a, b)+[wk,(a,b) ·cos(2∗ϕk ), wk,(a,b) ·sin(2∗ ϕk )]. The idea of doubling the angles before summing up the vectors was introduced by Kass and Witkin [24]; it reflects the fact that tangents to flow lines have no direction, so the angles are defined (mod π). The orientation of each block is calculated by ϕ(a, b) = 0.5·atan2(vy(a, b), vx(a, b)) (mod π) [31]. This propagation makes good use of the continuity of ridge flow orthogonal to the flow direction which is an intrinsic property of fingerprints. Finally, the polygons belonging to the line pieces of the merged coherent structure are reused for deciding which blocks of the orientation field receive enough orientation influence by the line pieces. If the original image is disturbed and has some noisy areas, this tends to lead to hiatuses in the merged coherent structure. Now, these missing blocks are determined and they will be reconstructed in the next step. Starting with a blank image P , all polygons appertaining to the line pieces of the merged coherent structure are drawn on
6
P . For all blocks that are nearly completely or totally covered by polygons, the orientation ϕ(a, b) is stored, all other blocks are marked as missing. 4) Reconstructing Missing Blocks: First, it is determined which missing blocks are 4-connected with each other and together, they form a gap in the OF. It is checked whether a gap adjoins the image border or not, and the information is stored. 5) Small Gaps: Single or two connected missing blocks are simply reconstructed as follows: The missing block is regarded as the center of a 5 × 5 blocks neighborhood. Let (xm , ym ) be the coordinates of the missing blocks center, (xab , yab ) of block B(a, b) respectively. Let α(ab),m be the angle between the orientation of block B(a, b) and the line from (xab , yab ) to (xm , ym ) with 0 ≤ α(ab),m ≤ π/2 and d(ab),m be the Euclidean distance. The influence of each block is weighted with wab = (2 ∗ α(ab),m )/(π ∗ (1 + d(ab),m )). Thus, blocks close to the missing block have a greater influence than those further away, and blocks with an orientation parallel to the missing block’s location are weighted stronger. For an example, see Figure 8.
Fig. 8. The central block is reconstructed. Missing blocks are gray.
and it is reconstructed like the single block previously, starting with the missing block that has the largest weights from the neighboring blocks. The same procedure is applied for gaps containing a delta. If the Poincaré index indicates a core or a whorl inside the gap, the location of the core point is estimated by the intersection points of lines perpendicular to the orientation as proposed by Novikov and Kot [34]. From each block along the margin, the line perpendicular to its orientation is drawn and intersections are counted. Figure 10 shows the numbers of intersection points. Blocks whose normal lines did not cut the gap are marked in blue. The blue blocks in Figure 10 correspond to the margin blocks 14 to 18 in Figure 10. In the case of more than one candidate for the block containing the core point, the block with the smallest average distance to the blue blocks is chosen. After the core block is determined, the reconstruction begins with the missing block that is farthest away from the core. Unlike before, only those neighboring blocks are accounted for that are located in the cone around the direction from the core block to the missing block (we used a cone of 15 ◦ ), and that are further away from the core than the missing block (see Figure 9). Orientations of reconstructed blocks are included in subsequent reconstruction steps. See Figure 11 for a successful reconstruction of a whorl (left column) and an example in which the reconstruction fails.
Fig. 9. Only the orientations in green influence the reconstruction, the orange ones are ignored.
Fig. 10. On the left, the Poincaré index is calculated using the margin of the big gap. On the right, the numbers of intersection points within each block are displayed.
6) Big Gaps: For three or more missing blocks connected with each other, a path on the margin around the big orientation field gap is detected and the Poincaré index is calculated. If the result is 0, then the area contains no singular points,
Fig. 11. Two fingerprints of the class whorl. For the image on the left, the reconstruction of the orientation field leads to a satisfactory result. For the image on the right, it failed for two reasons: first, the location estimation of the upper core (block in magenta) is inexact, and second, the core below is missing. This is due to its location being in an area with too few parallel segments to be part of the coherent structure, and the singular point detection of the presented method is limited to gaps which are surrounded by blocks endowed with an orientation estimation.
7
7) Border region: Having finished the reconstruction of all missing blocks inside the orientation field, the OF estimation is gradually expanded from the center to the image border in the same way as the single blocks were reconstructed. This proceeds until the orientation of all blocks is estimated. C. Segmentation and Image Quality A byproduct of the growing coherent structure in Section II-B2 is the classification of the area covered by this merged structure as foreground. For an illustration, see Figure 7 image (d). The union of all polygons belonging to the line pieces of the merged coherent structure form the gray area and can be regarded as foreground. Small gaps can easily be filled by applying the composite morphological operator ’closing’ [19]. Furthermore, a local quality index can be intuitively derived from the coherent structure in combination with the traced line segments that are located in the foreground but are not part of the coherent structure by computing the relation of ’good’ line segments which are part of the coherent structure to the overall number of traced line segments in that area. An exception is the direct neighborhood to core points where due to the high curvature it tends to be difficult to find parallel pieces, In the terminology of [2], the aforementioned quality index belongs to the category of measures which are based on the local direction. At the matching stage, the local quality index can be used for evaluating the reliability of the extracted features so that features from high quality areas gain more influence [7]. Also, this quality index can be mapped easily to the division of the image by Hong et al. [16] into the categories ’welldefined’, ’recoverable’ and ’unrecoverable’. In our model, a well-defined area consists mostly of line segments that are part of the coherent structure of parallel pieces, whereas a neighborhood which is covered by the coherent structure and simultaneous has a considerable portion of line segments originating from the tracing of noisy parts can be classified as ’recoverable’. If an area is not covered by the coherent structure, but it differs clearly from the background e.g. pertaining to the mean and variance of its gray values [3], then this quality corresponds to category ’unrecoverable’. The OF estimation method described in Section II-B3 can effortlessly extrapolate into ’unrecoverable’ and background regions, but in terms of avoiding the extraction of spurious features and reducing computational costs for subsequent image enhancement, it is advisable to exclude these regions [1]. D. Ridge Frequency Estimation Applying the merged coherent line structure and the orientation field, an estimate of the ridge frequency can be derived. This may be very useful, e.g. if a Gabor filter shall be applied in a subsequent image enhancement step.
its performance with the gradient based method [4] and the multiscale directional operator [35]. In a first step, a small number of good quality images was chosen in which foreground and orientations were manually marked. Next, artificial noise was added to these images mimicking scars and broken ridge lines, and the performance of all three methods was measured for various levels of noise. In the main part of the experimentation, 60 naturally poor images were chosen which represent the typical types of noise. In these images, 1782 orientations were manually marked with a focus on regions affected by noise. As described in Section I-A, an estimated orientation that deviates considerably from the true ridge flow passed on to a Gabor filter tends to lead to the creation of spurious minutiae. According to a reviewers suggestion, hence, we will use the number of estimated orientations that deviate more than 15 ◦ from the marked orientation as a measure for comparing the performance. B. Scar Simulation For our simulation, 15 good quality grayscale images were chosen from the FVC2000 [28] and FVC2002 databases [29]. The images were divided into blocks of 16 × 16 pixels. A human expert classified the blocks into foreground or background and determined the orientation for each foreground block. This ’ground truth’ orientation will be used as the reference value for the performance evaluation. Scars are simulated by drawing white bars onto the original images. See Figure 7 for an example with 15 artificial scars. Simulation runs were conducted for 5 to 25 scars in steps of 5 additional scars (see Figure 12). For each number of scars and each original image, 100 scar images were produced. The following parameters were randomly chosen (independent and identically distributed) in the given range: • length (10 to 50 pixels and 10 to 200 pixels; see Figure 12) • width (2 to 5 pixels) • orientation (0 to π) • x- and y-coordinate of the scar center (among all foreground pixels) For the original images, the gradients based method performed slightly better than the line-sensor based method (12 vs. 20 estimations with deviation > 15 ◦ out of 4072 foreground blocks). Most of those erroneous estimations by the line-sensor were caused by the difficulty of finding parallel line pieces in the core area. With an increasing number of simulated scars, the gradients based orientation estimation deteriorates proportionally to the amount of added noise. The performance of the multiscale directional operator is more stable than the gradients based method, but it is significantly worse than the line-sensor based method. C. Simulation of Broken Ridges
III. E XPERIMENTAL R ESULTS A. Introduction In this section, we aim to analyze the robustness to noise of the line-sensor based method for OF estimation and compare
In a simulation of broken ridge lines, we strove to mimic the type of noise caused by a dry finger. The results (see [11]) are similar to the previous experimentations with simulated scars. The OF estimation derived from the coherent structure of
8
Fig. 12. Performance comparison for different levels of artificial scar noise. The scar length was randomly chosen (i.i.d.) between 10 and 50 pixels (left) and between 10 and 200 pixels (right).
parallel lines is less susceptible to this kind of simulated noise than the gradients based OF estimation and the multiscale directional operator. D. Real Life Noise
Fig. 13. OF estimations for three images from FVC 2004 (top row: image 107_3 from DB2; below images 106_7 and 101_8 from DB1). The left column displays the gradients based estimation (with W = 59), the central column the estimation of the multiscale directional operator (with D = 30, n = 16 and Ω = 45) [35] and the right column depicts the result of the line-sensor based method. For illustrative purposes, the orientation at every 16th pixel horizontally and vertically is shown for the gradients based method and the multiscale directional operator which are endowed with pixelwise calculated OFs.
For the benchmark test with real life noise, 60 poor quality images were chosen from FVC2004 [30]. This selection
Fig. 14. The performance of the gradients based OF estimation (left) and the multiscale directional operator (right) on 1782 marked orientations from 60 images of FVC2004. On the right, an orange circle indicates a smoothing window Ω of 15 pixels, a yellow square 31 pixels and a red triangle 45 pixels, respectively.
represents three typical types of noise (see Figure 2): • • •
Wet finger Dry finger Finger with scars
1782 orientations were manually marked with a focus on regions affected by noise. Selection criteria for the marked orientations were that ridge flow can be determined clear without ambiguity by a human expert and the location presumably poses a challenge to an automatic orientation estimation. All marked orientations and estimations by the line-sensor method consisting of the tuple image filename, x- and y-coordinate and angle are made available at the journal’s and the authors’ website for comparative tests. On these naturally poor fingerprint images (see Figure 13 for three examples), the line-sensor based method is compared with the gradients based method and the multiscale directional operator using the same performance measure as before. For the gradients based method, orientations were computed using averaging windows with sizes ranging from 5 to 101 pixels. Odd window sizes were applied, so that the marked location (i, j) is the true center of the averaging window. If the window protrudes the image border, only the available gradients were accounted for. Results depending on the size of the averaging window are shown in Figure 14. The multiscale directional operator [35] was calculated using the standard deviation as information parameter and with pixel-wise filtering as suggested by the authors. Orientation estimations were computed for 36 different combinations of the three parameters number of directions D, number of test points n and the size of the smoothing window Ω. For the number of directions, values in the range from 4 to 120 were tested. As shown in Table I, the line-sensor based orientation estimation deviates in only 79 out of 1782 cases more than 15 ◦ from the manually marked orientation, whereas the best result of the gradient based method was 119 erroneous estimations for averaging window sizes of 57 and 59 pixels. The best performance of the multiscale directional operator was 259 deviations of more than 15 ◦ . This result demonstrates the robustness and effectiveness of
9
TABLE I C OMPARISON OF O RIENTATION E STIMATION P ERFORMANCE ON 1782 M ARKED O RIENTATIONS FROM 60 IMAGES OF FVC2004 [30]
Orientation Estimation Method
Line-sensor
# deviations > 15 ◦
79
pleted while Preda Mih˘ailescu was supported by the Volkswagen Foundation grant “Explicit Methods in Computational Number Theory and Pattern Recognition”. Carsten Gottschlich and Axel Munk gratefully acknowledge support from the DFG research training school 1023 “Identification in Mathematical Models: Synergy of Stochastic and Numerical Methods”, and DFG FOR 916. R EFERENCES
Gradients
119
Best results with w = 57 and w = 59
Multiscale directional operator
259
Best result with D = 30, n = 16 and Ω = 45
the line-sensor based approach for orientation estimation in regions of fingerprint images which are disturbed by real life noise. IV. D ISCUSSION A. Application Areas and Computational Complexity In comparison to the gradients based method, the presented line-sensor based method can estimate the flow of ridges and valleys for noisy fingerprint image regions in a significantly more robust way as shown in Section III-D. On the other hand, it has the disadvantage of a greater computational complexity than the gradients based approach. Hence, the choice of the OF estimation method will depend on the area of application. In forensics, the benefits of a more reliable orientation estimation can outweigh computational costs, whereas in on-line fingerprint verification fast computation is of great importance. Therefore, we envision that the further development of the line-sensor based method for OF estimation will go in two directions: one is the formulation of a ’light version’ that follows the principles of the line-sensor and the coherent structure of parallel segments and meets the computational requirements and time constraints of on-line verification systems. The second direction is the improvement of the ’forensic version’ with aim of obtaining all the ridge flow information that is present in a fingerprint image, and simultaneously providing a segmentation into foreground and background as well as a local image quality estimation which can be used for assessing the reliability of extracted features at the matching stage. In this way, a subsequent image enhancement step is optimally prepared. Moreover, we intend to conduct a goal-directed test on large fingerprint databases measuring the verification performance and the computational demands of the line-sensor based method in comparison with other OF estimation methods. In addition, it will be of interest to apply the presented method to fingerprint latents and palmprints. ACKNOWLEDGMENTS The authors would like to thank the anonymous reviewers for their valuable comments. Part of this research was com-
[1] H. Ailisto, M. Lindholm and P. Tikkanen, “A Review of Fingerprint Image Enhancement Methods”, Int. Journal of Image and Graphics, vol. 3, no. 3, pp. 401-424, 2003. [2] F. Alonso-Fernandez, J. Fierrez, J. Ortega-Garcia, J. Gonzalez-Rodriguez, H. Fronthaler, K. Kollreider and J. Bigun, “A Comparative Study of Fingerprint Image-Quality Estimation Methods”, IEEE Trans. Inf. Forens. Security, vol. 2, no.4, pp. 734-743, 2007. [3] A. M. Bazen and S. H. Gerez, “Segmentation of Fingerprint Images”, Proc. ProRISC 2001 Workshop on Circuits, Systems and Signal Processing, Veldhoven, The Netherlands, November 2001. [4] A. M. Bazen and S. H. Gerez, “Systematic Methods for the Computation of the Directional Fields and Singular Points of Fingerprints”, IEEE Trans. Pattern Anal. Mach. Intell., vol. 24, no. 7, pp. 905-919, 2002. [5] A. M. Bazen,N. J. Bouman and R. N. J. Veldhuis, “A Multi-Scale Approach to Directional Field Estimation”, Proc. ProRISC, pp. 215-218, 2004. [6] R. Cappelli, M. Ferrara, A. Franco and D. Maltoni, “Fingerprint Verification Competition 2006”, Biometric Technology Today, vol. 15, no. 7-8, pp. 7-9, 2007. [7] Y. Chen, S. Dass and A. K. Jain, “Fingerprint Quality Indices for Predicting Authentication Performance”, Proc. AVBPA 2005, Rye Brook, New York, pp. 160-170, 2005. [8] M. J. Donahue and S. I. Rokhlin, “On the Use of Level Curves in Image Analysis”, Computer Vision, Graphics, and Image Processing: Image Understanding, vol. 57, no. 2, pp. 185-203, 1993. [9] J. Funada et al., “Feature Extraction Method for Palmprint Considering Elimination of Creases”, Proc. 14th Int. Conf. Pattern Recognition, pp. 1849-1854, 1998. [10] R. C. Gonzalez and R. E. Woods, “Digital Image Processing”, Prentice Hall, Upper Saddle River, New Jersey, 2002. [11] C. Gottschlich, P. Mih˘ailescu and A. Munk, “Robust Orientation Field Estimation in Fingerprint Images with Broken Ridge Lines”, Proc. 6th Int. Symposium on Image and Signal Processing and Analysis (ISPA), September 16-18, Salzburg, Austria, accepted, 2009. [12] J. Gu, J. Zhou and D. Zhang, “A Combination Model for Orientation Field of Fingerprints”, Pattern Recognition, vol. 37, no. 3, pp. 543-553, 2004. [13] J. Gu, J. Zhou and C. Yang, “Fingerprint Recognition by Combining Global Structure and Local Cues”, IEEE Trans. Image Process., vol. 15, no. 7, pp. 1952-1964, 2006. [14] D. Henrich, “Space-efficient Region Filling in Raster Graphics”, The Visual Computer: An International Journal of Computer Graphics, vol. 10, pp. 205-215, 1994. [15] L. Hong and A. K. Jain, “Classification of Fingerprint Images”, Proc. of 11th Scandinavian Conf. on Image Anal., June 7-11, Kangerlussuaq, Greenland, 1999. [16] L. Hong, Y. Wan and A. K. Jain, “Fingerprint Image Enhancement: Algorithms and Performance Evaluation”, IEEE Trans. Pattern Anal. Mach. Intell., vol. 20, no. 8, pp. 777-789, 1998. [17] T. Hotz, “Modelling and Analysing Orientation Fields of Fingerprints”, PhD Thesis, University of Goettingen, 2007. [18] S. Huckemann, T. Hotz and A. Munk, “Global Models for the Orientation Field of Fingerprints: An Approach Based on Quadratic Differentials”, IEEE Trans. Pattern Anal. Mach. Intell., vol. 30, no. 9, pp. 1507-1519, 2008. [19] B. Jähne, “Digital Image Processing”, Springer, New York, 2002. [20] A. K. Jain and F. Farrokhnia, “Unsupervised Texture Segmentation Using Gabor Filters”, Pattern Recognition, vol. 24, no. 12, pp. 1167-1186, 1991. [21] A. K. Jain and J. Feng, “Latent Palmprint Matching”, IEEE Trans. Pattern Anal. Mach. Intell., vol. 31, no. 6, pp. 1032-1047, 2009. [22] A. K. Jain, S. Prabhakar, L. Hong and S. Pankanti, “Filterbank-Based Fingerprint Matching”, IEEE Trans. Image Process., vol. 9, no. 5, pp. 846-859, 2000.
10
[23] X. Jiang, W.-Y. Yau and W. Ser, “Detecting the Fingerprint Minutiae by Adaptive Tracing the Gray-Level Ridge”, Pattern Recognition, vol. 34, no. 5, pp. 999-1013, 2001. [24] M. Kass and A. Witkin, “Analyzing Oriented Patterns”, Computer Vision, Graphics, and Image Processing, vol. 37, no. 3, pp. 362-385, 1987. [25] M. Kawagoe and A. Tojo, “Fingerprint Pattern Classification”, Pattern Recognition, vol. 17, no. 3, pp. 295-303, 1984. [26] J. Liu, Z. Huang and K. L. Chan, “Direct Minutiae Extraction from Gray-level Fingerprint Image by Relationship Examination”, Proc. Int. Conf. on Image Process., vol. 2, pp. 427-430, 2000. [27] D. Maio and D. Maltoni, “Direct Gray-Scale Minutiae Detection in Fingerprints”, IEEE Trans. Pattern Anal. Mach. Intell., vol. 19, no. 1, pp. 27-40, 1997. [28] D. Maio, D. Maltoni, R. Capelli, J. L. Wayman and A. K. Jain, “FVC2000: Fingerprint Verification Competition”, IEEE Trans. Pattern Anal. Mach. Intell., vol. 24, no. 3, pp. 402-412, 2002. [29] D. Maio, D. Maltoni, R. Capelli, J. L. Wayman and A. K. Jain, “FVC2002: Second Fingerprint Verification Competition”, Proc. 16th Int. Conf. on Pattern Recognition (ICPR), vol. 3, pp. 811-814, 2002. [30] D. Maio, D. Maltoni, R. Capelli, J. L. Wayman and A. K. Jain, “FVC2004: Third Fingerprint Verification Competition”, Proc. Int. Conf. on Biometric Authentication (ICBA), pp. 1-7, Hong Kong, 2004. [31] D. Maltoni, D. Maio, A. K. Jain and S. Prabhakar. “Handbook of Fingerprint Recognition”, Springer, New York, 2003. [32] B. M. Mehtre, “Fingerprint Image Analysis for Automatic Identification”, Machine Vision and Applications vol. 6, no. 3, pp. 124-139, 1993. [33] P. Mih˘ailescu, K. Mieloch and A. Munk, “Fingerprint Classification Using Entropy Sensitive Tracing”, Progress in Industrial Mathematics at ECMI 2006, pp. 928-934, 2006. [34] S. O. Novikov and V. S. Kot, “Singular Feature Detection and Classification of Fingerprints Using Hough Transform”, Proc. of SPIE, vol. 3346, pp. 270-274, 1998. [35] M. Oliveira and N. Leite, “A Multiscale Directional Operator and Morphological Tools for Reconnecting Broken Ridges in Fingerprint Images”, Pattern Recognition, vol. 41, no. 1, pp. 367-377, 2008. [36] L. G. Shapiro and G. Stockman, “Computer Vision”, Prentice-Hall, Upper Saddle River, New Jersey, 2001. [37] B. G. Sherlock and D. M. Monro, “A Model for Interpreting Fingerprint Topology”, Pattern Recognition, vol. 26, no. 7, pp. 1047-1055, 1993. [38] R. Thai, “Fingerprint Image Enhancement and Minutiae Extraction”, PhD Thesis, The University of Western Australia, 2003. [39] P. R. Vizcaya and L. A. Gerhardt, “A Nonlinear Orientation Model for Global Description of Fingerprints”, Pattern Recognition, vol. 29, no. 7, pp 1221-1231, 1996. [40] Y. Wang, J. Hu and D. Phillips, “A Fingerprint Orientation Model Based on 2D Fourier Expansion (FOMFE) and Its Application to Singular-Point Detection and Fingerprint Indexing”, IEEE Trans. Pattern Anal. Mach. Intell., vol. 29, no. 4, pp. 573-585, 2007. [41] J. Zhou, F. Chen, N. Wu and C. Wu, “Crease Detection from Fingerprint Images and its Applications in Elderly People”, Pattern Recognition, vol. 42, no. 5, pp. 896-906, 2009. [42] J. Zhou and J. Gu, “Modeling Orientation Fields of Fingerprints with Rational Complex Functions”, Pattern Recognition, vol. 37, no. 2, pp. 389-391, 2004. [43] J. Zhou and J. Gu, “A Model-Based Method for the Computation of Fingerprints’ Orientation Field”, IEEE Trans. Image Process., vol. 13, no. 6, pp. 821-835, 2004.


![[cea-00470658, v1] Robust Extrapolation Scheme for Fast ... - CiteSeerX](https://m.moam.info/img/260x300/cea-00470658-v1-robust-extrapolation-scheme-for-fa_59eac0571723dded32744e69.jpg)