and those of Optican and Richmond (1987) made use of different stimuli and different analytical tools, they shared two features: a focus on single spike trains ...
The Journal of Neuroscience, August 15, 1998, 18(16):6583–6598
Robust Temporal Coding of Contrast by V1 Neurons for Transient But Not for Steady-State Stimuli Ferenc Mechler,1,2 Jonathan D. Victor,1 Keith P. Purpura,1 and Robert Shapley2 1
Department of Neurology and Neuroscience, Cornell University Medical College, New York, New York 10021, and Center for Neural Science, New York University, New York, New York 10003
2
We show that spike timing adds to the information content of spike trains for transiently presented stimuli but not for comparable steady-state stimuli, even if the latter elicit transient responses. Contrast responses of 22 single neurons in macaque V1 to periodic presentation of steady-state stimuli (drifting sinusoidal gratings) and transient stimuli (drifting edges) of optimal spatiotemporal parameters were recorded extracellularly. The responses were analyzed for contrast-dependent clustering in spaces determined by metrics sensitive to the temporal structure of spike trains. Two types of metrics, costbased spike time metrics and metrics based on Fourier harmonics of the response, were used. With both families of metrics, temporal coding of contrast is lacking in responses to drifting sinusoidal gratings of most (simple and complex) V1
neurons. However, two-thirds of all neurons, mostly complex cells, displayed significant temporal coding of contrast for edge stimuli. The Fourier metrics indicated that different response harmonics are partially independent, and their combined use increases information about transient stimuli. Our results demonstrate the importance of stimulus transience for temporal coding. This finding is significant for natural vision because moving edges, which are present in moving object boundaries, and saccades induce transients. We think that an abrupt change in the adapted state of the local visual circuitry triggers the temporal structuring of spike trains in V1 neurons. Key words: temporal coding; primary visual cortex; transient stimuli; steady-state stimuli; edges; gratings; contrast response; simple cell; complex cell; metric spaces
A prevailing view of neural coding is that the meaningful signal is contained in the mean rate of the action potential discharges of a neuron, and rate variability is noise. Because this noise can be filtered out by averaging across time or neuronal populations, rate coding performs robustly in the presence of noise, but it has limited information capacity. An alternative view is summarized by the term temporal coding; the notion that the timing of individual spikes also carries information. In principle, selective temporal mechanisms could exploit the high intrinsic precision of cortical neurons to increase the efficiency of neural coding. It is natural to assume that rate coding plays a major role in neural signaling, given its apparent simplicity. Decoding a rate code implies temporal summation over periods of time long in comparison with the mean interspike interval or summation across a population. On the other hand, coincidence detection (Abeles, 1982; Bourne and Nicoll, 1993; Softky, 1994; Konig et al., 1996; C line, 1997; Volgushev et al., 1998), refractory periods (Berry and Meister, 1998), activity-dependent synaptic efficacy (Abbott et al., 1997; Gerstner et al., 1997; Markram et al., 1997), post-tetanic potentiation (Alonso et al., 1996; Volgushev et al., 1997), and other forms of temporal integration are just as much a part of the qualitative description of neuronal signal
processing as is linear summation. Furthermore, neuronal spike generation is intrinsically precise (Mainen and Sejnowski, 1995). Thus, neurons are well equipped to generate and process temporal codes. It is well recognized that temporally coded information is present in spike trains of primate visual neurons (Optican and Richmond, 1987; Richmond and Optican, 1987, 1990; Victor and Purpura, 1996, 1997). Although studies in our laboratory and those of Optican and Richmond (1987) made use of different stimuli and different analytical tools, they shared two features: a focus on single spike trains rather than response averages and transient presentation of stimuli. On the other hand, many investigators use steady-state stimulation and averaging methods such as poststimulus time histograms and Fourier analysis, and they either ignore the possibility of temporal coding or conclude that it is not present. Thus, it is unclear whether the apparent presence or absence of temporal coding is an artifact of the analytical method, or rather, is related to physiological differences between transient and steady-state regimens. To settle this issue, we looked for temporal coding in contrast responses collected from the same V1 neurons in transient (drifting edge) and steady-state (drifting grating) regimens. We found strong evidence for temporal coding for the transient edges but not for the steady-state gratings. The same results were obtained from cluster analysis of the Fourier harmonics computed from individual spike trains. The major conclusion that we draw from this study is that the nature of the visual stimulus, rather than the particular method of data analysis, determines whether one finds temporal coding in the responses of V1 neurons. The finding that transient stimuli generate temporally coded responses has implications for natural vision.
Received April 8, 1998; revised June 1, 1998; accepted June 3, 1998. This work was supported by National Institutes of Health Grants EY9314 (J.D.V. and F.M.), NS01677 (K .P.P.), and EY01472 (R.S.). Special thanks to Dario Ringach and Mike Hawken for their help in all phases of the data acquisition. We also thank Matteo C arandini, Mike Hawken, and Daniel Reich for their advice and helpful comments. Correspondence should be addressed to Ferenc Mechler, Department of Neurology and Neuroscience, Cornell University Medical College, 1300 York Avenue, New York, N Y 10021. Copyright © 1998 Society for Neuroscience 0270-6474/98/186583-16$05.00/0
6584 J. Neurosci., August 15, 1998, 18(16):6583–6598
Parts of this paper were presented at the 1997 Annual Meeting of the Society for Neuroscience (Mechler et al., 1997).
MATERIALS AND METHODS Physiolog ical preparation. Standard acute preparation techniques were used for electrophysiological recordings from single units in V1 of macaque monkeys (Kaplan and Shapley, 1982; Hawken et al., 1988, 1996). E xperiments were performed on two adult cynomolgus monkeys, Macaca fascicularis, weighing 1.8 – 4 kg. Before surgery, animals were sedated with acepromazine (0.1 mg / kg, i.m.; PromAce; Fort Dodge, Fort Dodge, IA) and then anesthetized with ketamine (10 mg / kg, i.m.; Ketaset; Fort Dodge). Anesthesia was maintained with sufentanil citrate (3– 6 mg z kg 21 z hr 21, i.v.; Sufenta; Janssen Biochimica, Titusville, NJ), and muscle paralysis was induced (after all surgical procedures) and maintained with pancuronium bromide (0.1 mg z kg 21 z hr 21, i.v.; Astra Pharmaceutical Products, Inc., Westborough, M A). Dexamethasone (1 mg / kg, i.m.; Elkins-Sinn, Cherry Hill, NJ) and gentamicin (5 mg / kg, i.m.; Steris Laboratories, Inc., Phoenix, AZ) were given to prevent the development of cerebral edema and infection, respectively. The animal was ventilated through an endotracheal tube. Heart rate, electrocardiogram, blood pressure, and end-tidal C O2 were continuously monitored with a Hewlett-Packard 78354A patient monitor and kept in the normal physiological range. Core body temperature was maintained at 37°C using a thermostatically controlled heating pad. The EEG was obtained from frontal leads and continuously monitored on an oscilloscope. A limited unilateral craniotomy was made posterior to the lunate sulcus (the Horsley – C larke stereotaxic coordinates were 12–14 mm posterior and 10 –20 mm lateral). A 1–2 mm durotomy was made for the recording electrode, which was stabilized after insertion by agarose gel. E xperiments lasted for 4 d, at the end of which the animal was sacrificed by inf usion of a lethal dose of pentobarbital (Brevital; Eli Lilly and Co., Indianapolis, I N). After transcardiac perf usion, a block of the occipital lobe containing the penetration was saved for histological reconstruction of the electrode track (Hawken et al., 1988, 1996). Laminar positions of the recording sites were estimated in relation to the pattern of cytochrome oxidase stain and Nissl density in the reconstructed cortical section containing the track. Optics. The eyelids were retracted and pupils were dilated with 1% atropine sulfate (Atrosulf-1; Optics Laboratories, Co., Fairton, NJ). The corneas were protected with gas-permeable contact lenses (Metro Optics Inc., Houston, TX). E xternal lenses were used to correct refraction as first estimated by direct ophthalmoscopy and then confirmed or improved by optimizing the high spatial frequency responses of isolated neurons. Foveae were mapped by back-projection on a tangent screen using a reversing ophthalmoscope (Eldridge, 1979). The visual receptive fields of isolated neurons were mapped on the same screen. E xtracellular recording. Microelectrode [glass-coated tungsten (Merrill and Ainsworth, 1972); exposed tip, 5–15 mm; typical resistance, 2 MV] penetrations were driven by a stepping motor in 1 mm steps. The extracellular electrical signal was fed through a differential amplifier and then f urther amplified and bandpass-filtered (0.2–10 kHz). A window discriminator was adjusted to generate brief (50 msec) pulses on each occurrence of the isolated spike. The discriminator input and output were fed to an audio monitor, and the times of occurrence of the pulses were recorded on a personal computer through a general purpose data aquisition box (CED 1401 plus; C ambridge Electronic Design, L td., C ambridge, UK) with 1 msec resolution. Single-unit isolation was aided by monitoring the window levels multiplexed with the raw signal on an oscilloscope and displaying the isolated spike on a separate storage oscilloscope. Isolation criteria used included an audible visually driven response, a minimum interspike interval consistent with a physiological refractory period (.1–1.5 msec), and a uniform, stable spike shape. Only cells that were well and stably isolated throughout the runs described below were included in this study. This restricted analysis to 22 V1 cortical neurons (11 simple and 11 complex), 25% of all neurons encountered. Of the two animals in the study, the first yielded nine neurons (two complex and seven simple), and the second yielded 13 neurons (nine complex and four simple). Simple versus complex categorization was based on (1) the modulation ratio of the f undamental over the DC component of the response to drifting gratings of near optimal spatial parameters (Movshon et al., 1978b; De Valois et al., 1982; Skottun et al., 1991) and (2) the ratio of the first and second harmonics in a spatial summation linearity test (Enroth-Cugell and Robson, 1966; Hochstein and Shapley, 1976; Movshon et al., 1978a,b). Receptive field positions
Mechler et al. • Temporal Coding of Contrast Transients
were all located in the parafovea and perifovea, between 1.5 and 6° eccentricity. V isual stimulation. Stimuli were generated by a Silicon Graphics Elan R4000 computer under the control of the personal computer, displayed on a Barco CCD 7651B color monitor (60 Hz noninterlaced refresh; 1024 3 768 pixels; 60 cd /m 2 mean luminance, 8-bit intensity control). The lookup tables controlling the voltages on the guns of the phosphors in the monitors were linearized with the aid of a Photo Research 703-PC spectroradiometer. The visual space subtended by the illuminated area was 13 3 17° at a 114 cm viewing distance. The display area of the modulated stimulus could be limited to a smaller patch within a 0.5–5° diameter aperture to optimize the response. Stimuli were always centered on, and f ully covered, the receptive field of the neuron. For quantitative analysis, we used two types of drifting onedimensional luminance waveforms: sinusoidal gratings and square waves of low spatial frequency for which we hereafter use the term edges. The luminance profile of the drifting sinusoidal gratings is:
I ~ x, t ! 5 I 0@ 1 1 C sin~ 2 p ~ k x 2 v t !!# .
(1)
Here, I(x,t) is the luminance (candelas per square meter) at position x (degrees) along the grating at time t (in seconds); I0 (candelas per square meter) is the mean luminance of the unmodulated display; C is the Michelson contrast of the stimulus; k (cycles per degree) is the spatial frequency; and v (Hertz) is the temporal frequency. Similarly, the luminance profile of the drifting edges is:
I ~ x, t ! 5 I 0@ 1 1 C sgn~ sin~ 2 p ~ k x 2 v t !!!# .
(2)
This is a square wave with a f undamental spatial frequency of k, temporal frequency of v, and contrast of C. Stimuli were presented monocularly to the preferred eye in trials that spanned several cycles of the periodic stimulus and lasted typically 4 sec (range, 2–16 sec). A brief preliminary qualitative exploration of the spatiotemporal tuning preferences of a unit was followed by a basic set of quantitative characterization experiments, in which the tuning for orientation, then spatial frequency, then temporal frequency, and occasionally orientation again, of a unit were measured using drifting sinusoidal luminance gratings of 64% contrast. The optimal value for each tuning parameter was assessed sequentially and then kept fixed in subsequent tuning experiments for the other parameters. In each tuning experiment, the tuning parameter was varied in random order, and blank trials were randomly interleaved. The blank condition consisted of a uniform display at a luminance identical to the spatiotemporal mean of all modulated stimuli. Orientation and temporal frequency tuning (velocity tuning at fixed spatial frequency) experiments were also performed with drifting edges. Edges had a f undamental spatial frequency of 0.1– 0.3 cycles/°. In the contrast–response experiments, 4 sec trials of drifting gratings or edges of optimal spatiotemporal parameters were interleaved with blank trials of equal duration. Patterned stimuli were presented in order of increasing contrast. Blank trials were intended to minimize the variable effects of contrast adaptation. Each block of trials, representing a f ull set of contrast levels, was repeated several (typically two to four) times in identical trial order, typically yielding 8 –16 sec of recorded spike trains in each condition. Data anal ysis: metric spaces and clustering of spik e trains. The data analysis determines the extent to which there is a reproducible dependence of spike counts and spike times on the contrast of the stimulus. It consists of two separate stages (see in detail below); the construction of a metric space from a set of responses, followed by an analysis of response clustering. For the first stage, we use spike counts and a family of spike time metrics (Victor and Purpura, 1997), both as originally conceived as well as in a modification that makes them more appropriate for analyzing responses to periodic stimulation. We will also introduce new metrics to connect this approach to standard Fourier analysis. We performed the Fourier analysis in addition to the abstract spike time metric space analysis because (1) Fourier components are conventionally and frequently used response measures for periodic stimulation and, (2) more importantly, they naturally give rise to vector spaces unlike the cost-based metrics. Because of point 1, some readers will find the Fourier approach more appealing then the cost-based metric space approach. Because of point 2, the nontrivial question of whether the two independent methods of analysis lead to similar results needs to be answered empirically, which we do here. Although the result of the analysis of clustering in the second stage is dependent on the choice of the particular metric in the first stage, the clustering algorithm itself is not. In this way,
Mechler et al. • Temporal Coding of Contrast Transients
J. Neurosci., August 15, 1998, 18(16):6583–6598 6585
coding based on spike counts and coding based on temporal pattern can be compared on an equal footing. The following paragraphs give the reader the basics of the analyses. A rigorous treatment of this material has been published (Victor and Purpura, 1997). Spik e time metrics. We assess the extent to which spike trains elicited by stimuli of different contrasts appear more “dissimilar” than spike trains elicited by stimuli of the same contrast. This assessment is performed for multiple notions of dissimilarity, or distance, between spike trains, known as metrics. We use a family, D spike[q], of metrics of the distances between spike trains, parametrized by a cost, q, that specifies a presumed time scale (1/q) for the systematic stimulus dependence of spike timing. For D spike[q], two spike trains are considered similar if the number of spikes is similar and if their timing agrees to within 1/q. To formalize this notion, we define the distance between two spike trains as the “cost” of transforming one into the other. The transformation from one spike train into the other is via a sequence of elementary steps, consisting of (1) spike elimination, (2) spike insertion, and (3) shifting a spike in time. Each elementary step is associated with a definite cost. For eliminating or inserting a spike, the cost is unity. To shift a spike, the cost is equal to qDt, where Dt is the extent of the shift. The factor q has units of seconds 21. Given these preliminaries, let
P a 5 $ S a 5 S a1 , S a2 , · · · , S an 5 S b %
(3)
be a path that leads from Sa to Sb through a finite sequence of intermediate spike trains, in which each spike train Saj 1 1 is obtained from the preceding one, Saj, via one of the three types of elementary steps (deletion, insertion, and a finite shift of a single spike). Given a fixed q cost parameter, let Kq(Saj,Saj 1 1) denote the cost of that elementary transformation. The cost of the transformation of spike train Sa to Sb via the pathway Pa is the sum of the cost of all the elementary transformations along that pathway:
K q~ P a ! 5
O
K q~ S aj , S aj11 ! .
(4)
$aj %
Then, for a given cost parameter, q, the distance D spike[q](Sa , Sb ) between Sa and Sb in the metric D spike[q] is defined as the minimum total cost of transforming Sa to Sb:
D spike@ q#~ S a, S b! 5 min$ K q~ P a!% ,
(5)
$ Pa %
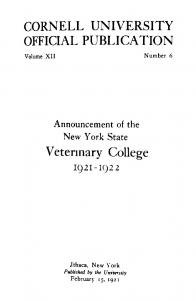
where the minimum is taken over all possible pathways that lead from Sa to Sb via any sequence of elementary transformations. The cost parameter q is the measure of the sensitivity of the metric to the timing of individual spikes. Shifting a spike by an amount of time Dt .1/q is greater in cost than deleting it altogether. In like manner, shifting a spike by an amount of time Dt .2/q is greater in cost than deleting it and reinserting it in the new location. Thus, spikes whose times differ by Dt .1/q sec are viewed by D spike[q] as unrelated. For q 5 0, there is no cost associated with shifting spikes in time (but inserting and deleting spikes are still associated with unit cost). Hence D spike[0] is a metric in which the distance between two spike trains is simply the difference in the number of spikes they contain, and which therefore we denote D count. The diagram in Figure 1 A illustrates a sequence of elementary steps associated with the calculation of the distance in metric D spike[q] between spike trains Sa and Sb. The arrows indicate shifts of spikes in time. Spike deletions and insertions are indicated by the asterisk. Depending on the cost of the shifts (as determined by the cost parameter q) of a metric, the total cost of transformation may be lower if we deleted a spike and reinserted it at the exact required time. Train Sa consists of five spikes, four of which are shifted in time to coincide with spikes in train Sb. However, the first spike in Sa rather than shifted, is deleted and then reinserted into Sb as the next to the last spike. Insertions or deletions are also necessary when the number of spikes in the two trains are not equal. An example of this is the last spike in Sb. An efficient algorithm is available to find the sequence of transformations that have minimal total cost, and thus calculate the distance D spike[q] between spike trains (Victor and Purpura, 1997). In summary, some important properties of the spike time metrics are (1) the distance D spike[q] between two spike trains is small if the number of spikes in them is similar, and their times match within a temporal window of width 1/q; (2) if q is zero, only the spike count matters; and (3) if q is very large, almost all spike trains are far apart, unless the spike times are almost identical, because the metric considers spikes that differ by Dt .1/q to be unrelated.
Figure 1. Quantif ying the dissimilarity of spike trains via the spike time metrics D spike[q] and D spike,circ[q]. The distance between spike trains Sa and Sb is the minimum cost of transforming Sa into Sb via a sequence of elementary steps, as detailed in Materials and Methods. A, Spike time metric D spike[q]. Spike trains are considered to be segments of time, and the periodicity of the stimulus is ignored. The direction of time is indicated at the bottom lef t. Transformation of spike train Sa into Sb involves the deletion of the first spike of Sa (marked by asterisk), insertion of the last two spikes of Sb (also marked by asterisk), and shifts of the other spikes, as diagrammed by the arrows from Sa to the virtual spike train S9. B, The spike time metric adapted to periodic stimuli, D spike,circ[q]. The spike trains Sa and Sb are now considered to be cyclic, with a period corresponding to that of the stimulus. This modification allows shifts of spikes to wrap around across the cycle boundaries. In the example illustrated, this modification changes the minimum-cost set of transformations to one in which the initial spike of Sa (marked by asterisk) is shifted across a cycle boundary to coincide with the last spike of Sb. For spike trains that differ in the illustrated manner, the distances in this modified “circular” D spike,circ[q] metric will be smaller than those defined by the open-ended form, D spike[q]. Spik e time metrics adapted to periodic responses. We modified the above procedure for computing distances between spike trains to make it more appropriate for responses to periodic stimuli. The issue addressed by this modification is illustrated in Figure 1 B. The first spike in train Sa is distant from the last spike in Sb , but it is similar in response phase. Because of the way that D spike[q] is defined, this kind of similarity is neglected, as a consequence of the partitioning of the response into successive epochs. But for periodic stimuli, it might make sense to recognize this kind of similarity by allowing for cyclic wraparound of spikes. That is, for the purpose of shifting spikes in time, individual responses are considered to be on a circular time axis, and each circular segment corresponds to one stimulus cycle. This modification can reduce the cost of transformation of one spike train to another by allowing a shift across the point of wraparound. As the diagram (Fig. 1 B) shows, with this modified spike time metric, D spike,circ[q], it is now cheaper to shift, rather than to delete and then reinsert, the leftmost spike in spike train Sa. We used both the original spike time metric (D spike[q]) and the modification that allowed for cyclic wraparound (D spike,circ[q]) on all data sets, with no noticeable difference in the results. Only the results of analyses with the modified D spike,circ[q] are presented. For a periodic stimulus, there is some arbitrariness inherent in the choice of the phase to use as the cut point for partitioning the spike train into individual responses. One approach is to choose the onset time of the stimulus cycle as the cut point. A second approach is to position the cut point in a region of low firing rate, i.e., between the peaks of the response histogram. We used this second approach, although a control computation on a few data sets showed no significant dependence on this choice. Metrics based on Fourier components. For the purpose of Fourier analysis, an action potential at time tj is treated as a unitary event described by a delta function d(t 2 tj ) centered at tj , and a spike train is described by the sum of delta functions centered on the time of occurrence of each spike in the train. A set of m responses may be represented by
O hl
rl~t! 5
j51
d~t 2 tlj!, 0 , tl1 · · · , thl l # Ts, l [ $1, · · · , m%,
(6)
Mechler et al. • Temporal Coding of Contrast Transients
6586 J. Neurosci., August 15, 1998, 18(16):6583–6598
corresponding to m cycles of the stimulus s of period Ts (and temporal frequency v 5 1/Ts ). We calculate the first n Fourier harmonics of these m responses,
O
H5
hl
Rkl 5
tween the extremes of stimulus-dependent clustering the conf usion matrix N(si , rj ) lies. It is given by
exp~2i2pvktlj !, k [ $0, 1, · · · , n%, l [ $1, · · · , m%.
(7)
O
1 N ~ s a, r b!
a,b
O i,j
N ~ s i, r j !
F
log2N ~ s i, r j ! 2 log2
j51
2 log2 We considered families of metrics based on these Fourier components. For each harmonic of the stimulus cycle, the corresponding Fourier component can be thought of as a two-component vector (the real and imaginary parts). A set of k Fourier components thus corresponds to a real vector space of 2k dimensions. In a vector space, a natural distance is defined by the Pythagorean rule, and this Euclidean vector– space distance can also serve as a metric. We explored four families of such metrics, each parametric in n, the largest Fourier harmonic considered: (1) F single[n], the Pythagorean distance based on the nth harmonic alone; (2) F all[n], the Pythagorean distance based on all of the first n components; (3) F even[n], the Pythagorean distance based on the even harmonics up to n; and (4) F odd[n], the Pythagorean distance based on the odd harmonics up to n. The temporal frequency of the nth harmonic, nv, plays a role similar to that of the cost parameter q; for both, the reciprocal specifies the time scale over which details in the temporal structure of the spike train affect the corresponding metric. With this in mind, we allowed nv to span a comparable range to that of q in our calculations (see below). Cluster anal ysis. Each of the above metrics formalizes a notion of similarity between spike trains. A candidate notion of similarity is only relevant to coding if the observed responses to distinct stimuli tend to be more dissimilar than responses to the same stimulus (Victor and Purpura, 1997). The goal of the second step in our analysis is to ask, for each of the metrics, the extent to which this is the case. The answer is summarized by a single value, the transinformation (Abramson, 1963). We use transinformation as a measure of stimulus-dependent clustering for each metric. If it is high, then each stimulus leads to distinct response clusters in the abstract space defined by the metric under consideration. That is, the responses to different contrasts are much more dissimilar (i.e., lie in distinct clusters) than responses to the same contrast. If the transinformation is low, then (for the particular metric under consideration), responses to stimuli of different contrasts are largely overlapping. Note that we use transinformation to quantif y the extent to which clustering of spike trains, not spikes, in metric spaces of responses systematically depends on a stimulus parameter (contrast). The experiment is considered to consist of C stimuli s1 , s2 , . . ., si . . ., sC. We classif y an individual spike response S according to its average distance from all the responses S a 5 {S9} elicited by each particular stimulus sa. A spike train S e S i elicited by stimulus si will be classified as belonging to response class rj if it was closer on average to the S j responses elicited by stimulus sj than to the responses elicited by any other stimulus. For this purpose, the average distance between a spike train S and all the responses S a elicited by stimulus sa is defined by:
d ~ S, S a! 5
F
^~ D ~ S, S9 !! 22& S9[Sa
G
1 2 2
(8)
for any metric D, which may include D spike,circ[q], F single[n], F all[n], etc. This classification procedure is then applied to each spike train. Results are summarized in a conf usion matrix, N(si , rj ), which tallies the instances in which a stimulus si elicited a response that was categorized as belonging to response class rj. That is, N(si , rj ) is the number of instances in which a response to stimulus si would be conf used with a response to a stimulus sj , based on the similarities of the recorded spike trains. If this matrix is diagonal, responses are in perfect correspondence to the stimuli that elicited them, and the extent of stimulus-dependent clustering is maximum. If, on the other hand, the conf usion matrix elements are all equal, then the metric leads to an apparently random association between stimuli and responses. In this instance, the extent of stimulus-dependent clustering is minimum. The conf usion matrix N(si , rj ) depends on the metric via the clustering algorithm. The transinformation indicates, for any metric, where be-
O
N ~ s a, r j !
a
O b
N ~ s i, r b ! 2 log2
O a,b
N ~ s a, r b !
G
(9)
H takes on non-negative values (in bits), with H 5 0 corresponding to minimum clustering. The maximum value of H depends on the choice of stimuli. (For this reason, we used sets of comparable contrasts for the edge and grating experiments.) For C equally likely stimuli, perfect stimulus-dependent clustering corresponds to H 5 log2C. In our data sets, stimuli of different contrast were not equally likely. Each stimulus of nonzero contrast was presented an equal number of times, but the blank (zero contrast) was presented a number of times equal to the total number of nonblank presentations. For C 2 1 nonblank stimuli and 1 blank presented with these probabilities, perfect contrast-dependent clustering corresponds to H 5 1 1 0.5 log2(C 2 1). For C 5 7, H ;2.29, the ideal maximum for our contrast experiments. However, much smaller values of H indicate significant stimulus-dependent clustering. For example, a 70% correct performance in a two-alternative forced choice situation corresponds to H 5 0.12. When the set of available responses is limited, as in real data, the estimate of the transinformation H contains a positive bias (C arlton, 1969; Treves and Panzeri, 1995). This is because even if clustering is at chance levels, there may not be an equal number of counts in each cell of the conf usion matrix. A conservative approach to correction of this bias is to subtract an empirical estimate of the bias in H caused by chance clustering. We derived this estimate by recalculating the transinformation after several random reassignments (typically 10) of the responses across stimuli. We found that this bias estimate for H was small compared with H and also relatively independent of q. Hence, our results would not change had we elected to not subtract the correction. Further discussion of the bias and the algorithm to compute H is given in Victor and Purpura (1997). The shape and maximum of the H(q) f unction describes the temporal coding capabilities of the neuron. If, for example, the spike count carries all of the potential information in a response of a neuron, then H(q) will achieve its maximum at q 5 0, because timing of individual spikes [which affects H(q) for q . 0] does not depend systematically on the stimulus and thus degrades clusters. On the other hand, if the timing of spikes systematically depends on the stimulus, then we expect that H(q) will be maximal in the neighborhood of q, which is the inverse of the meaningf ul temporal precision of the firing of the neuron. We computed H(q) at q 5 0 and typically 14 additional points in logarithmic steps along the q axis from 1 to 512, corresponding to increasing temporal sensitivities from the order of a second through a few milliseconds. For the metrics based on Fourier harmonics, the characteristic frequency nv takes the role of q. For H(nv), nv was varied, in a range comparable to that of q, in 14 steps.
RESULTS In previous work, evidence for temporal coding of contrast in V1 neurons was obtained in experiments that used several types of transient stimuli, including flashed gratings and patterns (Victor and Purpura, 1996, 1998; Richmond et al., 1997). Those experiments did not include steady-state grating stimuli–stimuli, which are commonly used in vision research but which are not typically analyzed for the presence of a temporal code. This leaves open the question of whether the transient nature of the stimulus is essential for temporal coding, or, alternatively, whether the apparent presence of temporal coding is primarily attributable to the analytical approach. To address this question, we compared (for the same neurons) the coding of contrast in responses to two classes of stimuli: drifting sinusoidal gratings and drifting lowfrequency square waves, or edges. The drifting square waves were presented with at most one edge within the receptive field at any time. Unlike sustained presentation of drifting gratings that provide a spatiotemporal steady-state input for the local cortical
Mechler et al. • Temporal Coding of Contrast Transients
circuit, a drifting sharp edge engages only parts of that same circuit at any time, and only in a transient manner. Contrast responses to drifting sinusoidal gratings as well as drifting square waves (edges) of 22 isolated neurons were extracellularly recorded in the primary visual cortex of the anesthetized macaque monkey. For stimuli of both classes, the orientation, direction, and temporal frequency (and, for gratings only, spatial frequency) were optimized for the selectivity of the receptive field of each neuron. Details of the optimization are given in Materials and Methods. The contrast levels spanned a wide range in approximately logarithmic steps, 8 –78% for gratings and 11–90% for edges. (Note that the contrast of the first harmonic component of an edge was approximately equal to the contrast of a corresponding grating in the set. We needed to explore a similar response range for edges and gratings. With the convention we used, the contrasts, response sizes, and clustering estimates for the two stimulus classes were comparable.) Thus, a complete data set for one neuron consists of a set of responses at six nonzero contrast levels and the blank condition, for both gratings and edges. We first present results of the analysis based on spike time metrics and then those based on Fourier components. For each set of metrics, we begin by showing the analysis of responses from several typical units, and then present results across the population of neurons in our sample.
Cluster analysis based on spike time metrics Single-unit e xample: complex cell Figure 2 shows the data obtained from a complex cell, typical of our sample. For this cell, a nondirectional layer 6 neuron, the stimulus parameters were 0.2 cycle/°, 1 Hz (edge), and 1.6 cycles/°, 5 Hz (grating). Responses to edges (Fig. 2 A–C) and to gratings (Fig. 2 D–F ) are presented in identical format. This complex cell, when measured with both gratings and edges, had a threshold contrast of ;5% (data not shown) and a monotonically increasing response up to 60 – 80% contrast. For gratings, the contrast– response f unction saturated at the highest contrasts (Fig. 2 E). The raster plots in Figure 2 A show the cycle-by-cycle responses to drifting edges. Each of the six runs contained four cycles of the stimulus; the illustrated rasters were obtained by segmenting each of these runs at the onset of each stimulus cycle, for a total of 24 cycles. This neuron, like most complex cells, had nonzero spontaneous activity in the presence of the blank (zero contrast) and responded to the passage of edges of both polarities with similar bursts. (Each cycle of the drifting square wave introduces two edges of opposite contrast, half a cycle apart.) The average number of spikes in these bursts monotonically increased with increasing contrast. There is a moderate phase advance, more noticeable in the first response of each raster line, as contrast increases. The usef ulness of this form of temporal information about the stimulus contrast is unclear, because of trial-to-trial variability. The DC component of the responses (for each contrast, the average spike count divided by the stimulus period) was used to construct the contrast–response f unction in Figure 2 B. The error bars (61 SD of the mean firing rate) indicate a considerable cycle-by-cycle variability in the responses. This variability limits the ability of the cell to discriminate contrast levels based on the spike counts in its response. To compare the usef ulness of changes in spike counts and spike timing, we used the cost-based metric approach described in Materials and Methods. This procedure results in a f unction H(q) that measures the extent to which changes in contrast result in
J. Neurosci., August 15, 1998, 18(16):6583–6598 6587
reproducible changes in firing pattern. When q 5 0, the assessment of firing pattern ignores spike timing altogether and is sensitive only to the number of spikes in each response. For q . 0, the assessment of firing pattern is sensitive to spike timing, with a precision of 1/q. Thus, in examining H(q), we focus on the temporal precision qmax at which the level of contrast-dependent clustering is maximal, Hmax 5 H(qmax ), and we compare Hmax with the level of contrast-dependent clustering obtained by spike counts alone, Hcount 5 H(0). The difference DH 5 Hmax 2 Hcount is a measure of temporal coding in responses of a neuron. If spike timing does not contribute to coding of contrast, then we would find that qmax 5 0 and DH 5 0. We emphasize that we are not so much interested in the absolute transinformation values H, as in how H(q) depends on temporal sensitivity (q), and in how the relative temporal contributions compare across the two classes of stimuli. For the edge responses of this cell, the calculated H(q) is shown in Figure 2C by the thick line and the plus symbols. The cost parameter q (seconds 21) was sampled at 0, and from 1 to 512 in 14 logarithmic steps, with the extremes corresponding to equivalent temporal precision of a second and two milliseconds, respectively. As seen in Figure 2C, H(q) rises from a low value at q 5 0 (Hcount 5 0.35) to a maximum (Hmax 5 0.83) at qmax 5 64 sec 21, indicating that the level of clustering is maximal for a temporal sensitivity of the underlying spike time metric of ;16 msec (1/q). H(q) takes a sharp downward turn for q . 100 sec 21. This cutoff at the high end indicates that paying attention to details of spike timing on the order of #10 msec makes spike trains elicited by the same stimulus seem too dissimilar in the underlying metric to allow meaningful clustering. The dashed line in Figure 2C indicates the estimate for the level of chance clustering which, as previously reported (Victor and Purpura, 1997), is relatively insensitive to q. Thus, the features described above (the location of qmax and the large positive DH 5 Hmax 2 Hcount ), remain after subtracting the correction for chance clustering. We thus conclude that, for this response of this neuron to edges, taking into consideration spike timing yields much greater levels of stimulus-dependent clustering than would be obtained by counting spikes alone. That is, stimulus contrast may be determined from the responses with greater certainty if the timing of spikes is not ignored. This finding is typical of the complex cells in our sample. The same analysis was also applied to the responses elicited from this complex cell by the gratings, the steady-state stimuli (Fig. 2 D–F ). This neuron, like most complex cells, responds to gratings of optimal frequency with a rather unmodulated elevation of the spike rate. The response rasters (Fig. 2 D) show a relatively irregular distribution of spikes over the time course of the stimulus and a considerable variation of their timing from trial to trial. As in the edge responses, the contrast–response function has a monotonic rise over most of the available contrast range (Fig. 2 E), with a large variance of spike counts, as indicated by the error bars. The clustering analysis is shown in Figure 2 F. Unlike what was seen for edges, for gratings H(q) (thick line with filled circles) is maximal at q 5 0 (Hcount 5 0.63). As q increases, H(q) runs a rather flat course up to q ;50 sec 21, after which there is a sharp cutoff. The important difference between edge responses and grating responses in this neuron is that for drifting grating responses, Hcount maximizes H(q). This indicates that once spikes are counted, the temporal structure of the grating responses provides no additional information concerning their contrast.
6588 J. Neurosci., August 15, 1998, 18(16):6583–6598
Mechler et al. • Temporal Coding of Contrast Transients
Mechler et al. • Temporal Coding of Contrast Transients
Given the mostly flat, irregular response time course with little discernible systematic variation with increasing grating contrast of the complex cell, this is perhaps not a surprising result, but it is not merely confirmation of the intuition that there are no spikes with precise timing buried in the raster. As we see below, the lack of a temporal contribution to the level of contrast-dependent clustering of grating responses was found in most of the neurons in our sample, including simple cells that gave strongly modulated responses to gratings.
Single unit e xample: simple cell Figure 3 shows an analysis of edge responses (Fig. 3A–C) and grating responses (Fig. 3D–F ) for a typical simple cell, in the same format as the analysis of complex cell responses in Figure 2. For this cell, a nondirectional layer 6 neuron, the stimulus parameters were 0.3 cycle/°, 3 Hz (edge); 1.2 cycles/°, 5 Hz (grating). For both gratings and edges, contrast sensitivity was typical for our sample (threshold contrast was ;5%), and response was monotonic up to 30 – 40% contrast. At higher contrasts, the contrast–response f unction saturated and perhaps even turned down (Fig. 3 B, E). This neuron, like most simple cells, had no spontaneous activity in the presence of the blank (0% contrast in Fig. 3 A, D). For edges of increasing contrast, the response consisted of a burst of spikes of increasing intensity up to a saturating level near 30% contrast. Like most simple cells, it responded to the passage of an edge of one polarity but not the other. That is, there is only one response transient in the rasters (Fig. 3A), unlike the pair of transients seen for responses of typical complex cells to the drifting low-frequency square wave (Fig. 2 A). There is also a moderate phase advance in the responses with increasing contrast, as was seen in the responses to edges of the complex cell. Because this shortening of latency (Gawne et al., 1996) occurs for contrasts in which the spike count has saturated, it might be especially usef ul in discriminating among the higher contrast levels. However, given the trial-to-trial variability of the response onset, the utility of latency in signaling contrast is unclear from mere inspection of the rasters. The response magnitude is also quite variable, as indicated by the error bars in Figure 3B. The f unction H(q) is plotted in Figure 3C (thick lines with plus symbols). H(q) has an initial jump from Hcount 5 0.61 (at q 5 0) to a higher value at q 5 1 sec 21, the lowest nonzero value of q examined. The course of H(q) is a plateau over most of the sampled range, with a suggestion of a maximum near q 5 50 sec 21 (Hmax 5 0.82). H(q) declines sharply above q 5 250 sec 21. Subtracting the correction for the level of chance clustering (dashed line) does not change these general features. That is, a positive DH 5 Hmax 2 Hcount remains, indicating the presence of temporal coding of contrast in the responses of a simple cell to edges. As in this example, most other simple cells in our sample also had evidence of a temporal contribution to coding edge contrast, but the relative size of this contribution was usually smaller than in complex cells.
J. Neurosci., August 15, 1998, 18(16):6583–6598 6589
Figure 3D–F shows the results obtained in this simple cell with gratings. Unlike the complex cell of Figure 2, the response time course is not uniform. As contrast increases, the rasters (Fig. 3D) indicate increasingly compact responses, and there is the suggestion of a burst structure at the highest contrasts. The contrast– response function saturates at intermediate levels (Fig. 3E). Trialto-trial variability is large, both in terms of onset time (Fig. 3D) and spike counts (Fig. 3E). Despite the similarity in the response waveforms seen for this simple cell to both gratings and edges, H(q) has a different shape. For gratings (Fig. 3F, filled circles and thick line), H(q) is maximal at Hcount 5 H(0). That is, the changes seen in the response time course with increasing contrast are not reliable enough to add to the signaling of contrast. As in the case of the complex cell of Figure 2, the details of the temporal structure of spike trains do not add significantly to the contrastdependent segregation of clusters of responses to gratings.
Other examples This difference in temporal contribution to contrast information for edges and gratings was found in most of the neurons in our sample. Figure 4, A and B, shows examples of this for two more neurons. For each cell, the measure of stimulus-dependent clustering, H(q), based on the circular spike time metrics, with the level of chance clustering subtracted, is presented for edges ( plus symbols) and gratings ( filled circles). Figure 4 A shows results from a layer 4Ca nondirectional complex cell. For edges, H(q) has a maximum, Hmax 5 0.72, at qmax 5 22 sec 21, yielding a large DH, several times larger than Hcount 5 H(0). This is an example in which the spike count severely underestimates the ability of the neuron to signal contrast of edges. The position of qmax indicates that the level of contrast-dependent clustering is optimal for a temporal resolution of 45 msec; note that the period of the edge was 2000 msec. For the response of the same cell to gratings, H(q) is maximal at q 5 0 (Hcount 5 0.56, see arrowhead), indicating that spike counts carry the maximum contrast information. The analysis for the simple cell in Figure 4 B is a variation on this theme. For this neuron, there is evidence for the presence of temporal coding of contrast for both edges and gratings, but DH, the maximum increase in H(q) over H(0) associated with temporal coding, is larger for edges (0.28, 120% of Hcount ) than for gratings (0.08, 14% of Hcount ). For both gratings and edges, Hmax values are comparable in magnitude and occur at similar positions qmax ;20 sec 21 (corresponding to ;50 msec precision). This neuron had the largest DH among the simple cells in our sample. The simple cell in Figure 4C is one of three neurons in our sample that showed evidence for temporal coding for gratings but not for edges. This simple cell had the largest DH (0.26, 300% of Hcount ) for gratings among all the neurons in our sample, whereas the other two neurons (a simple and a complex cell) both exhibited very small DH for gratings. The peaks in the two clustering curves in Figure 4C are comparable in height. The curve for the edges is maximized by Hcount , whereas clustering for gratings
4 Figure 2. Analysis of temporal coding in contrast responses of a layer 6 nondirectional complex cell (mt926). A, C ycle-by-cycle raster plots of responses to edges (0.2 cycle/°, 1 Hz, 24 cycles at each contrast) at the seven different contrasts indicated on the right. Only a subset of the blank runs are shown. B, Semilogarithmic plot of the contrast–response f unction for edges based on the DC component of responses. Error bars are 61 SD. C, Level of contrast-dependent clustering (uncorrected for chance clustering), H( q), for edge responses (thick line with plus symbols), and the estimated level of chance clustering (dashed line) for the metrics D spike,circ[q], as a f unction of the cost parameter ( q). For the estimate of the level of chance clustering, 10 random reassignments were used, and the SE values of these estimates are indicated by the shaded reg ion. D, C ycle-by-cycle raster plots of responses of the same complex cell to gratings (1.6 cycle/°, 5 Hz, 40 cycles at each contrast) at seven different contrasts. Only a subset of the blank runs are shown. E, Contrast–response function for gratings, based on the DC component of responses. F, H( q) for the grating responses, plotted as in C.
6590 J. Neurosci., August 15, 1998, 18(16):6583–6598
Mechler et al. • Temporal Coding of Contrast Transients
Mechler et al. • Temporal Coding of Contrast Transients
J. Neurosci., August 15, 1998, 18(16):6583–6598 6591
Table 1. Summary of the population averages of measures of contrast-dependent clustering Type of data set and units Edge All S Cx Grating All S Cx
Hmax
No. of units
No. of units: Hmax . Hcount
DH/Hcount
Hcount
Dspike,circ
F all
F even
F odd
22 11 11
15 6 9
0.47 0.33 0.60
0.38 6 0.26 0.36 6 0.27 0.40 6 0.27
0.56 6 0.23 0.48 6 0.19 0.64 6 0.24
0.56 6 0.25 0.45 6 0.21 0.66 6 0.26
0.55 6 0.27 0.45 6 0.21 0.66 6 0.29
0.48 6 0.22 0.45 6 0.22 0.50 6 0.23
22 11 11
9 5 4
0.07 0.08 0.05
0.57 6 0.27 0.53 6 0.27 0.60 6 0.28
0.60 6 0.26 0.58 6 0.24 0.63 6 0.30
0.60 6 0.26 0.57 6 0.23 0.62 6 0.30
0.59 6 0.27 0.55 6 0.25 0.62 6 0.29
0.60 6 0.26 0.58 6 0.23 0.62 6 0.30
DH 5 Hmax 2 Hcount, the contribution by temporal structure, obtained with the metrics Dspike,circ[q], is averaged across cells before taking the ratio (DH/Hcount). Hmax, the average maximal level of clustering, is listed for the metrics Dspike,circ[q] and three families of metrics based on cumulative use of Fourier components: F all, F even, and F odd. The level of chance clustering is subtracted in all cases.
reaches its peak near q 5 100 sec 21 (equivalent to a temporal resolution of 10 msec).
Anal ysis across cells In most neurons, evidence for temporal coding of contrast was stronger for edges than for gratings. To quantif y this difference across the population of the 22 V1 neurons in this study, we plotted (Fig. 5) the level of contrast-dependent clustering obtained with spike count alone (Hcount ) on the horizontal axis against the maximum level (Hmax ) on the vertical axis. The estimate of the level of chance clustering was subtracted from each value. In this plot, each neuron is plotted twice, with plus symbols for edges and with filled circles for gratings. If the stimulus dependency of clustering is most reliable at q 5 0, then Hmax 5 Hcount , and the corresponding symbol falls on the identity line (diagonal ). This indicates the absence of a detectable temporal contribution to the coding of contrast. If, however, stimulusdependent clustering was most reliable at q . 0, then Hmax . Hcount , and the symbol falls above the identity line. This indicates a temporal contribution to the coding of contrast. Most of the points corresponding to gratings fell on or near the diagonal, and the largest vertical displacements from the diagonal are seen for edges. Table 1 summarizes the average level of contrast-dependent clustering based on spike counts (Hcount ), the average peak level of clustering (Hmax ) obtained with the metrics D spike,circ[q], the average relative contribution at the peak level from temporal coding (DH/Hcount ), and the number of cells with significantly positive DH. These averages are given for edges and gratings and for simple and complex cells. The level of chance clustering is subtracted in all cases. For most neurons, the stimulus dependency of clustering of responses to edges became more reliable when the underlying metric was sensitive to the temporal details of the spike trains. The average size of the increase was 47% of the average Hcount (60% in complex cells, 33% in simple cells; two-sample t test, significant difference at p , 0.05). However, for gratings, the spike count metric usually provided the most reliable stimulus-dependent clustering. Only a minority of neurons showed evidence for a temporal contribution to the coding of
grating contrast, and the size of this improvement was small (7% on average over spike counts). The average contrast-dependent clustering estimated as the population mean 6 1 SD of Hmax , was 0.60 6 0.26 for gratings and 0.56 6 0.23 for edges (n 5 22), not significantly different (paired t test, p . 0.14). This difference across stimulus types tended to be larger for simple cells than for complex cells, but was not statistically significant in either case. In keeping with the above difference in temporal contributions for gratings and edges, there was a significantly greater ( p , 0.01) level of clustering via spike counts alone for gratings (0.57 6 0.27) than for edges (0.38 6 0.23). Figure 5 and Table 1 provide an estimate of the contribution of temporal coding for gratings and edges but do not allow the comparison within cells. Figure 6 shows the contribution of temporal structure to the peak levels of clustering of responses to gratings (DHG ) and edges (DHE ) for each neuron. Open symbols represent simple cells, and filled symbols represent complex cells. For most of the neurons the measured contribution of temporal structure to contrast-dependent clustering was greater for edges than for gratings. Nine neurons exhibited a positive contribution exclusively for edges, but only three neurons (two simple and one complex cell) showed temporal contribution exclusively for gratings, and in only one of these three (Fig. 4C) was the contribution large. Four neurons had no significant temporal contribution to the level of contrast-dependent clustering for either stimulus class. Figure 6 sums up, in essence, the major finding of this study. We characterized the resolution of the temporal structure that contributes to the level of stimulus-dependent clustering via the cost parameter that maximizes H(q), qmax. The distribution of qmax is shown in Figure 7A. Each of the 22 neurons yielded two values of qmax: one derived from the edge responses, and one from the grating responses. Two-thirds of the data sets exhibited temporal coding (Hmax . Hcount , qmax . 0). For these, the distribution of qmax is wide, sampling a range of equivalent temporal resolution (1/qmax ) from 10 msec to 1 sec. The geometric mean of qmax was 17 sec 21 overall (18 sec 21 for edges and 16 sec 21 for gratings; not significantly different, p . 0.7), indicating,
4 Figure 3. Analysis of temporal coding in contrast responses of a layer 6 nondirectional simple cell (mt928). Data are plotted as in Figure 2. A–C, Edge responses (0.3 cycle/°, 3 Hz, 24 cycles at each contrast). D–F, Grating responses (1.2 cycle/°, 5 Hz, 40 cycles at each contrast). A, D, C ycle-by-cycle rasters of spikes. Only a subset of the blank runs are shown. B, E, Contrast–response f unction. C, F, H( q) (uncorrected, thick lines with symbols; correction for the level of chance clustering, dashed line; SE values of the correction estimates, shaded reg ion).
6592 J. Neurosci., August 15, 1998, 18(16):6583–6598
Mechler et al. • Temporal Coding of Contrast Transients
Figure 5. Comparison of the levels of contrast-dependent clustering obtained with spike counts and spike time metrics in 22 V1 neurons. Hcount , the level achieved with D count 5 D spike,circ[0], is plotted against Hmax , the level achieved with the optimal spike time metric D spike,circ[qmax]. Each neuron is represented by two data points: one for edges ( plus symbols) and one for gratings ( filled circles). Symbols lying above the diagonal Hcount 5 Hmax indicate a contribution of the temporal pattern of spikes to coding of contrast.
Figure 4. Comparison of the level of contrast-dependent clustering, H( q), for edges ( plus symbols), and gratings ( filled circles), for three V1 neurons. H( q) is determined for the metrics D spike,circ[q], and the level of chance clustering has been subtracted. An arrowhead points to the maximum of each H( q) curve. A and B are typical examples, C is an exceptional cell for which temporal structure contributes more strongly to the maximum of H( q) for responses to gratings than to edges. A, Layer 4Ca nondirectional complex cell (mt918). Edges, 0.3 cycles/°, 0.5 Hz, 12 cycles at each contrast; gratings, 4 cycles/°, 6 Hz, 48 cycles at each contrast. B, Layer 4Ca nondirectional simple cell (mt838). Edges, 0.2 cycle/°, 3 Hz, 24 cycles at each contrast; gratings, 0.6 cycle/°, 5 Hz, 80 cycles at each contrast. C, Layer 4B nonoriented simple cell (mt942). Edges, 0.15 cycle/°, 3 Hz, 24 cycles at each contrast; gratings, 0.5 cycle/°, 10 Hz, 80 cycles at each contrast.
on average, a temporal resolution for contrast of ;60 msec. Although overall temporal resolution was not significantly different in simple and complex cells, we found a significantly finer temporal resolution for edges in complex cells (29 sec 21) than in simple cells (10 sec 21; p , 0.02). Within complex cells, temporal
resolution for edges was significantly higher than for gratings (11 sec 21, p , 0.01). The relative contribution (;50% of the average Hcount ) of temporal structure to Hmax of edge responses is comparable to what we found for contrast responses of V1 neurons to stationary gratings flashed for 256 msec in the anesthetized macaque [contrast data of Victor and Purpura (1998) pooled across spatial phase]. In that study, which included responses to gratings of nonoptimal spatial frequency and orientation, population averages (after correction for the level of chance clustering) were Hcount 5 0.044, Hmax 5 0.068, DH 5 54% of Hcount , with a positive DH in 28 of 32 data sets. A data set comprising 15 contrast–response functions of V1 neurons of the awake behaving macaque (Victor and Purpura, 1996; reanalyzed) yielded somewhat larger values for these average quantities and for the relative contribution of temporal structure: Hcount 5 0.10; Hmax 5 0.31; DH 5 210% of Hcount. In 12 of 15 data sets there was a positive DH. The stimulus conditions in the latter study were the same as those of Victor and Purpura (1998). The geometric mean value of qmax obtained in the present study (17 sec 21) agrees well with values found for contrast coding of flashed stimuli in V1 of awake [21 sec 21; Victor and Purpura (1996), their Fig. 6 A] and anesthetized macaques [18 sec 21; contrast data of Victor and Purpura (1998), pooled across spatial phase]. Results of the present study and the previous two cited above indicate that the stimulus-dependent temporal contribution to contrast coding is too large (;50% or more) to be overlooked in evaluating the function of a neuron. Comparable contributions of temporal structure were also found for stimulus modalities other than contrast, such as spatial frequency and orientation, both in
Mechler et al. • Temporal Coding of Contrast Transients
Figure 6. Comparison of the temporal contribution to the maximum level of contrast-dependent clustering in the responses of 22 V1 neurons to gratings (DHG 5 Hmax, Grating 2 Hcount, Grating) versus edges (DHE 5 Hmax, Edge 2 Hcount, Edge). Neurons for which temporal pattern contributes to contrast-dependent responses for edges but not gratings occupy the top left region along the DHE axis in the scatter plot. Neurons with the opposite behavior are represented by symbols scattered near the DHG axis. As the scatter shows, most V1 neurons belong to the first group. Simple cells are represented with open symbols, complex cells with filled symbols.
the awake study of V1 and V2 neurons (Victor and Purpura, 1996) and in the study in anesthetized macaques (Victor and Purpura, 1998). The implication is that classical tuning curves based on the average firing rates can seriously underestimate the potential for visual neurons to signal characteristics of the stimulus. Such estimates critically influence our understanding of the neural mechanisms underlying behavior. For example, underestimating dynamic range in V1 neurons would result in overestimating the minimum size of the neuronal population over which pooling of signals is necessary to explain behaviorally measured contrast discrimination.
Cluster analysis based on Fourier components The above results demonstrate that within the same neuron, temporal coding (i.e., a systematic dependence of the temporal structure of the response on a nontemporal aspect of the stimulus) is prominent for one class of stimuli (drifting edges) and much less important for another (drifting gratings). It is conceivable, however, that the identification of temporal coding is in some way related to the unconventional analysis technique, i.e., a metric-space embedding in which any possible additive structure is simply ignored.
J. Neurosci., August 15, 1998, 18(16):6583–6598 6593
Figure 7. A, Distribution of the cost parameter (qmax , plotted logarithmically except for qmax 5 0) that maximizes H( q) based on D spike,circ[qmax]. Each of the 22 neurons is represented by two values, one for edges and one for gratings. The geometric mean of the nonzero values of qmax was 17 sec 21, indicating an average temporal resolution of 60 msec for the optimal spike time metric in those neurons in which temporal pattern contributed to stimulus-dependent clustering. The dark portion of the histogram is the distribution of complex cells. B, Distribution of the temporal frequency (tfmax 5 nmaxv) of the highest Fourier harmonic that was needed to maximize H(nv) based on the metric family F all (Fig. 8). The geometric mean of the nonzero values of tfmax was 9.6 Hz. Distribution of complex cells is indicated by the dark portion as in A.
For these reasons, we also analyzed our data in a manner based on Fourier components of the response. As will be seen below, Fourier components can be used to define several sequences of metrics, each of which forms the basis for a clustering calculation. In contrast to the spike time metrics, the Fourier metrics are also Euclidean distances that respect the additive and Euclidean structure of a vector space of responses. Thus, we will be able to determine whether the above results depend on the use of a nonEuclidean distance. On the other hand, if temporal coding is robust, it should be manifest in the analysis based on Fourier metrics as well. Because the Fourier metrics and the spike time metrics look at the same signals (the former in the frequency domain and the latter in the time domain), intuition suggests that the results obtained by the two approaches should closely correspond. However, this correspondence is not guaranteed because the algorithms involved in the Fourier approach are not simply transforms of algorithms used in the spike time analysis. Thus, a secondary motivation for the Fourier-based analysis is to determine whether the temporal coding we have identified in the time
6594 J. Neurosci., August 15, 1998, 18(16):6583–6598
domain corresponds to specific harmonics or specific frequency ranges within the response. The first step in construction of the Fourier-based metrics is cycle-by-cycle Fourier analysis of the responses of a neuron to each trial of a particular stimulus at integer multiples of the fundamental stimulus frequency. A set of estimates of k Fourier components of a response can be considered to be a set of 2k real numbers, representing the cosine and sine components at each of the k harmonics. These 2k-tuples are points in a 2k-dimensional vector space, and as such, are associated with a natural distance: the Pythagorean rule. This distance is Euclidean, but it depends on the number of harmonics (k), and on which k harmonics are chosen. Once these distances were calculated, we used the same clustering algorithm and measure of stimulus-dependent clustering ( H) that we used for the spike time metrics, thereby allowing for a direct comparison of results obtained using the different kinds of metrics. We considered four families of Fourier metrics, all parametric in a single frequency parameter, the highest (nth) response harmonic included in the analysis. These families are (1) F single[n], which includes only the single nth harmonic; (2) F all[n], which includes all harmonics up to the nth harmonic; (3) F even[n], which includes all even harmonics up to the nth harmonic, including the DC component; and (4) F odd[n], which includes all odd harmonics up to the nth harmonic and the DC component as well. Analysis based on the family F single[n] quantifies the relative importance of single response harmonics in temporal coding of contrast. For n 5 0, 1, and 2, it considers only the DC, first, and second harmonics of the response, which are commonly used to describe responses of V1 neurons to periodic visual stimulation. The other three families (F all[n], F even[n], and F odd[n]) provide a f uller characterization of the spike responses than single harmonics. For example, typical complex cell responses to drifting edges are double-peaked, but not necessarily sinusoidal, a feature that motivates F even[n]. On the other hand, typical simple cell responses to both gratings and edges are approximately half-wave rectified, indicating the presence of a mixture of at least one significant odd harmonic (the first) and perhaps several significant higher even harmonics. In both cases, analysis based on these metrics will indicate the extent to which the distinct harmonics have the potential to provide independent information concerning contrast. For each metric, the highest temporal frequency considered is equal to nv, where v is the temporal frequency of the stimulus. This combination plays a role that is similar to the role of the cost parameter q in the analysis based on spike time metrics. Both parameters have dimensions of reciprocal time (sec 21) and both specif y, in the inverse sense, a temporal scale above which details of the temporal structure in spike trains affect the calculated distance between them. We therefore analyze the level of stimulus-dependent clustering H as a f unction of the frequency of the nth harmonic, and we will display the results as a f unction of nv. The main quantities of interest will be the relative contribution of temporal pattern to the maximum level of clustering, as quantified by DH 5 Hmax 2 Hcount , as well as the temporal frequency at which maximum is obtained. (Note that for all four families, n 5 0 considers only the DC response and is thus identical to the spike count metric.)
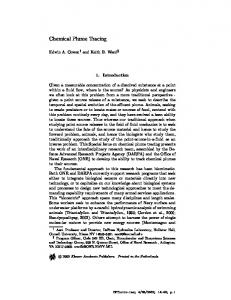
Single-unit e xamples The two illustrated cells (Fig. 8), one complex (top panels) and one simple (bottom panels), are typical and illustrate the main
Mechler et al. • Temporal Coding of Contrast Transients
points of the Fourier-based cluster analysis. For each cell, data obtained with gratings are shown in the left panels, and data obtained with edges are shown in the right panels. The five curves in each panel indicate the level of stimulus-dependent clustering H(q) obtained with the family of D spike,circ[q] of spike time metrics (thick solid line), and H(nv) obtained with the four families of Fourier-based metrics (dotted line for F single[n]; thin lines with asterisks for F all[n]; thin lines with plus symbols for F even[n]; and thin lines with open circles for F odd[n]). For the Fourier metrics, H is plotted as a function of nv, where v is the temporal frequency of the stimulus (in Hertz) and n is the highest harmonic of this frequency used in the metric. For all curves, the estimated level of chance clustering has been subtracted. All curves share the same value of H(0) because this is the measure of contrast-dependent clustering based on spike counts only. In each panel, H(nv) obtained with one or more of F all, F even, and F odd run a course similar to that of the H(q) curve. However, H(nv) based on F single always has a very different course; it decreases after the first few harmonics but then maintains a relatively constant low level thereafter, often crossing the other curves after they decline at high frequencies. The H curves based on the metric family F single exhibit low levels of information content and more variation than those based on cumulative use of Fourier harmonics because of the low signal-to-noise in single harmonic components at intermediate-to-high temporal frequencies. The peak of the H(nv) curve based on F single was always at one of the first three (n 5 0, 1, or 2) harmonics. Except for data sets in which there was no evidence of temporal coding (i.e., those in which maximal level of clustering occurred for the spike count metric), this peak was not as high as the peaks attained by one or more of the other Fourier metric series or by the series of spike time metrics. Thus, using a single response harmonic results in underestimation of temporal coding, even if much of the signal in the response power is at one or only a few frequencies. In other words, distinct Fourier components of the response are not redundant and contain at least partially independent contrast information. The other common feature of the data is that at very high frequencies and values of q, H(nv) based on F single exceeds H(nv) based on the other metrics. Most likely, this is because at high frequencies, all response amplitudes are very small, but there is likely a persistent small stimulus-related signal carried in the phase. The lack of a sharp decline in H(nv) calculated with F single is consistent with this notion because phase differences tend to scale in proportion to frequency. On the other hand, the highfrequency cutoff in H(nv) obtained with metrics that use harmonics in a cumulative manner indicates that the stimulus-related signals across high-frequency harmonics are redundant and that their cumulative use mostly accumulates noise. Thus, the curves of H(nv) based on F all, F even, and F odd decline rapidly at high frequencies and cross the curve of H(nv) based on F single. The three metric families that make cumulative use of the Fourier harmonics show differences in the H(nv) function for the edge data that shed new light on the known properties of simple and complex cells. For the complex cell, F even shows evidence of temporal coding to an extent comparable to D spike,circ, but the persistent low values of H(nv) for F odd indicate that the odd harmonics have no consistent stimulus-dependent behavior (Fig. 8 B). For the simple cell (Fig. 8 D), the reverse is seen: F odd and D spike,circ give rise to comparable values of H(nv), but F even gives rise to smaller values of H(nv). The result for complex cells is
Mechler et al. • Temporal Coding of Contrast Transients
J. Neurosci., August 15, 1998, 18(16):6583–6598 6595
Figure 8. Comparison of H(nv) based on four families of Fourier metrics (F single, thin dotted lines; F all, thin line with asterisk; F even, thin lines with plus symbols; F odd, thin lines with open circles), and H( q) based on spike time metrics (thick line with no symbols) in two typical V1 neurons. A, B, Analysis of grating ( A) and edge ( B) responses of a layer 4Ca complex cell (mt918, stimulus conditions as in Fig. 4 A). C, D, Analysis of grating ( C) and edge ( D) responses of a layer 6 simple cell (mt829; edges, 0.36 cycle/°, 1.25 Hz, 15 cycles at each contrast; gratings, 6.1 cycles/°, 4 Hz, 32 cycles at each contrast). For each data set, the five H curves are shown on comparable abscissae; for the Fourier metrics, as a f unction of the frequency (in Hertz) of the highest harmonic used, for the spike time metrics, as a f unction of the cost parameter q (sec 21).
Mechler et al. • Temporal Coding of Contrast Transients
6596 J. Neurosci., August 15, 1998, 18(16):6583–6598
expected because it responds almost equally well to passes of both polarities of an edge, so its response is concentrated in the even harmonics. This also explains the strong magnitude alternation between odd and even harmonics up to the eighth harmonic seen in the H curve based on F single (Fig. 8 B). For the simple cell, it is not surprising that the odd harmonics contribute to signaling. However, two points are unexpected: for both kinds of cells, different low-harmonic components are nonredundant (i.e., combining multiple components leads to a greater level of stimulusdependent clustering than any single frequency alone), and for simple cells, even-harmonic components do not provide any independent temporal information. In the grating data (Fig. 8 A, C), analysis based on Fourier components confirms what was found with spike time metrics: the DC component (or spike count) gives rise to similar or higher values of H to those obtained with metrics that, in using the higher harmonics, exploit temporal structure. For the complex cell (Fig. 8 A) neither H(q) nor any of the Fourier metrics showed evidence for temporal coding. The sharp drop in F single for all nonzero frequencies is not surprising, because a typical complex cell responds to a drifting sinusoidal grating near its spatial frequency optimum primarily by elevating its spike rate (Movshon et al., 1978a; Skottun et al., 1991). For the simple cell (Fig. 8C), the first harmonic alone leads to a greater level of stimulus-dependent clustering than the DC component, as seen in the initial two values of H(nv), obtained with F single (dotted line in bottom lef t). Significant levels of stimulus-dependent clustering based on the first harmonic is expected because a typical grating response of a simple cell typically resembles a half-wave rectified sinusoid, which is dominated by a DC component and its first harmonic. A metric that uses the DC and the first harmonic component together (F odd for n 5 1, plotted at 4 Hz) leads to the maximal level of H(nv) within F odd and also across the other Fourier metrics. However, the difference between the maximum in H(nv) and Hcount is slight, indicating little temporal coding.
Anal ysis across cells To make an overall comparison between the time-domain analysis and the Fourier metrics, we compared H(q) based on D spike,circ with H(nv) based on F all. As seen in Table 1, the extent of the contribution of temporal structure was comparable for both stimulus classes and both cell types. Across the sample of complex cells, Hmax based on F all and F even were similar and, for edges, greater than the maximum levels of contrast-dependent clustering based on F odd, as in the example of Figure 8 B. Across the sample of simple cells, Hmax based on F all, F even, and F odd were similar. To correlate the estimates of the temporal resolution, we compared qmax as determined from H(q), based on D spike,circ, with the frequency tfmax for which H(nv), based on F all, achieves maximum (Fig. 7B). (tfmax 5 nmaxv, where nmax is the harmonic for which F all[n] achieves maximal clustering, and v is the fundamental temporal frequency of the stimulus.) The geometric mean of tfmax is very nearly half of the geometric mean of qmax. This twofold difference was seen within individual neurons, too (Fig. 8). This factor of two likely reflects a difference in the way that the quantities q and nv enter into their respective metrics; shifting a spike by an amount 1/q is equivalent to removing it altogether, but shifting it by only 1/(2nv) (half of the period 1/nv) results in a maximal change in the nth Fourier component. Another way of looking at this is that the minimum temporal interval required to
sample a single frequency is half of its period (i.e., the Nyquist limit). The following features of the Fourier-based analysis of temporal coding were found in all cells of our sample. Evidence for temporal coding (i.e., DH . 0) was found for the Fourier-based metrics when and only when it was found with the spike time metrics. Moreover, provided that the appropriate family of Fourier metrics was used (i.e., edge responses for complex cells, assessed with F even, and for simple cells, assessed with F odd), Hmax was within 10% of the maximum of H(q) determined from the spike time metrics D spike,circ[q]. The temporal frequency at which H(nv) had its maximum Hmax was correlated well with 1/qmax (r 5 0.82; p , 0.01), and the shapes of H(nv) and H(q) were similar, up to the factor of two translation discussed above.
DISCUSSION We use the term temporal coding to indicate the presence of reproducible stimulus-dependent changes in the temporal structure of a spike train. This work focuses on the identification and characterization of such changes. The rate coding versus temporal coding distinction is not a dichotomy; rather, it is a matter of identifying the time scale over which instantaneous firing probability depends systematically on the stimulus. If this interval is short, then the detailed temporal pattern contains information about the stimulus. If this interval is long (i.e., comparable to the entire response duration), then the temporal code effectively reduces to a rate code. The idealized properties of neurons (i.e., linearity of spatial and/or temporal summation) provide mechanisms for rate coding. Well documented and prominent deviations from these ideal behaviors (i.e., thresholds and time- and voltage-dependent conductances, among others) provide mechanisms for temporal coding. Despite the potential advantages and plausibility of temporal coding (see introductory remarks), the extent to which the brain actually makes use of it is unclear. In other sensory systems, in audition (Abeles and Gerstein, 1988; Middlebrooks et al., 1994) and in olfaction (Laurent et al., 1996; Wehr and Laurent, 1996), temporal pattern can convey information that firing rate overlooks. A direct demonstration that temporal coding is used is very difficult: it would require experimental manipulation of the detailed structure of spike trains without changing their mean rate and observation of the presence (or absence) of a behavioral change. The technical difficulties of such an experiment are compounded by the fact that temporal coding and rate coding are not mutually exclusive; indeed, stimulus-dependent changes in temporal structure typically occur along with stimulus-dependent changes in firing rate (Victor and Purpura, 1996). Thus, changes in temporal structure (e.g., synchrony) might contribute to the behavioral changes that are observed when rate is manipulated (Salzman and Newsome, 1994). Furthermore, physiological changes in temporal structure might be coupled to changes in mean rate, thus precluding a direct experimental dissection. Several studies (Purpura et al., 1993; Victor and Purpura, 1996; Richmond et al., 1997; K. Purpura and L. M. Optican, unpublished observations) have provided evidence for temporal coding of contrast in neurons of the macaque visual cortex. In these studies, transiently presented static stimuli (textures or gratings) were used. Because drifting sinusoids are commonly used in vision research, but responses are not analyzed for temporal coding, it is unclear whether the transient nature of the stimulus is essential for temporal coding, or, alternatively, whether apparent “temporal coding” is merely an artifact of complex analytic
Mechler et al. • Temporal Coding of Contrast Transients
techniques. We resolve this question by comparing, within the same V1 neurons, responses to transient stimuli (drifting square waves of low spatial frequency, called edges) and steady-state stimuli (optimal drifting sinusoidal gratings). It appears that temporal coding is present under circumstances in which the dynamic contrast gain control mechanism (Albrecht and Geisler, 1991; Bonds, 1991; Heeger, 1992; Victor et al., 1997) is active. This mechanism (which could be viewed as short-term contrast adaptation) is a prominent nonlinearity in V1 that acts on the order of #1 sec. The area over which the contrast signal is pooled by the gain control is local, comparable to a receptive field size (DeAngelis et al., 1992). For edges and flashed stimuli, the contrast signal changes rapidly and provides a dynamic input to the nonlinearities of the contrast gain control. For gratings, however, the contrast signal is constant and does not engage the nonlinearities of the gain control. Contrast-reversed standing gratings may represent intermediate stimuli in that the temporal modulation f unction determines whether there is an abrupt change in contrast adaptation level. We show here that drifting edges generate responses in which the temporal pattern of spikes robustly contributes to the signaling of contrast, especially for complex cells. Responses to drifting gratings, even if phasic, show almost no evidence of temporal coding. These results were obtained by two types of analysis: a time-domain approach that used non-Euclidean spike time metrics, and a frequency-domain approach that used a vector space (Euclidean) metric. Thus, temporal coding is not an artifact of the particular choice of the analytic approach but is rather associated with the nature of the stimulus. Our results provide evidence for robust temporal coding of contrast information in V1 responses for transients. The temporal contribution to contrast coding is too large to be overlooked in evaluating the f unction of a neuron. Underestimating the dynamic range in V1 neurons (by reliance on spike counts alone) might result in overestimating the minimum size of the neuronal population necessary to explain behavioral contrast discrimination (Parker and Newsome, 1998). Regardless of the method of analysis, the temporal resolution of the code for contrast transients was found to be, on average, ;50 msec, with a range of 10 –100 msec, in agreement with earlier estimates in V1. It has been argued that the latency of V1 neuronal responses, which can change by as much as 50 msec across contrasts, is important for coding of contrast (Gawne et al., 1996). Given our precision estimate, response latency (or phase at any single frequency) is not the only form of the available temporal information. The typical response of a V1 neuron to a drifting edge contains several (up to a dozen or more) response harmonics. For most neurons, combining phases and amplitudes at several harmonics, up to a certain frequency, increases the ability of the neuron to discriminate contrasts. One of the most enduring issues in the physiology of vision is the function of V1 neurons classified as simple and complex. Simple cells have long been viewed (Hubel and Wiesel, 1962, 1968) as excellent candidates for edge or feature detection, whereas complex cells have been considered to be better suited for Fourier-based texture analysis (Albrecht et al., 1980; De Valois and De Valois, 1980; De Valois et al., 1982, 1985). Our work shows that complex cells are as well equipped as simple cells to distinguish edges on the basis of contrast, provided that the temporal structure of the response is considered. (This does not necessarily imply that complex cells signal the contrast polarity,
J. Neurosci., August 15, 1998, 18(16):6583–6598 6597
position, or time of passage of an edge more precisely than simple cells). In natural viewing, the world is presented to our visual system in a succession of transients because of moving object boundaries and also because of saccadic eye movements (Viviani, 1990). Transients and object boundaries are salient natural features that effectively direct attention and trigger saccades (Yantis and Jonides, 1996). The neuronal mechanism involved in attention grabbing must be fast, efficient, and reliable. In the V1 neurons of this study, consistent with other studies (Gawne et al., 1996), higher-contrast transients triggered quicker and brisker onset signals that were often burst-like. Several lines of evidence indicate that bursts are more reliably transmitted across central synapses than single spikes (Lisman, 1997). Thus bursts may provide the substrate for such fast, efficient, and reliable low-level neural mechanisms that must underlie the effectiveness of transient stimuli at orienting attention. It is worthwhile to consider how the appearance of temporal coding might be associated with stimulus transience. At the time of a transient visual input (either attributable to a saccadic eye movement or to a transient visual stimulus), many neurons fire a burst of spikes. This burst, although perhaps not specific to the visual stimulus, nevertheless provides a reset or reference point in time, thereby enhancing the informative value of the timing of later spikes (Victor and Purpura, 1996). With the exception of an ideal Poisson process, the information in the timing of a single spike increases if there is knowledge of the time of the preceding spike. The integrate-and-fire neuron (Knight, 1972) provides an example: the interspike interval precisely indicates the mean level of the stimulus over this interval. A more elaborate example of this idea is contained in a model recently proposed (Hopfield, 1995) in which delay times represent sensory quantities. The cortex has neural mechanisms that may exploit the resetting effect of a stimulus transient. These mechanisms include not only sensitivity to coincidences but also long inhibitory time constants that could extend the time over which a subpopulation of neurons remains reset by the stimulus (Buzsaki and Chrobak, 1995; Douglas et al., 1995).
REFERENCES Abbott L F, Varela JA, Sen K , Nelson SB (1997) Synaptic depression and cortical gain control. Science 275:220 –224. Abeles M (1982) Role of the cortical neuron: integrator or coincidence detector? Isr J Med Sci 18:83–92. Abeles M, Gerstein GL (1988) Detecting spatiotemporal firing patterns among simultaneously recorded single neurons. J Neurophysiol 60:909 –924. Abramson N (1963) Information theory and coding. New York: McGraw-Hill. Albrecht DG, Geisler WS (1991) Motion selectivity and the contrastresponse f unction of simple cells in the visual cortex. Vis Neurosci 7:531–546. Albrecht DG, De Valois RL, Thorell LG (1980) Visual cortical neurons: are bars or gratings the optimal stimuli? Science 207:88 –90. Alonso JM, Usrey W M, Reid RC (1996) Precisely correlated firing in cells of the lateral geniculate nucleus. Nature 383:815– 819. Berry II MJ, Meister M (1998) Refractoriness and neural precision. J Neurosci 18:2200 –2211. Bonds AB (1991) Temporal dynamics of contrast gain in single cells of the cat striate cortex. Vis Neurosci 6:239 –255. Bourne HR, Nicoll R (1993) Molecular machines integrate coincident synaptic signals. C ell 72:65–75. Buzsaki G, Chrobak JJ (1995) Temporal structure in spatially organized neuronal ensembles: a role for interneuronal networks. Curr Opin Neurobiol 5:504 –510. C arlton AG (1969) On the bias of information estimates. Psychol Bull 71:108 –109.
6598 J. Neurosci., August 15, 1998, 18(16):6583–6598
Cline H (1997) Coincidence detection in the nervous system. Trends Neurosci 19:566 –567. DeAngelis GC, Robson JG, Ohzawa I, Freeman RD (1992) Organization of suppression in receptive fields of neurons in cat visual cortex. J Neurophysiol 68:144 –163. De Valois RL, De Valois K K (1980) Spatial vision. Annu Rev Psychol 31:309 –341. De Valois RL, Albrecht DG, Thorell LG (1982) Spatial frequency selectivity of cells in macaque visual cortex. Vision Res 22:545–559. De Valois RL, Thorell LG, Albrecht DG (1985) Periodicity of striatecortex-cell receptive fields. J Opt Soc Am 2:1115–1123. Douglas RJ, Koch C, Mahowald M, Martin K A, Suarez HH (1995) Recurrent excitation in neocortical circuits. Science 269:981–985. Eldridge JL (1979) A reversible ophthalmoscope using a corner-cube. J Physiol (Lond) 295:1P–2P. Enroth-Cugell C, Robson JG (1966) The contrast sensitivity of retinal ganglion cells of the cat. J Physiol (L ond) 187:517–561. Gawne TJ, Kjaer TW, Richmond BJ (1996) Latency: another potential code for feature binding in striate cortex. J Neurophysiol 76:1356 – 60. Gerstner W, Kreiter AK, Markram H, Herz AV M (1997) Neural codes: firing rates and beyond. Proc Natl Acad Sci USA 94:12740 –12741. Hawken MJ, Parker AJ, L und JS (1988) Laminar organization and contrast sensitivity of direction-selective cells in the striate cortex of the Old World monkey. J Neurosci 8:3541–3548. Hawken MJ, Shapley RM, Grosof DH (1996) Temporal-frequency selectivity in monkey visual cortex. Vis Neurosci 13:477– 492. Heeger DJ (1992) Normalization of cell responses in cat striate cortex. Vis Neurosci 9:181–197. Hochstein S, Shapley RM (1976) Quantitative analysis of retinal ganglion cell classifications. J Physiol (L ond) 262:237–264. Hopfield JJ (1995) Pattern recognition computation using action potential timing for stimulus representation. Nature 376:33–36. Hubel DH, Wiesel TN (1962) Receptive fields, binocular interaction and functional architecture in the cat’s visual cortex. J Physiol (L ond) 160:106 –154. Hubel DH, Wiesel TN (1968) Receptive fields and f unctional architecture of monkey striate cortex. J Physiol (L ond) 195:215–243. Kaplan E, Shapley RM (1982) X and Y cells in the lateral geniculate nucleus of macaque monkeys. J Physiol (L ond) 330:125–143. Knight BW (1972) Dynamics of encoding in a population of neurons. J Gen Physiol 59:734 –766. Konig P, Engel AK, Singer W (1996) Integrator or coincidence detector? The role of the cortical neuron revisited. Trends Neurosci 19:130 –137. Laurent G, Wehr M, Davidowitz H (1996) Temporal representations of odors in an olfactory network. J Neurosci 16:3837–3847. Lisman JE (1997) Bursts as a unit of neural information: making unreliable synapses reliable. Trends Neurosci 20:38 – 43. Mainen ZF, Sejnowski TJ (1995) Reliability of spike timing in neocortical neurons. Science 268:1503–1506. Markram H, Lubke J, Frotscher M, Sakmann B (1997) Regulation of synaptic efficacy by coincidence of postsynaptic APs and EPSPs. Science 275:213–215. Mechler F, Victor JD, Purpura K , Shapley R (1997) Temporal encoding of contrast by V1 neurons is greater for transient than steady-state stimuli. Soc Neurosci Abstr 23:567. Merrill EG, Ainsworth A (1972) Glass-coated platinum-plated tungsten microelectrodes. Med Biol Eng 10:662– 672.
Mechler et al. • Temporal Coding of Contrast Transients
Middlebrooks JC, C lock AE, Xu L, Green DM (1994) A panoramic code for sound location by cortical neurons. Science 264:842– 844. Movshon JA, Thompson I D, Tolhurst DJ (1978a) Spatial summation in the receptive fields of simple cells in the cat’s striate cortex. J Physiol (L ond) 283:53–77. Movshon JA, Thompson I D, Tolhurst DJ (1978b) Receptive field organization of complex cells in the cat’s striate cortex. J Physiol (Lond) 283:79 –99. Optican L M, Richmond BJ (1987) Temporal encoding of twodimensional patterns by single units in primate inferior temporal cortex. III. Information theoretic analysis. J Neurophysiol 57:162–178. Parker AJ, Newsome W T (1998) Sense and the single neuron: probing the physiology of perception. Annu Rev Neurosci 21:227–277. Purpura K , Chee-Orts M N, Optican L M (1993) Temporal encoding of texture properties in visual cortex of awake monkey. Soc Neurosci Abstr 19:771. Richmond BJ, Optican L M (1987) Temporal encoding of twodimensional patterns by single units in primate inferior temporal cortex. II. Quantification of response waveform. J Neurophysiol 57:147–161. Richmond BJ, Optican L M (1990) Temporal encoding of twodimensional patterns by single units in primate primary visual cortex. II. Information transmission. J Neurophysiol 64:370 –380. Richmond BJ, Gawne TJ, Jin GX (1997) Neuronal codes: reading them and learning how their structure influences network organization. Biosystems 40:149 –157. Salzman CD, Newsome W T (1994) Neural mechanisms for forming a perceptual decision. Science 264:231–237. Skottun BC, De Valois RL, Grosof DH, Movshon JA, Albrecht DG, Bonds AB (1991) C lassif ying simple and complex cells on the basis of response modulation. Vision Res 31:1079 –1086. Softky W (1994) Sub-millisecond coincidence detection in active dendritic trees. Neuroscience 58:13– 41. Treves A, Panzeri S (1995) The upward bias in measures of information derived from limited data samples. Neural Comput 7:399 – 407. Victor JD, Purpura K P (1996) Nature and precision of temporal coding in visual cortex: a metric-space analysis. J Neurophysiol 76:1310 –1326. Victor JD, Purpura K P (1997) Metric-space analysis of spike trains: theory, algorithms and application. Network 8:127–164. Victor JD, Purpura K P (1998) Spatial phase and the temporal structure of the response to gratings in V1. J Neurophysiol, in press. Victor JD, Conte MM, Purpura K P (1997) Dynamic shifts of the contrast-response f unction. Vis Neurosci 14:577–587. Viviani P (1990) Eye movements in visual search: cognitive, perceptual and motor control aspects. Rev Oculomot Res 4:353–393. Volgushev M, Voronin L L, Chistiakova M, Singer W (1997) Relations between long-term synaptic modifications and paired-pulse interactions in the rat neocortex. Eur J Neurosci 9:1656 –1665. Volgushev M, Chistiakova M, Singer W (1998) Modification of discharge patterns of neocortical neurons by induced oscillations of the membrane potential. Neuroscience 83:15–25. Wehr M, Laurent G (1996) Odour encoding by temporal sequences of firing in oscillating neural assemblies. Nature 384:162–166. Yantis S, Jonides J (1996) Attentional capture by abrupt onsets: new perceptual objects or visual masking? J E xp Psychol Hum Percept Perform 22:1505–1513.


![[inria-00326716, v1] Spatio-temporal Feature ... - University of Surrey](https://m.moam.info/img/260x300/inria-00326716-v1-spatio-temporal-feature-universi_59e5dd0c1723dd94f9b0536f.jpg)